On the metallicity of the Milky Way thin disc and photometric abundance scales
Abstract
The mean metallicity of the Milky Way thin disc in the solar neighbourhood is still a matter of debate, and has recently been subject to upward revision (Haywood, 2001). Our star sample was drawn from a set of solar neighbourhood dwarfs with photometric metallicities. In a recent study, Reid (2002) suggests that our metallicity calibration, based on Geneva photometry, is biased. We show here that the effect detected by Reid is not a consequence of our adopted metallicity scale, and we confirm that our findings are robust. On the contrary, the application to Strömgren photometry of the Schuster & Nissen metallicity scale is problematic. Systematic discrepancies of about 0.1 to 0.3 dex affect the photometric metallicity determination of metal rich stars, on the colour interval 0.22 0.59, i.e including F and G stars. For F stars, it is shown that this is a consequence of a mismatch between the standard sequence of the Hyades used by Schuster & Nissen to calibrate their metallicity scale, and the system of Olsen (1993, 1994ab). It means that although Schuster & Nissen calibration and Olsen photometry are intrinsically correct, they are mutually incompatible for metal rich, F-type stars. For G stars, the discrepancy is most probably the continuation of the same problem, albeit worsened by the lack of spectroscopic calibrating stars. A corrected calibration is proposed which renders the calibration of Schuster & Nissen applicable to the catalogues of Olsen. We also give a simpler calibration referenced to the Hyades sequence, valid over the same colour and metallicity ranges.
keywords:
stars: late-type – Galaxy: abundances – (Galaxy:) solar neighbourhood – Galaxy: evolution1 Introduction
Solar neighbourhood stars serve as reference to which we compare the characteristics of the Galaxy outside the immediate solar vicinity, and their properties scale our measurements of the galactic structure and evolution. In view of their importance, it is somehow surprising that their general properties, such as the mean metallicity of the galactic disc stars, is still a matter of debate. In a recent paper (Haywood 2001), we constructed a metallicity distribution from stars within 20pc from the sun. This new metallicity distribution was shown to be centred on solar metallicity, or 0.1-0.2 dex higher than the value found in most previous studies. We discussed that this discrepancy is the result of various biases that enter the definition of these samples, the principal effect being caused by the selection of samples on the basis of spectral type. Another sensitive effect comes from the adopted metallicity scale. The choice of a given metallicity scale is determined from two criteria : the necessity to utilise stars with as low masses as possible, in order to avoid biases favouring young stars, and available photometry. The most widely used photometry for studying the metallicity distribution is the Strömgren photometry, with the metallicity scale from Schuster & Nissen (1989) (hereafter SN). In our own study, and while the calibration of SN is given as valid down to =0.59 (B-V1.0), we used Geneva photometry and the metallicity scale from Grenon (1978) for stars redder than (B-V0.67). The reason for this choice was that Geneva photometry is available for a larger set of solar neighbourhood K dwarfs. Hence, in the initial sample used by Haywood (2001), approximately half the stars had their metallicity determined from Strömgren photometry, the other half from Geneva photometry.
In a recent paper, Reid (2002) finds that the (B-V,[Fe/H]) distribution of our sample shows a trend of about 0.2 dex from B-V=0.5 to B-V=1.0, suggesting that the calibration from Grenon (1978) is plagued by a systematic error. By constrast, his (B-V, [Fe/H]) distribution, based entirely on the metallicity scale of SN, shows no such trend, if characterized by a simple linear regression. Most recently, and while terminating our paper, a study on the same subject was presented by Twarog, Twarog & Tanner (2002), exactly pointing to the problem we had discovered in Reid (2002) and that motivated the present work - a severe apparent deficiency in the metallicity scale of SN, causing underestimates of the photometric metallicity of late G type and early K type metal rich stars.
It appears however that the study by Twarog et al. has underestimated the discrepancy between photometric and spectroscopic abundances, in the sense that this problem also affects F-type stars, in contrast with their claim. Moreover, while they suggest that the origin of this discrepancy is an unsuspected high dependence of the metallicity on the index, we propose that it probably originates in a mismatch between the standard sequence adopted in SN - which comes from Crawford (1975) - and the one that can be deduced from the photometric catalogues of Olsen (1993, 1994ab) (see also Olsen (1984), table VI), which constitute the vast majority of available measurements of Strömgren photometry. The aim of the present paper is threefold :
(1) In section 2, we first present the discrepancy and quantify its amplitude on the whole colour range, that is between 0.22 0.59.
(2) In section 3, we propose an explanation for the origin of this effect, and give a corrected calibration, for which we calculate new coefficients on the basis of an enlarged spectroscopic dataset. Using the same spectroscopic calibrating stars, we also give an alternative calibration using and .
(3) Section 4 is a brief discussion of the impact of the photometric calibration on the metallicity distribution of the solar neighbourhood stars. In particular, it is demonstrated that the part of the sample in Haywood (2001) that is concerned by this effect is unchanged by the new calibration. That means that the results presented in Haywood (2001) are robust.

2 The colour-metallicity distribution
Reid (2002) suggested that the Geneva calibration used in Haywood (2001) may be affected by a colour term. This is illustrated in his Fig. 6b, also shown here (Fig. 1a) for convenience. The linear regression on plot(a) shows that there is a trend of metallicity with colour. We note that although Reid (2002) presents the trend as being due to the Geneva metallicity calibration, his fit is however made on the entirety of our sample, which is a mixed of Geneva and Strömgren metallicities (the Geneva metallicities being used for stars redder than B-V0.67). His remark stems from the fact that Strömgren metallicities (using the calibration of SN) in his sample show no such trend (regression line on Fig. 1b). It implies a priori that our calibration for red stars is questionable. Reid does not seem to envisage an intrinsic trend in our sample nor an effect caused by the metallicity scale of SN. He suggests that the trend is caused by the metallicity of the reddest stars in our sample. However, looking at the Fig. 6a in Reid (2002) (our Fig. 1b), we find the strangely distorted feature that makes the upper part of the colour-metallicity distribution rather suspect (it seems to imply that there are no stars with super-solar metallicities at B-V=0.85-0.95). In order to elucidate the origin of these different trends, we decided to investigate in more detail the behavior of these two calibrations.
There may be three reasons for the trend reflected in the linear regression of Fig. 1a :
-
1.
The Geneva calibration is biased, as suggested by Reid (2002), giving overestimated metallicities for red (B-V0.8) objects.
-
2.
The Strömgren calibration is biased, giving underestimated metallicities in the blue (B-V0.67). But then, we must understand why Reid’s (2002) sample shows no apparent trend in colour.
-
3.
The trend is real and is determined by the sample selection. But then it also must be explained why Reid’s sample shows no such effect.
There are two different ways we can check the metallicity calibrations. We can use cluster data, and test each calibration on clusters with well determined metallicities. The Hyades sequence is well appropriate for such work, and will be used below. A second way is to use spectroscopic data. A number of spectroscopic metallicities have been published in the recent years. And while they are still relatively sparse for K type stars, we shall pay particular attention to possible colour effects. To complement these two, we can search for systematic effects with the position of stars in the HR diagram. For example, the scarcity of stars redder than B-V=0.8 and more metal-poor than [Fe/H]=-0.4 contributes to the trend that is seen on Fig. 1a (we note, however, that this feature is also present in the Strömgren sample, Fig. 1b). We may check if a corresponding feature is also seen in the HR diagram in our sample.


2.1 The Hyades cluster test
Fig. 1ab shows the (B-V, [Fe/H]photo) diagrams for the samples of Haywood (2001) and Reid (2002). The horizontal line shows the median metallicity of the Hyades cluster as determined from a sample of spectroscopic metallicities in Perryman et al. (1998) at [Fe/H]=+0.14. The star symbols show Hyades members with metallicity as determined from the calibration of Grenon (Fig. 1a) and the calibration of SN (Fig. 1b). Since the calibration by Grenon (1978) was designed by reference to the Hyades sequence, it is not surprising (but reassuring) that the plot shows consistency with the spectroscopic determination.
Different is the result of the calibration of SN applied to the Hyades cluster members, as seen on Fig. 1b. The figure shows systematic deviations from the Hyades metallicity, which follow those of field stars. The Hyades metallicity is underestimated by about 0.15 dex at B-V=0.5-0.60, and the effect is even stronger at B-V0.8 with a 0.3-0.4 dex offset. This last feature is the one discussed by Twarog et al. (2002). In the blue part of the interval, it is not clear how much solar metallicities (i.e [Fe/H]0) would be affected by the bias, at least solely from the Hyades cluster test. The bias may affect only metal-rich stars. At redder colours, it is however probable that even solar metallicity stars have their metallicities underestimated by at least 0.15 dex. This can be checked on spectroscopic data (section 2.2). While we postpone our explanation to section 3, it is worth noting here that the calibration itself is not responsible for the effect that is seen on Fig. 1b at . It is its application to available Strömgren photometry which is in question. What is relevant at the moment is that the (B-V,[Fe/H]SN) distribution of Fig. 1b is strongly biased and the apparent lack of correlation given by the linear regression is meaningless.
Reid (2002) notes a general offset of about 0.1 dex in the Strömgren metallicity scale, following the similar result of Alonso, Arribas & Martinez-Roger (1996) and Haywood (2001). Since all the comparisons in Reid (2002) are relative and made in the system of the SN calibrations, the zero point is a priori not crucial. However, the differential effect in colour is sufficiently strong that Reid (2002) acknowledges that his metallicity distribution (after rescaling by 0.1 dex) still has a less extended tail towards metal rich stars compared to Favata et al. (1997) and Haywood (2001). Although Reid (2002) does not question further on the possible origin of this discrepancy, the direct reason for this effect is particularly conspicious on the (B-V,[Fe/H]SN) distribution: SN metallicities are artificially lowered below [Fe/H]=-0.1 at 0.8B-V0.95 and below [Fe/H]=0.0 at B-V0.65.
2.2 Spectroscopic check
2.2.1 Schuster & Nissen (1989)
A second check can be done using spectroscopic metallicities from the literature. We have used mainly data from Edvardsson et al. (1993), Favata et al (1997), Fulbright (2000), Feltzing & Gustafsson (1998), plus some additional objects from the catalogue of metallicities by Cayrel de Strobel, Soubiran & Ralite (2001) for red (B-V0.65) objects. Fig. 2 shows the difference between photometric (SN) and spectroscopic metallicities, for 4 metallicity intervals. Around solar metallicities, the colour variation is similar to the one detected on the Hyades. It confirms that the calibration of SN underestimates metallicities above [Fe/H]-0.25 by 0.1-0.2 dex for stars bluer than B-V0.65, and by 0.1-0.3 dex in the colour interval 0.75B-V0.9. At -0.25[Fe/H]-1.0, the combination of the 2 distinct calibrations is apparent, with the calibration for 0.375 overestimating the metallicity, and the calibration at 0.375 underestimating metallicities. Finally, the calibration seems to overestimate slightly the metallicity at [Fe/H]-1.0.
Because the calibration of SN has been applied mostly to F stars, the discrepancy of about 0.1 dex that is visible at B-V0.65 and for [Fe/H]-1.0 has already been noted by different authors, see in particular Alonso et al. (1996). In our own sample, it has been corrected as [Fe/H]=[Fe/H]SN/0.86+0.05 (Haywood , 2001).
2.2.2 Grenon (1978)
In Haywood (2001), we checked the calibration of Grenon (1978) with spectroscopic determinations. Fig. 3 shows the result of this calibration compared to the same data as for the calibration of SN, within colour limits that define the calibration, that is 0.400.65. The data is very sparse for red metal poor dwarfs, and not much can be said about the calibration below [Fe/H]-0.25 dex. At [Fe/H]-0.2, the spectroscopic data shows no offset. It it clear however that a secure calibration would require a larger data set.
The consistency of the Geneva metallicity scale can also be checked on the HR diagram. The Hyades cluster was already used in Haywood (2001). We further detail our comparison with the cleaner Hyades sequence of de Bruijne et al (2001). Fig. 4 shows our sample with the Hyades sequence.

We note 2 features :
-
1.
There are no stars above the Hyades sequence around =0.9 in metallicity. A corresponding feature is visible in the HR diagram, Fig. 4b. Only three stars stand clearly above the Hyades sequence between 0.820.93, consistently in both diagrams.
-
2.
There are no field stars in the HR diagram at B-V0.87 and M 7.2. Such dwarfs would be expected to have [Fe/H]-0.5, and we note a corresponding lack of stars in Fig. 1a (one star only). It is appropriate to remind that this feature is visible on many studies of the solar neighbourhood metallicity distribution (even with pre-Hipparcos parallaxes). The first study to mention this effect was Favata et al. (1997) (see also Flynn & Morell (1997), their Fig. 5). The samples considered in solar neighbourhood studies are too small to investigate whether this is only a statistical effect or a real absence of midly-deficient stars at that colour.
In the HR diagram at 0.7, field stars above the Hyades sequence probably have evolved off the ZAMS (the turn-off colour for solar metallicity stars at 12 Gyrs is circa 0.70). At the bottom of the HR diagram (B-V 0.95), 4 stars with [Fe/H]0.14 lie clearly below the Hyades sequence, which may be the signature of a bias overestimating metallicities in the Grenon calibration at B-V 0.95. Among these 4 stars, only HIP 116745 has a measured spectroscopic metallicity at [Fe/H]=-0.22 in the catalogue of metallicities of Cayrel de Strobel et al. (2001).
We conclude that there is no significant deviation between the HR diagram and the colour-metallicity distribution of Fig. 1a.
3 The Strömgren metallicity scale
The calibration designed by Schuster & Nissen (1989) has proved to be most useful for a variety of studies using Strömgren photometry, and this has become still more evident with the advent of Hipparcos data. Results of Sec. 2 shows however that its application to available data is problematic for metal rich stars. We now try to explain the probable cause of that problem.
3.1 A diagnostic
Contrary to the claim of Twarog et al. (2002), the Strömgren metallicities at 0.220.40-0.41 (or 0.35B-V0.65) are also affected, with the Hyades having their abundance underestimated by 0.1-0.2 dex. Such strong effect is somewhat puzzling since the F-star calibration of SN is said to be constrained using the standard (Hyades) sequence of Crawford (1975) at a metallicity of 0.13 dex (and it is given double weight in the calibration of SN). This failure is interesting because it gives us some clue on the possible general origin of the problem. Since the photometric Hyades metallicity adopted by SN should be consistent with the spectroscopic value at [Fe/H] 0.13, the only possible cause for the defect that is seen on Fig. 1 must come from the Strömgren indices that are used to represent the Hyades sequence.
-
1.
F stars 0.220.375
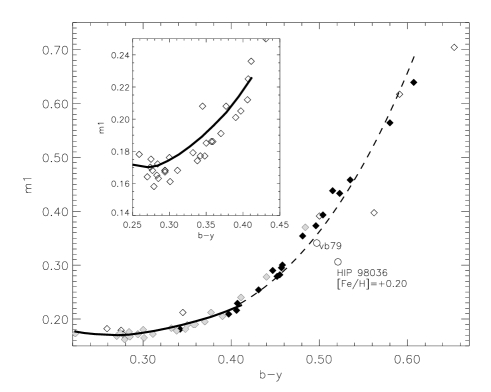
Fig. 5 shows the sequence for the Hyades, on the relevant colour range, from two different sources. The continuous line is the standard sequence from Crawford (1975) used by SN to calibrate their metallicities. Diamond symbols are Hyades members with Strömgren photometry from the GCPD (The General Catalogue of Photometric Data, Mermilliod, Mermilliod, & Hauck, 1997). The and indices of Fig. 5 are the mean of measurements from different sources as given by the GCPD. Most of these points include one or several measurements by Olsen (1993) and/or Olsen (1994ab). These various origins have been differentiated on Fig. 5 as follows : Black diamonds are those stars for which indices contain only measurement from Olsen (1993) and/or Olsen (1994ab). Grey diamonds are a mixed of Olsen (1993 and/or 1994ab) and measurements from other sources. Finally, empty diamonds represent those stars which were not observed by Olsen (1993 and 1994ab). Since the Hyades sequence is mostly dominated by the measurements of Olsen, we call it the ‘Olsen sequence’ herebelow. In the range of interest (0.375), the two scales (Crawford (1975) and the Olsen sequence) clearly show an offset of about 0.01 mag. For F-type stars, is the index sensitive to the metallicity, with =0.01 mag corresponding to [Fe/H]0.1dex on the metallicity scale.Since the huge database established by Olsen is the main source for Strömgren photometry, and since the calibration of SN is based on the sequence of Crawford (1975), it is expected that metallicity estimates that combine both will be incorrect by about 0.1 dex, even though the calibration of SN is correct and Olsen indices are precise.
-
2.
G stars 0.3750.59
The continuity in the deviations of metallicity estimates on Fig. 1b accross the limit that separate the 2 calibrations suggest a similar origin for the defects at , and . It is seen on Fig. 1b that the photometric metallicity offset of 0.1 dex is continuous accross the two intervals, i.e it is left unaffected by the change of calibration, at least up to =0.40. This comes in support to the fact that the discrepancy originates in the indices rather than in the calibration themselves.
At 0.3750.59, and for the metal rich part of their calibration, SN have used the 2 reddest points in the sequence of Crawford (1975) (at =0.394 and 0.412), and ‘to give more weight to the Hyades, four individual stars with an average [Fe/H]=+0.09 from Cayrel de Strobel et al. (1985) and from Cayrel et al. (1985) were included with single weight’. We could find only one star from the Hyades satisfying this description and that had Strömgren indices measurement available in 1989. This star (vb79), sufficiently red to have been useful for calibrating the reddest part of the metallicity scale, has =0.497 and =0.341 (Carney, 1983). Another star from the catalogue of Cayrel de Strobel et al. (1985), not belonging to the Hyades cluster, but with [Fe/H]spectro=0.25 is also shown on Fig. 5.
On Fig. 5, we have extrapolated the standard sequence of Crawford (1975) at 0.41 with a polynomial. The calibration given by SN is not explicitly referenced to the Hyades sequence, but the standard sequence is implicitly integrated in their functional form. Although we can’t quantify the difference between the Olsen sequence and the one de facto adopted by SN, we suggest that the lack of data and the functional form of the calibration of SN has probably led to a sequence resembling the one proposed as an extrapolation on Fig. 5. Several features support this suggestion :
First, it is significant that the Crawford and extrapolated sequence on Fig. 5 crosses the Olsen sequence between 0.40 0.45 (0.650.74). It implies that on this interval, both indices from Olsen or the extrapolated sequence overlap, and will give similar metallicities. As a matter of fact, this is precisely the interval where the calibration of SN (using Olsen Strömgren indices), gives a metallicity for the Hyades nearest to the spectroscopic value.
Second, between 0.45 0.57, the offset between the polynomial sequence and the Olsen sequence reaches 0.03-0.05, which precisely is the offset that is necessary in order to level up the photometric Hyades metallicities to 0.14 dex, if Olsen indices are used in the calibration of SN.
Third, the polynomial sequence rises more steeply than the observed sequence, which flattens to reach a maximum in at 0.75. It is expected that the extrapolated polynomial sequence rejoins the observed (Olsen) sequence at some colour in the interval . That means that at this colour, the two sequences should again give the same metallicity. This is precisely what is observed on Fig. 1 at (i.e the calibration of SN and Olsen indices give [Fe/H]+0.14, which is the metallicity expected from the standard relation).
Altogether, these clues convey the impression that it is the offset between the two sequences that is responsible for the strong colour dependence and the systematic discrepancy seen on Fig. 1. It is meaningful that the Crawford and extrapolated polynomial sequence of Fig. 5 lies respectively above and below than the Olsen sequence in just the correct intervals to explain the behavior of the photometric metallicity seen on Fig. 1b.
3.2 Consistency argument

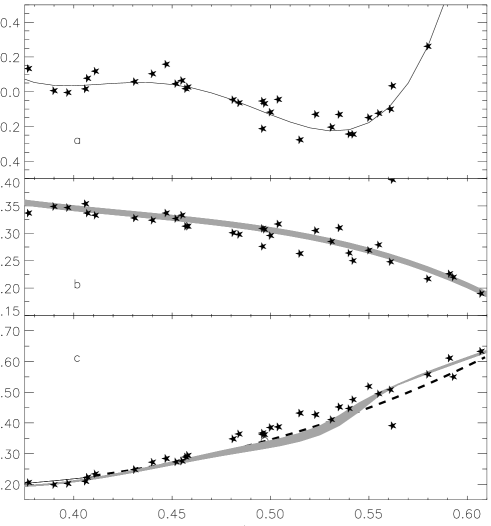
Following this last remark, it is possible to use the calibration given by SN to recover the Hyades sequence and check the consistency of our argument. Assuming relations between (, ) and (, ), can be calculated as the root of the equation :
| (1) |
The (,[Fe/H]SN), (,) relations for the Hyades have been assumed as polynomial fits to the Hyades data, as shown on Fig. 6ab. Because we don’t know the exact () sequence endorsed by SN at , we have assumed a set of () relations, as given on Fig. 6b.
They are used to calculated the coefficients of the polynomial (1), which is solved for , at different . The result is shown on Fig. 6c and is consistent with our discussion above.
3.3 Twarog et al. (2002)
In their paper, Twarog et al. (2002) proposed another cause for the discrepancy. They state that the calibration of SN underestimates the dependence of metallicity for stars redder than b-y=0.47. Their argument relies on their Fig. 5, which shows the correlation between metallicity (both spectroscopic and photometric) and for stars with b-y0.47. If the argument is correct, we would expect however that correlates differently for spectroscopic and photometric (SN) metallicities. Their Fig. 5 seems to illustrate, at variance with their claim, that the correlation is approximately similar for both spectroscopic and photometric abundances, which means that the photometric metallicities of SN are correctly tied to the index.
The interpretation that Twarog et al. give of their Fig. 5 is qualitative and relies on a dozen of stars. Among these, two objects that are outliers can give the favourable impression that the slopes of the photometric and spectroscopic [Fe/H]- data sets are different. Even if this was the case, it would remain to be demonstrated that this is due solely to the index.
In order to extend the comparison of Twarog et al. (2002) to a greater number of stars, we use our Geneva photometric metallicities instead of the spectroscopic metallicity scale. We select in our sample all stars having (equivalent to ), giving 37 objects (32 are within the limits of Fig. 7). We plot on Fig. 7 the photometric metallicities [Fe/H]SN and [Fe/H]GEN as a function of , a figure similar to Fig. 5 in Twarog et al. (2002), but now with the Geneva photometric scale being the reference. Of course, this comparison relies on the correctness of Geneva metallicities. Following the arguments developed in Sec. 2, we assume that they are indeed valid. Interestingly, it seems that our Fig. 7 reveals the patterns that were only suggested in the Fig. 5 of Twarog et al. (2002). That is, Geneva metallicities show that there is a second group of stars (upper box) standing 0.15-0.20 dex above the sequence at =0.25-0.30. Only a small part of that group is visible in Twarog et al. (2002), at =0.28-0.30.

What is interesting is that this group is not differentiated in the metallicities of SN. That means the calibration of SN lacks a dependence on one parameter, which clearly cannot be . The mean and dispersion of for the eight stars in the upper box are 0.445 and 0.036. The lower box contains 9 stars with a mean =0.408 and dispersion 0.030. We can estimate the corresponding difference in metallicity using Olsen (1984). The calibration of Olsen (1984) is valid for stars with , and the metallicity is proportional to with a coefficient equal to 5.1. Using this coefficient, the difference in of our two groups corresponds to 0.19 dex in metallicity, similar to the difference given by the Geneva photometry.
If we restrict our comparison to stars in the lower box only and those at , it is true that the difference between the reference (Geneva) metallicities and SN metallicities are larger at . However, this could be only a statistical effect due to the lack of data at . In any case, the 4 stars at are a minority, and if we restrict our discussion to where the majority of the stars are (at ), the idea of a difference of slope between the two metallicity scales is meaningless. We conclude that Fig. 7 confirms our argument, with being the source of the problem in the calibration of SN.
3.4 A corrected SN calibration
Taking into account the above remarks, we give a modified version of the Schuster & Nissen
calibrations, based on newer calibrating metallicities. We keep the same functional
form as SN, but we redetermined the coefficients by a least square fitting procedure.
In order to find the best fitting coefficients, we use , a genetic algorithm developped
for optimization problems by P. Charbonneau (see Charbonneau, 1995), to which the reader should
refer for an extensive description of this technique. A ‘fitness’ function must be defined for PIKAIA to optimize
the fit between a set of spectroscopic metallicities and the photometric metallicities.
Our fitness function is a least square minimization :
where are the spectroscopic metallicities, and are the photometric metallicities,
which are function of the photometric indices and coefficients .
(a) :
We first run the optimization procedure on a set of spectroscopic metallicities comprising the data of Edvardsson et al. (1993), dwarfs in the sample of Fulbright (2001), and a few Hyades stars, to which we attribute a metallicity of [Fe/H]=+0.14. That amounts to 211 stars. As in SN, the Hyades stars have been attributed a weight of 2. The fit is valid over ,
| (2) |
and
(b) :
The fit was made with 103 spectroscopic metallicities and 13 Hyades stars at [Fe/H]=+0.14.
| (3) |
(c) :
The fit was made with 36 spectroscopic metallicities and 12 Hyades stars at [Fe/H]=+0.14.
| (4) |


Fig. 8 shows the photometric metallicities calculated for a set of spectroscopic standards.
3.5 A calibration with reference to the Hyades sequence
Due to its rather complicated form, the application of the calibration given above is somewhat tedious. Also, the non-explicit dependence on the Hyades sequence makes it difficult to understand the origin of problems such as the one presented here, afterwards. On the contrary, a calibration directly based on the Hyades sequence, such as the one proposed by Olsen (1984) for G and K dwarfs, has a simple form, and can be straighforwardly improved as the Hyades sequence gets better defined and as more spectroscopic metallicities become available. We used a Hyades sequence defined by the coefficients from Tab. 1. These coefficients were derived by fitting the ’Olsen’ sequence to the Hyades data presented on Fig. 5.
Using PIKAIA with the same fitness function and calibrating stars as in the previous section,
we derive new calibrations as a function of and .
We find the following relation valid for :
| (5) |
and then
| (6) |
for .
These calibrations are illustrated on Fig. 9.
| 0 | -0.109 | +1.09 |
| 1 | +10.03 | +1.85 |
| 2 | -123.43 | -56.76 |
| 3 | +786.09 | +390.12 |
| 4 | -2927.5 | -1747.9 |
| 5 | +6514.42 | +5031.2 |
| 6 | -8388.02 | -8424.2 |
| 7 | +5738.56 | +7347.46 |
| 8 | -1613.7 | -2570.77 |
4 Some consequences and conclusion
Using the new calibration, it is now possible to recalculate metallicities for the set of local dwarfs. The new (B-V, [Fe/H]) distribution is shown on Fig. 10. The result is now satisfactory, but the occasion is taken to emphasise the need for a larger number of spectroscopic metallicities for cool dwarfs.
In the last decade, the calibration of SN have been widely used in various studies, in particular to design metallicity distribution of long-lived dwarfs in the solar neighbourhood. In one such study, we sampled the solar neighbourhood within 20 pc (Haywood, 2001). The sample, before the selection of long-lived dwarfs, contained 177 stars for which metallicity came from Geneva photometry, and 172 stars for which metallicity was calculated from Strömgren metallicity, mostly for stars bluer than B-V=0.67. Strömgren photometry was also used for 41 stars redder than this limit, for which no Geneva photometry was available. All stars with SN metallicities were corrected as [Fe/H]SN/0.865+0.052. Only 20 stars with colour in the critical interval 0.81.0 were included in the sample. In view of the limited number of objects affected by the problem, it is unlikely that our metallicity distribution has suffered much from this effect. We conclude that the trend seen on Fig. 1a between metallicity and colour is obviously real.
As a last check on our metallicities, we have searched for spectroscopic iron abundances for the stars in Fig. 1a in the catalogue of Cayrel et al. (2001). Fig. 11 shows both the photometric and spectroscopic values B-V colour and there is good general agreement between the two. The spectroscopic metallicities, although still very sparse, confirm the general shape of the B-V-[Fe/H] distribution, and we conclude that our findings of Haywood (2001) are robust.

Acknowledgments
This research has made use of the SIMBAD database, operated at CDS, Strasbourg, France, and of The General Catalogue of Photometric Data, University of Lausanne, Switzerland. We thank the referee and Frederic Arenou for their suggestions and comments.
References
- [Alonso et al., 1996] Alonso A., Arribas S., Martinez-Roger C., 1996, A&AS, 117, 227
- [Carney B.W., 1983, Astron. J. 88, 610] Carney B.W., 1983, AJ, 88,610
- [Cayrel de Strobel, G. and Bentolila, C. and Hauck, B. and Duquennoy, A., 1985, A&AS, 59, 145] Cayrel de Strobel, G. and Bentolila, C. and Hauck, B. and Duquennoy, A., 1985, A&AS, 59, 145
- [Cayrel, R. and Cayrel de Strobel, G. and Campbell, B., 1985, A&A, 146, 249] Cayrel, R. and Cayrel de Strobel, G. and Campbell, B., 1985, A&A, 146, 249
- [Cayrel De Strobel et al., 2001] Cayrel De Strobel G., Soubiran C., Ralite N., 2001, A&A, 373, 159
- [Charbonneau, P., 1995, ApJS 101, 309] Charbonneau, P, ApJS, 101, 309
- [Crawford, 1975,AJ, 80, 955] Crawford, D. L., AJ, 80, 955
- [de Bruijne, J. H. J. and Hoogerwerf, R. and de Zeeuw, P. T., 2001, A&A, 367, 111] de Bruijne, J. H. J. and Hoogerwerf, R. and de Zeeuw, P. T., 2001, A&A, 367, 111
- [Edvardsson et al., 1993] Edvardsson B., Andersen J., Gustafsson B., Lambert D. L., Nissen P. E., Tomkin J., 1993, A&A, 275, 101
- [Favata et al., 1997] Favata F., Micela G., Sciortino S., 1997, A&A, 323, 809
- [Feltzing & Gustafsson, 1998] Feltzing S., Gustafsson B., 1998, A&AS, 129, 237
- [Flynn & Morell, 1997, Mon. Not. R. Astron. Soc., 286, 617] Flynn C., Morell O., 1997, MNRAS, 286, 617
- [Fulbright, J. P., 2000, AJ, 120, 1841] Fulbright, J. P., 2000, AJ, 120, 1841
- [Grenon, 1978] Grenon M., 1978, Publications de l’Observatoire de Genève, 1
- [Haywood, M., 2001] Haywood, M., 2001, MNRAS, 325, 1365
- [Mermilliod et al., 1997] Mermilliod J. ., Mermilliod M., Hauck B., 1997, A&AS, 124, 349
- [Olsen, 1984] Olsen E. H., 1984, A&AS, 57, 443
- [Olsen, E. H., 1993, AAS, 102,89] Olsen, E. H., 1993, A&AS, 102,89
- [Olsen, E. H., 1994, AAS, 104, 429] Olsen, E. H., 1994a, A&AS, 104, 429
- [Olsen, E. H., 1994, AAS, 106, 257] Olsen, E. H., 1994b, A&AS, 106, 257
- [Perryman et al., 1998] Perryman M. A. C. et al., 1998, A&A, 331, 81
- [Reid,I. N.,2002,PASP,114,306] Reid, I. N., 2002, PASP, 114, 306
- [Schuster & Nissen, 1989] Schuster W. J., Nissen P. E., 1989, A&A, 221, 65
- [Twarog, B. A., Anthony-Twarog, B. J., Tanner, D., 2002, astro-ph 0203062] Twarog, B. A. and Anthony-Twarog, B. J. and Tanner, D., 2002, astro-ph 0203062