Soft X-ray emission lines in the afterglow spectrum of GRB 011211:- a detailed XMM-Newton analysis
We report on an XMM-Newton observation of the X-ray afterglow of the Gamma Ray Burst GRB 011211, originally detected by Beppo-SAX on 11th December 2001. The early afterglow spectrum obtained by XMM-Newton, observed 11 hours after the initial burst, appeared to reveal decaying H-like K emission lines of Mg, Si, S, Ar and Ca, arising in enriched material with an outflow velocity of order 0.1c (Reeves et al. 2002). This was attributed to matter ejected from a massive stellar progenitor occurring shortly before the burst itself. Here, we present a detailed re-analysis of the XMM-Newton EPIC observations of GRB 011211. In particular, we show that the detection of the soft X-ray line emission appears robust, regardless of detector background, calibration, spectral binning, or the spectral model that is assumed. We demonstrate that thermal emission, from an optically thin plasma, is the most plausible model that can account for the soft X-ray emission, which appears to be the case for at least two burst afterglow spectra observed by XMM-Newton. The X-ray spectrum of GRB 011211 evolves with time over the first 12 ksec of the XMM-Newton observation, the observations suggest that thermal emission dominates the early afterglow spectrum, whilst a power-law component dominates the latter stages. Finally we estimate the mass of the ejected material in GRB 011211 to be of the order 4-20 solar masses.
Key Words.:
Gamma rays: bursts – supernovae: general – X-rays: general1 Introduction
The study of X-ray afterglow emission is crucial to understanding the nature of gamma ray bursts and their progenitors, as X-ray spectroscopy can reveal details of the environment of the burst explosion. For instance, observations of some X-ray afterglows with Beppo-SAX, ASCA, and Chandra have revealed strong iron K emission lines (e.g. GRB 000214, Antonelli et al. 2000; GRB 991216, Piro et al. 2000; GRB 970828, Yoshida et al. 1999; GRB 970508, Piro et al. 1998), with line equivalent widths of up to several keV; typically the lines are detected at confidence. An iron K-shell absorption feature was also reported in the prompt Beppo-SAX spectrum of one burst, GRB 990705 (Amati et al. 2000, Lazzati et al. 2001). The line observations appear to support models where the burst explodes into an enriched, high density medium, favoring a massive stellar progenitor for long duration bursts. In many cases (e.g. Piro et al. 2000, Antonelli et al. 2000), large masses of iron are required to account for the line emission. One possible source of the iron is in a shell of distant (R cm) material ejected from a supernova (the ‘supranova’ model, Vietri & Stella 1998) which would have to occur at least several months prior to the burst event, in order to allow sufficient time for large quantities of iron to form (e.g. Vietri & Stella 1998). Alternatively, the iron K emission could arise through the interaction of a magnetically driven wind with the envelope of the massive progenitor star (Rees & Meszaros 2000); here the distances involved are much smaller (R cm) and consequently the high masses of iron and long time delays between supernova and burst are not required.
The high throughput of XMM-Newton, compared with Beppo-SAX or Chandra, makes it the best available telescope with which to constrain X-ray line emission in GRBs, potentially providing a powerful diagnostic for discriminating between models of the burst progenitor. In an analysis of the XMM-Newton observation of the afterglow of gamma ray burst GRB 011211, Reeves et al. (2002) reported the first detection of emission lines other than iron in a GRB afterglow spectrum; specifically the decaying line emission from the hydrogenic states of Mg, Si, S, Ar and Ca. Furthermore the energies of the X-ray lines appeared to be offset from the known redshift for the host galaxy of GRB 011211 (, Holland et al. 2002), implying the line emitting matter was outflowing with a velocity of 0.1c from the site of the GRB progenitor. This result was interpreted as possible evidence of a supernova explosion occurring within days of the burst itself, with the X-ray line emission arising from matter in the expanding supernova shell.
Recently, Borozdin & Trudolyubov (2002) have claimed that the detection of soft X-ray emission lines from light metals in GRB 011211 may not be robust, as the observations could be contaminated by the background of the XMM-Newton EPIC-pn detector. In addition, Rutledge & Sako (2002) perform simulations which suggest that the significance of the emission features may be lower, at the level (at best) of confidence. In this paper, we describe our analysis of the XMM-Newton data on GRB 011211 in detail. We confirm that the soft X-ray emission features in GRB 011211 are robust, the set of lines being detected to a good level of confidence (at % significance in all our tests). Both the F-test and Monte-Carlo simulations are used to determine the statistical significance of the line emission features, making no prior assumption about the rest energies or redshift of the line emitting material. We also demonstrate that the results do not depend on the background subtraction of the EPIC-pn detector, instrument calibration, or the spectral binning used and show that the result is independent of the spectral model that is assumed. In section 2 we review the properties of the burst, the XMM-Newton observations and basic data analysis and in section 3 detail the spectral analysis of the afterglow during the first 5 ksec when the lines appear most prominent. The time dependent spectral properties of GRB 011211 are also outlined, whilst a likely mechanism of the line emission is discussed and a mass for the ejected material in GRB 011211 is derived. Throughout this paper we adopt a cosmology of km s-1 Mpc-1 and . Unless otherwise stated, all errors are quoted at 68% confidence (i.e. or 2.3 for 1 or 2 interesting parameters respectively).
2 XMM-Newton Observations of GRB 011211
The Gamma Ray Burst GRB 011211 was first detected on December 11th 2001 at 19:09:21 (UT), by Beppo-SAX (Frontera et al. 2001). The burst duration was 270s, making GRB 011211 the longest burst yet observed by Beppo-SAX, with a peak flux (40-700 keV) of erg cm-2 s-1. Spectroscopy of the transient optical afterglow revealed several absorption lines at a redshift of (Holland et al. 2002). Optical imaging (Burud et al. 2001, Fox 2002) has also linked the optical transient to extended emission, the probable host galaxy of magnitude . Assuming the absorption system arises from the host galaxy of the GRB, then the total equivalent isotropic luminosity for GRB 011211 is erg.
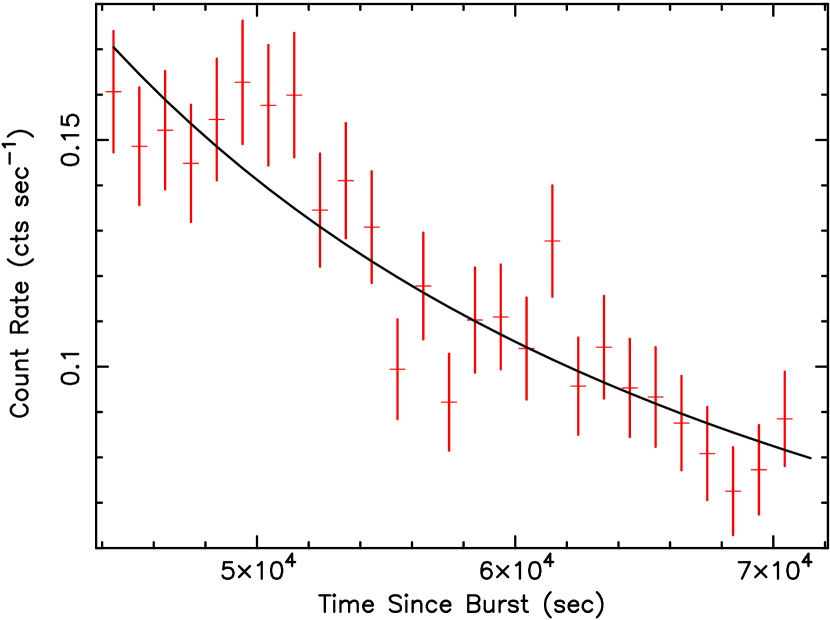
The XMM-Newton (Jansen et al. 2001) observations of GRB 011211 started at 06:16:56 (UT) on December 12th 2001, hours after the initial burst (Santos-Lleo et al. 2001). Data from EPIC (European Photon Imaging Cameras) have been analysed, using both the MOS CCDs (Turner et al. 2001) with the medium filter and pn CCDs (Struder et al. 2002) using the thin filter. The total observation duration (for EPIC-pn) was 27 ksec. Approximately 4.2 ksec into the observation, the spacecraft pointing was moved from its original position at co-ordinates (2000) 11h 15′ 16.4′′, –21∘55′ 44.8′′, to new boresight co-ordinates at 11h 15′ 18.0′′, –21∘56′ 53.0′′, in order to place the source away from the EPIC-pn chip gaps. The time-averaged 0.2–10 keV flux was erg cm-2 s-1 (corresponding to an 0.6–30 keV, rest frame afterglow luminosity of erg s-1), decreasing during the observation according to a power-law, with decay rate , (Fig. 1). The X-ray decay is notably steeper than reported for the same period in the optical (, Holland et al. 2002).
2.1 Extraction of the XMM-Newton data
We initially concentrate our analysis on the first 5 ksec of observation, where the prominent soft X-ray emission lines are observed. The analysis focuses on the EPIC-pn spectrum, which due to the use of the thin filter, has a much higher count rate () than the EPIC-MOS, having first checked that the MOS and pn data are self-consistent. All data reduction was performed using the XMM-SAS (v5.3).
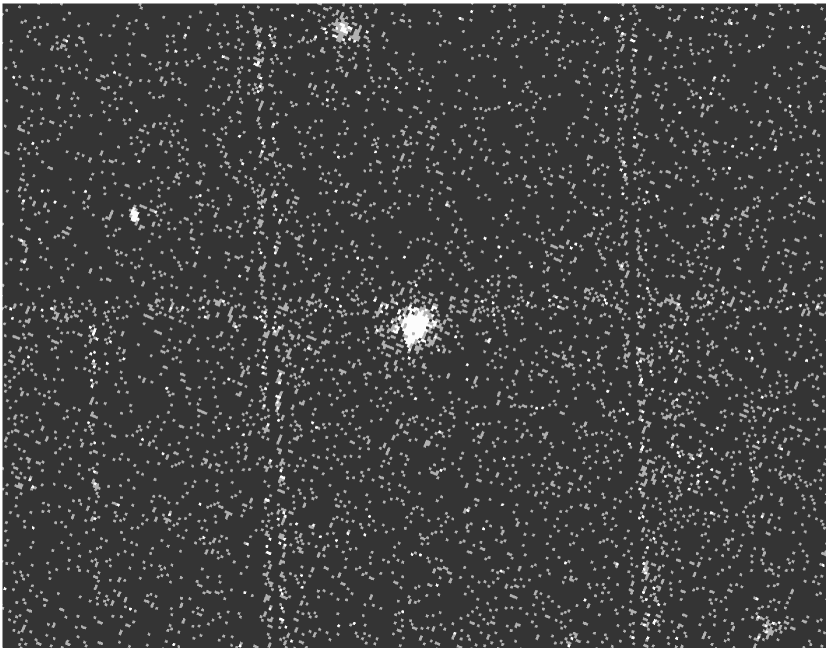
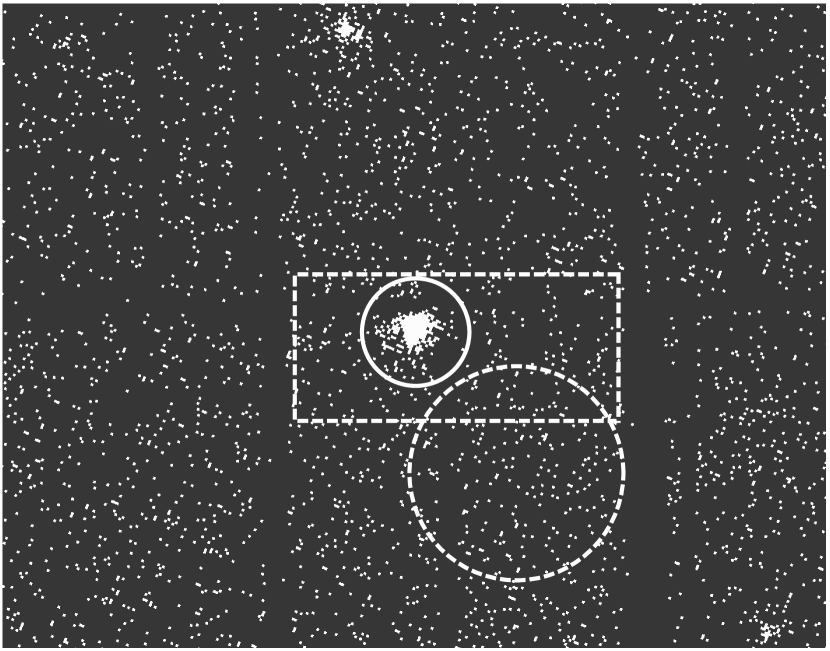
Fig. 2(a) shows the unscreened EPIC-pn field around GRB 011211, the afterglow itself being the bright source located close to the edge of the EPIC-pn chip gap, but near to the centre of the image. The background count rate is clearly higher around the edges of the pn chip in the unscreened dataset, as noted by Borozdin & Trudolyubov (2002), who claim that inclusion of the noisy pixels in the background spectrum could effect the detection of soft X-ray lines. However in order to produce a clean image and event list for GRB 011211, the dataset was screened to include only good X-ray events (using the selection expression ‘FLAG=0’, in the SAS tool evselect) using only the well-calibrated single or double pixel events (i.e. PATTERN=4). An energy cut was also applied, excluding all data below 200 eV and above 10 keV. The resulting image is shown in Fig. 2(b), which shows a smooth distribution of background counts, regardless of position on the EPIC-pn chips.
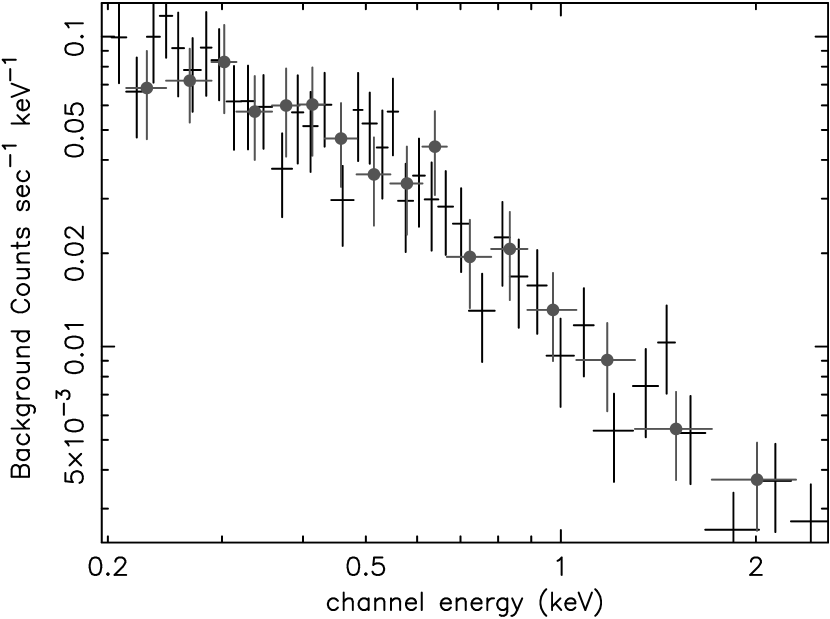
Source spectra for GRB 011211 were subsequently extracted from a circular region of 40′′ radius, centred on the source, accounting for the decrease in flux incurred through photons falling onto the chip gaps. A background spectrum was taken from a circular region of radius 80′′, using a source-free region located close to the source (Fig. 2b). The background spectrum obtained is shown in Fig. 3; after applying the above screening the background spectrum is smooth, unlike the background spectrum obtained by Borozdin & Trudolyubov (2002), who using unscreened data obtain a ‘spike’ in their background spectrum near 0.7 keV. However, in order to ascertain whether the choice of background region can affect the spectrum of GRB 011211, we also use a background extracted from a box-shaped area located close to the EPIC-pn chip gap (Fig. 2b), but excluding the source region. The background spectra obtained for both regions are identical (Fig. 3), hence the choice of background region does not effect the background subtracted source spectrum of GRB 011211. When normalized to the size of the source extraction region, the background contributes of the net source count rate.
3 Spectral Analysis
The background subtracted source spectrum of GRB 011211, from the first 5 ksec of the observation, was fitted in xspec v11.1, using a minimum of 12 source counts per bin. An absorbing column of cm-2, due to our own galaxy, was included in all the spectral fits. A simple power-law fit (model 1) gives a barely (10% null hypothesis probability) acceptable fit to the data (, where d.o.f is the number of degree of freedom), with a power-law photon index of . The model fits to GRB 011211 are summarized in Table 1.

3.1 Soft X-ray Emission Line Fits to GRB 011211
Inspection of the power-law fit to the spectrum of GRB 011211 shows a clear excess present in the data residuals between 0.5 and 1.5 keV (Fig. 4). The deviations are considerably larger than the current calibration uncertainty of the EPIC-pn detector, which is of the order ; adding a further systematic error of 5% to the data has no noticeable effect on the spectral fits. Hence, following the procedure of Reeves et al. (2002), we attempt to fit this excess with a set of emission lines. Initially 3 narrow spectral lines were added (model 2), allowing the energy and flux of each line to vary, whilst the line widths were kept negligibly small (at eV) in the fits, as the lines are unresolved compared to the detector resolution. The best fit (observed frame) energies of the lines were then keV, keV and keV, with line fluxes of photons cm-2 s-1, photons cm-2 s-1 and photons cm-2 s-1 respectively. The fit is significantly improved, at 99.7% confidence, upon the addition of these lines (, for 6 extra degrees of freedom), when an F-test is employed (Bevington 1992). Note that even when fitted individually, the lines are detected at 98%, 97% and 93% confidence (for Si, S and Ar respectively), with the addition of 2 extra degrees of freedom (energy, flux) for each line.
| Model | or kT | a | Probb |
|---|---|---|---|
| 1. PL Only | 54.2/45 | ||
| 2. PL + 3 lines | 33.7/39 | 99.7% | |
| 3. PL + 5 lines | 29.0/35 | 99.3% | |
| 4. PL + z-lines | 34.3/39 | 99.5% | |
| 5. PL + VMEKAL | 38.1/41 | 99.8% | |
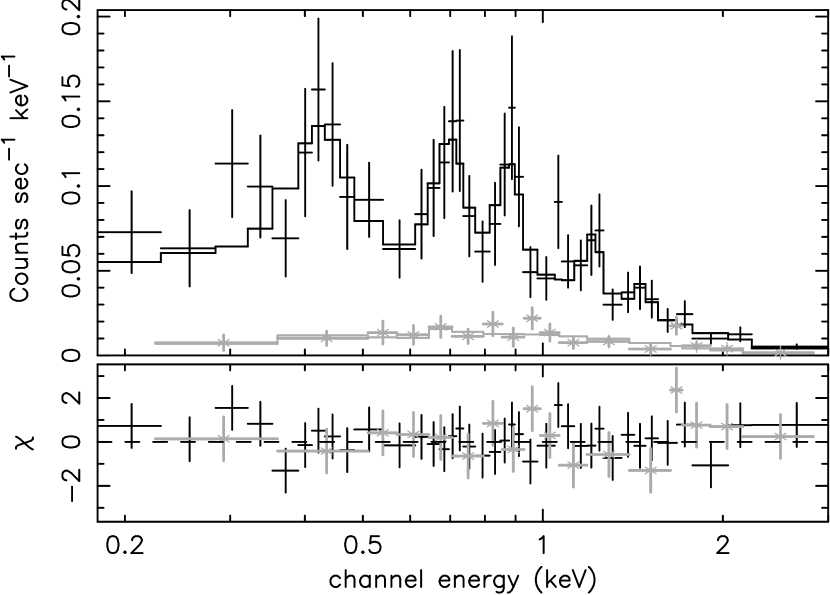
Examination of the data/model residuals in Fig. 4 suggests that two further lines can be added to the spectrum (model 3), with observed energies keV, keV and fluxes photons cm-2 s-1 and photons cm-2 s-1 respectively, although the improvement in fit statistic is marginal for these last two cases (). Table 2 lists the properties of each of the individual lines added to the X-ray spectra. Fig. 5 shows the EPIC-pn and EPIC-MOS data fitted with the 5 emission lines. Unfortunately none of the lines are significantly detected in the MOS CCDs, due to the lower count rate, although the data for both detectors are consistent (e.g. see the residuals in the lower panel).
| Ident | a | Eobsb | Erestc | redshiftd | Fluxe |
|---|---|---|---|---|---|
| Mg xi | 1.35 | ||||
| Si xiv | 1.99 | ||||
| S xvi | 2.60 | ||||
| Ar xviii | 3.30 | ||||
| Ca xx | 4.07 |
When converted to the rest frame of the burst (at z=2.14), the energies of all 5 possible lines are keV, keV, keV, keV and keV. Interestingly these lines all appear to be offset from the known energies of the strong K-shell lines of Mg xi (1.35 keV), Si xiv (1.99 keV), S xvi (2.60 keV), Ar xviii (3.30 keV) and Ca xx (4.07 keV). With the exception of Mg xi (the most tentative detection), these lines appear to correspond to the Lyman- transitions of the most abundant elements, and are the strongest emission lines one would expect to observe at these X-ray energies for either a collisionally ionised plasma (of temperature a few keV) or a highly photoionised plasma.
Having established the likely identity of the soft X-ray line features in GRB 011211, we then calculated the observed redshift, and thus the outflow velocity of the line emitting material. Fitting the redshift of the lines individually, one finds values of (Mg xi), (Si xiv), (S xvi), (Ar xviii) and (Ca xx). Thus with the exception of Mg xi (which at the detector resolution is unresolved from Mg xii and also L-shell emission from Fe or Ni) the lines all appear to be significantly offset from the known redshift for GRB 011211 of , corresponding to an outflow velocity of . In order to test the significance of this, we fixed the lines at these known rest-frame energies, but allowed a single redshift (between and , in steps ) for the entire line set to vary (model 4). The redshift calculated for the line set is , corresponding to an outflow velocity of or km s-1 from the GRB progenitor. Overall, the fit statistic improves to . When compared to the power-law fit (for 6 extra degrees of freedom), the addition of the redshifted line set is significant at 99.5% confidence from an F-test.

3.2 Thermal Emission and Ionised Reflection models
Finally, we attempted to fit the data with emission from a collisionally ionised optically thin plasma, with variable elemental abundances (hereafter the ‘thermal’ emission model), using the vmekal code within xspec (Mewe et al. 1985). Initially, a thermal emission component of temperature keV was added in addition to an underlying power-law component (model 5). The improvement in fit obtained () is significant when compared to the pure power-law fit (model 1); the thermal emission component is required at 99.8% confidence from an F-test, for four extra degrees of freedom (temperature, abundance, redshift and luminosity). Note that the spectrum during the initial 5 ksec can be equally well fitted with pure thermal emission (i.e. the power-law component is not statistically required) the fit statistic is then . The rest-frame model spectrum using the vmekal component is shown in Fig. 6. It can be seen that for these elements, the hydrogenic states dominate (e.g. Si xiv at 2.0 keV), although there is also some contribution from the He-like species as well (e.g. S xv, Ar xvii, Ca xix).
We also used this model to provide an independent determination of the redshift of the line emitting material, where no assumption has been made about the likely identity of the lines; the best-fit redshift was , in excellent agreement with the simple line fit derived above. A contour plot showing the 68%, 90%, 95% and 99% confidence levels for the line emitting material is shown in Fig. 7, a redshift of can be ruled out at confidence. Rutledge & Sako (2002) suggest that emission at z=1.2 and z=2.75 are also plausible solutions to the data, clearly these are ruled out from our fits, although there is a local minimum at (which can be excluded at confidence). Nonetheless, we consider both the lower redshift of and the high redshift value of to be physically implausible, as this would require either an extreme blueshift or for the GRB to reside at a higher redshift than the measured value (from the optical spectrum) of .
The relative abundance of the light metals (Mg, Si, S, Ar, Ca) was found to be the solar value, with a 90% lower-limit of solar. Interestingly, unlike the other elements, an over abundance of iron is not required, the 90% upper limit for the iron abundance was found to be solar, consistent with the lack of detection (EW eV, rest frame) of a strong iron K-shell line in the data.

We also attempted to fit the spectrum with a reflection model (Ballantyne & Ramirez-Ruiz 2001), where the X-rays scatter off the walls of a funnel excavated in the envelope of a stellar progenitor (the so-called “nearby reprocessor” model, Rees & Meszaros 2000). Firstly, we tried a pure reflection component (i.e. just the scattered X-ray emission). Allowing the ionisation state of the reflecting material to vary results in an ionisation parameter log (with ) and a fit statistic of . In this fit, the spectrum resembles a simple power-law, as all the elements are fully ionised, and the reflector is a perfect mirror. If one forces the ionisation parameter to be log , then the fit statistic is worse (), whilst the incident power-law becomes steep (). The poor-fit results from the strong iron line or edge present in the model, and from the shape of the continuum, which is concave in the reflection model (but is convex in the actual data). Allowing a direct power-law component in addition to the reflector does not improve the fit further. Hence it is difficult to reconcile the current reflection models with the spectrum of GRB 011211, although we note that at present, this model does not include emission from S, Ar or Ca.
3.3 Monte-Carlo Simulations
We have used Monte-Carlo techniques to provide an independent estimate of the significance of the line emission fits to GRB 011211. This is important given the low photon number statistics of the data, where the distribution of counts may become non-Gaussian (Protassov et al. 2002).
In order to test the significance of the line emission, 10000 random spectra from the EPIC-pn detector were generated, using a simple power-law emission model (including absorption from our own Galaxy), with a photon index of . An exposure time of 5 ksec (accounting for detector deadtime) and an X-ray flux identical to that of GRB 011211 ( erg cm-2 s-1) were used, as well as a background level % of the source count rate, so that the signal to noise of the simulated spectra were comparable to the actual source spectrum for GRB 011211. The simulated spectra were rebinned to obtain a minimum of 12 source counts in each spectral channel.
We proceeded to fit the simulated data, using (i) a pure power-law continuum and (ii) a model consisting of a power-law plus three emission lines, corresponding to the strongest lines (Si, S, Ar) observed in the actual GRB 011211 spectrum. The difference in between the power-law and line emission models was noted for each simulated spectrum, in order to test whether the apparent line emission could be produced purely through random, Poisson noise. Intially, the line energies were fixed at the rest-frame values corresponding to the K transistions of Si xiv, S xvi and Ar xviii, but note that the redshift was allowed to vary between and (stepsize ) when fitting the trial spectra. Hence no prior assumption is made about the redshift of the line emitting material. In addition, the line flux for each line was allowed to vary in the fits. Upon fitting the simulations we found that only 5 in 10000 of the randomly generated power-law spectra could yield a similar decrease in chi-squared (), when compared to the real data, after the addition of the three emission lines. The likelihood (or null hypothesis probability) that the lines could arise purely from Poisson noise in this test is ; hence the simulations indicate that the soft X-ray line emission is detected at confidence, in agreement with the results obtained through the F-test.
In a recent paper, Rutledge & Sako (2002) note that the prior identification of the three strongest emission line features with Si xiv, S xvi and Ar xviii represents an a posteriori assumption about the data, when trying to estimate the significance of the line features. However we note (and see Fig. 6) that line emission features from these 3 abundant H-like species will dominate the emission from a hot (several keV) collisionally ionised plasma, or a highly photoionised plasma, over the 1-4 keV (rest frame) energy range. Nonetheless we relax the assumption that the lines originate from these species, and test the improvement in fit obtained when adding lines, at any energy from 0.2-10 keV in the observed spectrum, to the 10000 fake power-law spectra (i.e. a blind spectral search). Initially we just add one line to the fake spectra (whilst varying both the energy and flux of the line), and find that an improvement of , equivalent to the addition of the Si xiv line in the real dataset, is obtained in only 6 out of 1000 cases. Thus the Si xiv line is detected at 99.4% confidence. Similarly we find that the S xvi and Ar xviii lines are detected at 98.8% and 96% confidence respectively, in agreement with the values computed by the F-test. We also consider the significance of the 3 line set as a whole, by fitting 3 Gaussian lines (again at arbitary energies) to the simulated datasets. The results (see Fig. 8a) show that only 3 in 10000 trial spectra gave an equivalent (or better) improvement in the statistic compared to the real data (where for the addition of all 3 lines). Thus we can conclude that the addition of 3 Gaussian lines in the soft X-ray spectrum of GRB 011211 is significant at % confidence, whilst the individual lines are detected at 99.4%, 98.6% and 96% confidence (for Si, S and Ar) respectively.

A more physically realistic model, consisting of emission from a hot, thermal plasma (i.e. the vmekal model), was also fitted to the 10000 randomly generated power-law spectra. The temperature, luminosity, redshift and relative abundance of the plasma were allowed to vary in the fits. Fig. 8 (panel b) shows a histogram of the change in obtained when comparing a power-law fit to a thermal fit for the simulated spectra; note here a positive change in corresponds to an improvement in fit statistic when comparing the vmekal model to a power-law. In the majority (90%) of cases, fitting a thermal model to the randomly generated power-law spectra results in a worse fit. However the real data for GRB 011211 indicate that an improvement in fit statistic of is obtained using the thermal model compared to the pure power-law. Indeed an equivalent improvement in is only found in 3 out of 10000 simulated spectra; hence the inclusion of the thermal line emission component is formally required at % confidence from the simulations.
3.4 Other Extraction Effects
We have also investigated whether varying the size of the source selection region has any effect on the derived spectrum and the detection of the soft X-ray lines. In order to test this, we extracted spectra from circular regions of radii 10′′, 20′′ 30′′ in addition to the previous spectrum that was extracted with a 40′′ radius. We find the detection of the redshifted soft X-ray line set is significant in each case; at 99% confidence (via an F-test) for spectra extracted with 20′′ and 30′′ radii, whilst the detection is less significant (at 98% confidence) for a 10′′ radius (as substantially fewer source counts are included in the spectrum). However, after accounting for the telescope point spread function, the derived line flux for the Si xiv line was found to be constant in each case (at photons cm-2 s-1), in contrast to the findings of Borozdin & Trudolyubov (2002) who claim the Si xiv line flux in their spectra decreases with the extraction radius.
The effect of spectral binning was also investigated. Rather than binning the spectrum to a set number of photons per bin, the spectra were re-binned so that each bin represented a constant energy interval, of 40 eV in size. This is then well matched to the resolution of EPIC-pn detector below 2 keV (where the FWHM spectral resolution is eV). Data above 2 keV were ignored due to poor photon statistics (less than 10 source counts per bin). The resultant spectrum is shown in Fig. 9. The spectrum has been fitted with the 5 redshifted lines obtained previously, the fit statistic again improves significantly (from to 33.4/32, i.e. at 99% confidence) upon the addition of the line set. Interestingly, a residual near 1.1 keV is present in the data, the addition of a sixth emission line, at keV, is significant at 98% confidence (). Assuming a redshift of , this line could correspond to He-like Ar (Ar xvii), which is predicted in the thermal model (Fig. 6). The net redshift obtained for the line set is then , consistent with the previous determination (section 3.1).

4 Temporal variability of the Line Emission in GRB 011211
The observations presented in Reeves et al. (2002) showed that the line emission in GRB 011211 decayed with time faster than the continuum, rendering the lines undetectable after 10 ks of observation. To investigate this further, we initially split the first 12 ksec of observations into 43 ksec segments. Although it is difficult to constrain the significance of the individual lines over such a short time period, nonetheless we compare the power-law model with the thermal (vmekal) model and the model consisting of a power-law plus redshifted emission lines. The results of the fits are shown in table 3.
| Model | 0-3 kseca | 3-6 kseca | 6-9 kseca | 9-12 kseca | |
|---|---|---|---|---|---|
| PL onlyb | |||||
| 51.5/28 | 23.9/16 | 26.8/24 | 18.7/26 | ||
| PL*wabsc | |||||
| d | |||||
| 39.1/27 | 12.1/15 | 23.6/23 | 16.9/26 | ||
| Thermale | |||||
| zg | |||||
| 31.9/26 | 14.0/14 | 20.6/22 | 14.1/24 | ||
| PL + z-linesh | – | – | |||
| zg | – | – | |||
| 21.9/22 | 11.4/10 | – | – |
It can be seen that the two spectra from the initial 6 ksec of observation are poorly fit by a simple power-law spectrum, whilst both the redshifted line and thermal emission models are a significantly better fit. What appears interesting is that the early afterglow spectrum is significantly curved. The spectrum during the first 3 ksec can be fit with a steep power-law (with ) and an observed frame column density of cm-2. This indicates that the early afterglow spectrum is dominated by an intrinsically curved (thermal) component. In contrast, acceptable fits to the last two spectra (between 6 and 12 ksec) can be obtained by a pure power-law model, neither the soft X-ray line emission, nor the addition of a thermal emission component being formally required in these spectra.
In order to quantify this, we have calculated the ratio of thermal to power-law emission during the first and last 10 ks of observation. During the first 10 ksec, the thermal component has an average luminosity of erg s-1, whilst the power-law component has a luminosity of erg s-1 (and note that both components are statistically required in the spectral fit at % confidence). In the last 10 ksec the power-law component has a luminosity erg s-1, whilst the thermal emission is no longer required ( erg s-1).
We have also parameterised the strength of the line emission by measuring the equivalent width (EW) of the Si xiv line, relative to a pure power-law continuum. During the first 5 ksec, the Si xiv line is detected with an (observed frame) EW of eV. A line is also marginally detected (at 90% confidence) from 5-10 ksec after the start of the observation, with a smaller EW of eV. Beyond 10 ks, the line is not detected, we can place a tight upper-limit of eV on the EW of the line from the last 17 ks of observation. Thus clearly the soft X-ray line emission in GRB 011211 decays with time, and is not detected after 10 ks from the start of the XMM-Newton observation.
5 Discussion and Conclusions
Both the F-test and Monte-Carlo simulations have showed that the soft X-ray line emission in GRB 011211 is detected at confidence, We conclude that the detection of the soft X-ray features in GRB 01211 is robust, and is not affected by the detector background, calibration, spectral binning or the particular spectral model that is assumed. It is also apparent that the lines decay rapidly, no line emission is formally detected after 10 ks from the start of the XMM-Newton observation.
The early afterglow data (during the first 10 ksec of observation) appears to be characterised by thermal X-ray emission (from optically thin gas), as evident by the curvature present in the in the early spectrum. An alternative spectral model, where the afterglow line emission results from X-ray reflection off optically thick material appears to be ruled out (e.g. Ballantyne & Ramirez-Ruiz 2001), although we note that in current reflection models, the emission from S, Ar and Ca is not computed. Future models will hopefully provide a better test of the reflection scenario.
On the assumption that the lines result from thermal emission one can estimate the mass of the ejected material. Firstly the emission measure () is computed from the observed luminosity of the thermal emission component. Here cm-3 (where n is the electron density in cm-3 and V is the volume), whilst the plasma will emit X-rays over a characteristic cooling time (governed by the electron density) of secs, for gas of temperature keV. Thus from the emission measure, the total integrated output of the thermal emission is governed by , where is the observed lifetime of the line emission. Substituting for the cooling time, and as (where M is the total mass of the emitting material and is the proton mass), then one can derive the total mass of the ejecta:-
g
or
The minimum lifetime of the line emission (measured from the start of the XMM-Newton observation) is secs, whilst the maximum lifetime occurs if the line emission starts at the time of the burst, which is then secs. Thus the minimum and maximum mass of the outflowing material, responsible for the blue-shifted line emission, are then 4 and 20 solar masses respectively. This indicates that the mass of the stellar progenitor is likely to be even for the conservative case where the mass of the ejecta is (e.g. Woosley & Weaver 1995).
The duration of the line features in GRB 011211, observed 11 hours after the initial burst, implies a distance of several cm for the line emitting matter (Reeves et al. 2002). When combined with the velocity of the material (), this implies that the matter was ejected from days to weeks before the burst itself occurred. This time delay appears too short in the context of the “supranova” model (Vietri & Stella 1998), where a time-delay of several months to years can be predicted, whilst the “hypernova” class of models (Woosley 1993) involve the near-simultaneous occurrence of a supernova and the gamma ray burst. Interestingly one model has been proposed involving the coalescence of a close binary system, resulting from a collapse of a massive stellar progenitor (Davies et al. 2002). This could naturally account for the time delay between the putative supernova and the gamma ray burst, with a delay of a few days resulting from the orbital decay (through gravitational radiation) of the close binary system.
If the line emitting material is located at much smaller distances ( cm), as in nearby reprocessor models (e.g. Rees & Meszaros 2000) then the need for a significant time delay is reduced. Here, the line emission results from re-processing (via reflection/photoionisation) of continuum photons emitted after the initial burst. However in this scenario, significant continuum emission should be observed at the same time as the line emission, which would render any soft X-ray line features undetectable by current instrumentation (see Lazzati et al. 2002). One possibility that has been suggested (Kumar & Narayan 2002) is that the ionising photons are scattered back towards the ejected material, by a positron-electron shield generated by the initial -rays themselves. This model removes the need for a supernova-GRB delay, as the duration of the line emission is accounted for by the time required for the photons to be scattered back towards the ejected matter.
Including GRB 011211, there have now been 4 detections of GRB afterglows with XMM-Newton (GRB 001025A and GRB 010220, Watson et al. 2002; GRB 020322, Ehle et al. 2002), whilst the X-ray afterglow for the faint burst GRB 020321 could not be localised. Interestingly, line emission features are also indicated in the X-ray afterglows of GRB 001025A and GRB 010220 (Watson et al. 2002). Similar to GRB 011211, the spectrum of GRB 001025A appears to exhibit a blend of soft X-ray line emission, from the medium-z elements such as Mg, Si, S, and Ar. In contrast, the spectrum of GRB 010220 shows a strong iron-group (i.e. Fe, Co or Ni) line (equivalent width keV), although here the X-ray spectrum is absorbed below 1 keV, rendering any soft X-ray line emission undetectable. Both fits favour an over abundance of Nickel (or Cobalt) to iron, which is suggestive of a short time delay (days rather than months) between the putative supernova and burst. Thermal emission models are formally required to fit the soft X-ray excess observed in GRB 001025A, whilst the spectrum of GRB 010220 can be equally well fitted by either thermal or reflection models. Thus soft X-ray line emission is required in at least 2 of the XMM-Newton afterglow spectra (GRB 011211 and GRB 001025A), the exception being the recent burst GRB 020322, which appears to exhibit a featureless (but absorbed) power-law spectrum (Reeves et al. 2002b, in preparation).
It seems possible that soft X-ray line emission features are relatively common in X-ray afterglow spectra, whilst thermal emission models can fit 3 out of the 4 present XMM-Newton spectra. The previous lack of detection of soft X-ray features with Chandra and Beppo-SAX can be accounted for by the lower effective area of the ACIS-S and LECS detectors respectively in the soft X-ray band. Indeed XMM-Newton is the first X-ray mission with the sensitivity required to detect any putative soft X-ray features in GRBs at energies below 2 keV. It is important that XMM-Newton performs follow-up observations of bright ( erg cm-2 s-1) afterglows, within several hours of the burst, to determine the frequency the soft X-ray line emission. Ultimately, through monitoring the temporal behavior of the line emission from minutes to many hours after a burst, the X-ray telescope on-board NASA’s forthcoming Swift mission will be able to trace the distribution of matter around the burst explosion and solve the ambiguities that arise when discriminating between the current GRB models.
Acknowledgements.
This paper is based on observations obtained with XMM-Newton, an ESA science mission with instruments and contributions directly funded by ESA Member States and the USA (NASA). James Reeves would like to thank the Leverhulme Trust organisation for their support, in the form of a Research Fellowship.References
- (1) Amati L., Frontera F., Vietri M., et al. , 2000, Science, 290, 953
- (2) Antonelli L.A., Piro L., Vietri M., et al. , 2000, ApJ, 545, L39
- (3) Ballantyne D.R., Ramirez-Ruiz E., 2001, ApJ, 559, L83
- (4) Bevington P.R., Robinson D.K., 1992, Data Reduction and Error Analysis for the Physical Sciences, McGraw-Hill, New York (1992)
- (5) Borozdin K.N., Trudolyubov S.P. 2002, ApJ, submitted, (astro-ph/0205208)
- (6) Burud I., Rhoads J., Fruchter A., Hjorth J., 2001, GRB Circular Network, 1213
- (7) Davies M., King, A., Rosswog, S., Wynn, G., 2002, ApJ, submitted (astro-ph/0204358)
- (8) Ehle M., Rodriguez-Pascual, P., Loiseau, N., et al. , 2002, GRB Circular Network, 1293
- (9) Fox D.W., Bloom J.S., Kulkarni S.R., 2002, GRB Circular Network, 1311
- (10) Frontera F., Amati L., Guidorzi C. 2001, GRB Circular Network, 1215
- (11) Holland S.T., Soszynski I., Gladders M.D., 2002, et al. , AJ, in press (astro-ph/0202309)
- (12) Jansen F., Lumb D., Altieri B., 2001, A&A, 365, L1
- (13) Kumar P., Narayan R., 2002, ApJ, submitted (astro-ph/0205488)
- (14) Lazzati D., Ramirez-Ruiz E., Rees, M.J., 2002, ApJ, 572, L57
- (15) Lazzati D., Ghisellini G., Amati L., Frontera F., Vietri M., Stella L., 2001, ApJ, 556, 471
- (16) Mewe R., Gronenschild E.H.B.M., van den Oord, G.H.J., 1985, A&AS, 62, 197
- (17) Piro L., Garmire G., Garcia M., et al. , 2000, Science 290, 955
- (18) Piro L., Amati L., Antonelli L.A., 1998, A&A, 331, L41
- (19) Protassov, R., Van Dyk, D.A., Conners, A., Kashyap, V.L., Siemiginowska, A., 2002, ApJ, 571, 545
- (20) Rees M.J., Meszaros P., 2000, ApJ. 545, L73 (2000)
- (21) Reeves J.N., Watson D., Osborne J., et al. , 2002, Nature, 416, 512
- (22) Rutledge, S., Sako, M., 2002, MNRAS, submitted (astro-ph/0206073)
- (23) Santos-Lleo M., Loiseau N., Rodriguez P., Altieri B., Schartel N., 2001, GCN Circular Natwork 1192
- (24) Struder L., Briel U., Dennerl K, et al. , 2001, A&A, 365, L18
- (25) Turner M.J.L., Abbey A., Arnaud M., et al. , 2001, A&A, 365, L27
- (26) Vietri L., Stella L., 1999, ApJ, 527, L43
- (27) Watson D., Reeves J.N., Osborne J., et al. , 2002, A&A, submitted
- (28) Woosley S.E., Weaver T.A., 1995, ApJS, 101, 181
- (29) Woosley S.E., 1993, ApJ, 405, 273
- (30) Yoshida A., Yonetoku N.M., Marakami T., Otani C., Kawa N., Ueda Y., Shibata R., Uno S., 1997, ApJ, 557, L27