22institutetext: Service d’Astrophysique, CEA Saclay, F-91191 Gif-sur-Yvette, France
33institutetext: Astronomical Institute Anton Pannekoek, University of Amsterdam, Kruislaan 403, NL-1098 SJ Amsterdam, The Netherlands
The absence of the 10 m silicate feature in the isolated Herbig Ae star HD 100453
We analyse the optical and IR spectra, as well as the spectral energy distribution (UV to mm) of the candidate Herbig Ae star HD 100453. This star is particular, as it shows an energy distribution similar to that of other isolated Herbig Ae/Be stars (HAEBEs), but unlike most of them, it does not have a silicate emission feature at 10 m, as is shown in Meeus et al. (2001). We confirm the HAEBE nature of HD 100453 through an analysis of its optical spectrum and derived location in the H-R diagram. The IR spectrum of HD 100453 is modelled by an optically thin radiative transfer code, from which we derive constraints on the composition, grain-size and temperature distribution of the circumstellar dust. We show that it is both possible to explain the lack of the silicate feature as (1) a grain-size effect - lack of small silicate grains, and (2) a temperature effect - lack of small, hot silicates, as proposed by Dullemond et al. (2001), and discuss both possibilities.
Key Words.:
circumstellar matter - stars: pre-main sequence; individual: HD 100453 - ISM: lines and bands(e-mail: gwendolyn@aip.de)
1 Introduction
Herbig Ae/Be stars are intermediate-mass pre-main sequence stars which show an IR excess due to circumstellar (CS) dust. This dust is believed to be located in a disc (see e.g. Adams et al. 1987; Beckwith et al. 1990; Meeus et al. 1998); Chiang & Goldreich (1997) were the first to develop a CS disc model in which a warm layer of optically thin material surrounds the (cold) midplane. This passive disc model provides an elegant solution to the puzzling observation that the disc must be optically thick in the near-IR and mid-IR (in order to account for the sub-millimeter flux) while the Si-O stretch of amorphous silicates at 9.7 m is observed to be in emission (implying it is caused by optically thin dust).
Since small amorphous silicate grains are the most abundant dust species in interstellar space, their spectral signature is expected to be present during virtually all stages of the star formation process: in absorption during the protostellar collapse and active accretion disc phases, and in emission during the passive disc and debris disc phases. Indeed, observations of star forming regions confirm this picture. However, during our analysis of the infrared spectra of passive discs surrounding isolated Herbig Ae/Be stars taken with the Infrared Space Observatory (ISO; Kessler et al. 1996), we found that some stars do not show any evidence for the presence of the 9.7 m band (Meeus et al. 2001, hereafter Paper I). In Paper I we speculate that the lack of silicate emission is due to the absence of small silicate grains in the disc, due to grain growth and the removal of small grains by radiation pressure.
Dullemond et al. (2001, hereafter DDN) propose a different explanation, by avoiding the presence of small silicate grains in a certain temperature range. In the DDN model, the disc inner rim has a large scale-height due to the fact that it receives direct stellar radiation (an effect not taken into account in the Chiang & Goldreich models). The inner rim causes a shadowed region behind the rim where the temperature is low; at some distance from the star the surface of the flaring disc emerges from the shadow and receives direct starlight. The rim causes two effects: (1) it creates a prominent near-IR flux contribution which is in good agreement with observations (see Natta et al. 2001, DDN), and (2) for certain rim heights the shadowed region can suppress the strength of the 9.7 m silicate emission (see DDN).
Stimulated by these considerations, we decided to derive empirical constraints on the amount of mass that can be present in the form of warm optically thin silicate grains in HAEBE stars that lack the silicate feature. We investigate the effect the size and the temperature distribution of dust grains can have on the appearance of spectral features. Therefore, we look for observational constraints on the average size of the silicate grains and the maximal mass of small, warm silicate grains. This we do by modelling the isolated Herbig Ae star HD 100453, which is one of the four isolated HAEBEs in our sample where the silicate feature is found to be absent (Meeus et al. 2001). We selected this star because it is the brightest of all four, resulting in observations with higher signal to noise ratios. The model we used to derive the constraints is the optically thin radiative transfer code MODUST (Bouwman & de Koter, in preparation).
2 Earlier and new observations
| Spectral | V | E[B-V] | Teff | log g | L | LIR/L∗ | R | Age | Parallax | Distance | v i |
| Type | (mag) | (K) | (L⊙) | (R⊙) | (Myr) | (″) | (pc) | (kms-1) | |||
| A9Ve | 7.79 | 0.08 | 7500 | 4.5 | 0.77 | 1.86 | 10 |
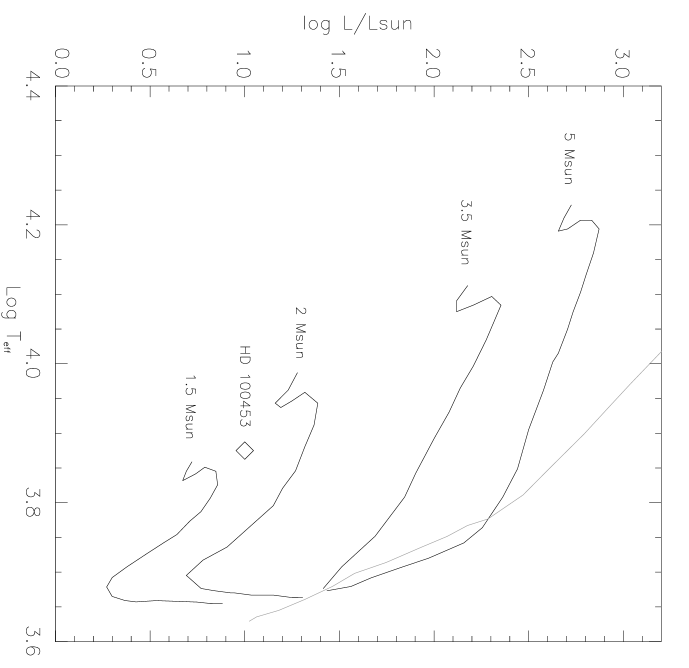
The star HD 100453 was classified as a planetary nebula by Garcia-Lario et al. (1997). However, recent observations show it to be an A9Ve type star, belonging to the group of the isolated HAEBEs (Meeus et al. 2001), which are considered as the more evolved members of the group. Hipparcos measurements give a parallax of 8.76 mas, from which a distance of 114 pc is derived. We located the star in the Hertzsprung-Russell-diagram (see Fig. 1). Its position is close to the ZAMS; its age is estimated to be 10 Myr (van den Ancker, private communication).


HD 100453 was observed in February 1999 with the echelle spectrograph Feros on the ESO 1.52m telescope at La Silla. We obtained a spectrum covering the wavelength range between 3700 and 9220 Å. Earlier studies of HD 100453 had not yet established its HAEBE membership, but the spectrum we obtained in the H region (Fig. 2, upper panel) readily confirms its emission-line character. The H profile is double peaked, and it shows an additional redshifted emission component. About 50% of the HAEBEs also show a double-peaked emission profile (Finkenzeller & Mundt 1984). In the lower panel of Fig. 2, we display the region around 5850 Å; it is typical for a young star surrounded by a disc: the He I line appears in absorption, which is not expected for the atmosphere of an A9-type star. We suggest that it has a CS origin, probably from a hot region close to the stellar surface, as the width of the line is similar to the rotational velocity of the star. Dunkin et al. (1997) suggest that the presence of excess He I emission or absorption is associated with accretion, bringing the impacting material to a higher temperature. Dunkin et al. (1997) further noted that HAEBE stars with a double-peaked H profile show He I 5876 Å in absorption, unlike stars with a single-peaked H profile, which show the same line in emission; this is probably an inclination effect (see also Meeus et al. 1998). Furthermore, the Sodium lines are mainly stellar, as appears from a comparison between the observed spectrum and a synthetic spectrum of a star with similar parameters; they show an additional - probably CS - weak core emission, which has also been observed in other HAEBEs (Dunkin et al. 1997). We conclude that the optical spectrum of HD 100453 is consistent with a HAEBE nature for this star.

We constructed a SED for HD 100453, composed of optical, near-IR and IR data up to 100 m (see paper I for references), and a recent millimetre observation at 1.2 mm with SIMBA on the SEST (F1.2mm = 30 3 mJy; S. Wolf, private communicaton); the SED displayed in Fig. 3. From this long-wavelength observation we derived a gas mass of Mg = 3.0 10-3 M⊙, following Henning et al. (1998).
HD 100453 was observed with ISO-SWS, in the full scan mode (mode AOT1); there is no LWS spectrum available. The SWS spectrum spans between 2 and 45 m; it is relatively featureless, apart from the PAH features which are observed at 3.3, 6.2, 7.7 and 11.2 m. The spectrum is relatively flat in the short wavelength region, but then rises steeply longwards of 10 m. In our sample of 14 isolated HAEBEs (Meeus et al. 2001), we defined two groups based upon the shape of the SED in the IR: the geometry of group I sources was associated with an optically thin, flared region surrounding an optically thick, cold disc, for group II sources with a geometrically flat disc. These groups were further subdivided based upon the presence (a) or absence (b) of the 10 m silicate feature. HD 100453 is one of the four stars belonging to group Ib: the silicate emission feature is absent while the overall shape of the energy distribution is very much like that of other isolated HAEBEs which do show a silicate feature (group Ia).
3 Modelling
We used an optically thin radiative transfer model, the code MODUST (Bouwman & de Koter, in preparation) which was already succesfully used to reproduce the SWS spectra of several other isolated HAEBEs: AB Aur and HD 163296 by Bouwman et al. (2000a), HD 100546 and HD 142527 by Malfait et al. (1998, 1999). These studies revealed several common characteristics of the CS dust around HAEBEs: first, the dust is distributed over two temperature regimes, a hot (T 1500-400 K) and a cold (T 300-20 K) one; most of the mass is contained in the cold component. Furthermore, the bulk of the mass ( 70%) consists of silicates. Other dust components such as carbonaceous material, iron oxide, metallic iron and water ice are present as well; some stars also show evidence for crystalline material (silicates and water ice). Both the density and the size distribution are assumed to have a power-law dependence of the radial distance and size , respectively. For a thorough description of the dust model, we refer to Bouwman et al. (2000a).

In Fig. 4 we display the emission properties of silicate grains of different sizes, to show the influence of the grain size upon the appearance of the 10 micron spectral feature. When the grains become larger, the peak shifts towards longer wavelengths, while the strength relative to the continuum diminishes. From a certain grain size ( 5 m), the feature is no longer distinguishable from the continuum. In the following, we will refer to particles smaller than this size as small particles.
3.1 Problems encountered while modelling
A known problem when modelling the CS dust emission in the IR is that both the spatial distribution as the dust properties cannot be determined uniquely by relying only upon IR spectral observations. This means that modelling attempts will always yield a possible solution, but not a unique one. We therefore looked for constraints on dust properties and composition, rather than for the best fit. Bouwman et al. (2000b) identified and discussed several degeneracies (e.g. different grain-size distributions and/or disc boundaries can reproduce the same spectrum, providing the dust has the same average temperature) occuring when modelling CS dust; we refer to that study for a discussion.
3.2 Fitting the spectrum of HD 100453
An obvious way to hide the silicate feature is to make the silicate grains large or to restrict the amount of small, warm silicate grains. If, in such a model, small carbon grains were still present, this would result in a dust model in which the emission of the carbon grains dominate. However, the coexistence of an average size distribution of carbon grains which is substantially smaller than that of the silicate grains is not physically likely. Indeed, carbon and silicate particles are expected to coagulate in the same amount, since they have similar surface properties and critical velocities for sticking to occur (Chokshi et al. 1993). Therefore, we attempted to model the spectrum with similar size distributions for silicate and carbon grains, and in the cold component even for water ice. Furthermore, we searched for a solution with a continuous size distribution, in which small silicates are not a priori excluded.
In our modelling we ignored inclination effects. It is indeed possible to remove the silicate feature assuming an edge-on orientation of the disc, but this would imply large optical and near-IR extinction. This is not observed, given the relatively small value of E[B-V] and the presence of a near-IR excess.
The lack of spectral bands in the spectrum of HD 100453 makes it difficult to model, as the composition of the dust is virtually unconstrained. From a comparison with other isolated HAEBEs, however, we know that the shape of the IR energy distribution of HD100453 is typical for a HAEBE star (see paper I). Therefore, we took as a starting point the derived dust composition of AB Aur, which was also modelled with MODUST (Bouwman et al. 2000a) and varied the parameters to fit the spectrum of HD 100453. We studied the effect of the size and temperature distribution on the presence and strength of the silicate feature in two steps: (1) first we considered a similar -continuous- size distribution for silicate and carbon grains, and matched that to the observed spectrum and determined the smallest average size still in agreement with the observed spectrum; (2) in a next step, we made an estimate of the maximum mass of small silicate grains that can be present, by adding single-sized small silicate grains to the previous fit.
3.2.1 Similar size distributions for silicate and carbon grains
It is clear that different species located within the same distance range can have a different temperature, because of their different absorption and emission properties. An important effect of adopting similar grain sizes while needing larger silicate grains to avoid the silicate feature is that the dust should be located relatively close to the star, so that it can become warm enough.
We used MODUST with two dust shells as input, representing two different temperature regimes. The two distinct temperature regimes of the CS dust are a hot dust component with a mass averaged temperature of 360 K, and a cold dust component with a mass averaged temperature of 60 K. The hot region is located at a distance of 0.4, extending out to 3.4 AU; the cold regime starts at 8 AU, while for the outer radius a value of 96 AU is assumed. We stress that the distances adopted here and in the following parts for the hot and cold component are merely chosen to obtain a correct average dust temperature to fit the spectrum, and are probably not the actual dimensions of the shell due to the neglect of optical depth effects. E.g., the presence of a gap could be an artefact of our modelling and might not be necessary if a part of the disc is shielded from direct stellar radiation, for instance by an optically thick region. This would also allow for two distinct temperature regimes. This geometry can be verified when using a 2-D model, allowing for a more complicated geometry and different optical thicknesses in different regions.
| Component: | Hot | Cold | ||
|---|---|---|---|---|
| Radius (AU) | 0.4–3.4 | 7.6–96 | ||
| [gr cm-3] | 5.0 10-15 | 8.0 10-16 | ||
| Mdust (M⊙) | 2.9 10-9 | 5.6 10-6 | ||
| T range (K) | 230–1500 | 20–200 | ||
| Dust species | Mfrac | (m) | Mfrac | (m) |
| Olivine | 0.76 | 4–200 | 0.76 | 1.6–250 |
| Carbon | 0.16 | 4–200 | 0.13 | 1.3–200 |
| Water Ice | – | – | 0.11 | 1.6–200 |
| Metallic Iron | 0.08 | 0.01–2.5 | – | – |
| Iron Oxide | 0.003 | – | 0.0001 | – |
We derived a total dust mass in the hot component of 2.9 10-9 M⊙ and 5.6 10-6 M⊙ for the cold component. Most of the mass is thus in the cold dust component (the cold over hot dust mass ratio is ). In Table 2, we list the parameters of the best model fit; in Fig. 5 we show this fit, overlaid on the observed SWS spectrum.

Because of the absence (apart from PAH bands) of spectral features in the spectrum of HD 100453, constraints upon the chemical composition of the CS dust are difficult to make. Keeping the other parameters listed in Table 2 as a constant, we derived the following compositional limits for our hot component: amorphous olivine (70–76%), amorphous carbon (8–16%) and metallic iron (8–12%). Iron oxide might be present as well, but is not needed to obtain a satisfactory fit (0–10%); its presence, however, is likely because of the fast oxidation rates of metallic iron (Jones 1990). The presence of metallic iron is needed to explain the hottest near-IR region, as other species would not survive the high temperatures which are close to the dust destruction temperatures. For the cold component, next to amorphous silicates (70–90%) and carbon (8–14%), also iron oxide is likely to be present, though in very small amounts. Also water ice might be present in the cold component, but it is not required (0–20%) to obtain a satisfactionary fit; we included it in analogy with modelling results of other isolated HAEBEs. The presence of metallic iron is highly unlikely in the cold component, given their relatively short oxidation timescale (Jones 1990) at lower temperatures (T 400 K). Crystalline silicates might be present, but will not reveal their presence in the spectrum when adopting the same size distribution as we assumed for the amorphous silicates; we therefore did not consider them in our simple approach.
As we discussed above, from a featureless spectrum, it is difficult if not impossible to determine the exact grain-size distribution. Furthermore, there is a degeneracy in maximum grain size : when one moves the outer radius more in, becomes larger, as larger grains at a smaller distance can produce a similar continuum as smaller grains at larger distance. For the purpose of this paper we consider the mean radius , defined as
| (1) |
where is the number of particles with size . We use this value because the maximum radius is only poorly constrained due to the steep powerlaw of the size distribution required to fit the spectrum. From our modelling, some trends can be noted: the silicate grains around HD 100453 are substantially larger than what is found for the interstellar medium (there is between 0.005 and 0.25 m, with a mean radius of 0.008 m; Mathis et al. 1977); the mean radius of the cold silicate grains is smaller (2.7 m) than that of the hot silicate grains (6.7 m). An important result is that the minimum radius of the smallest grains is larger in the hot component than in the cold component. This can be explained as follows: in the hot component, small grain would cause a silicate emission feature, therefore they cannot be present. Grains in the cold component, however, are so cold that no relevant contribution at 10 micron is produced by the emission of these grains. Therefore, small grains are allowed there without contradiction to the observed spetrum.
3.2.2 Maximum mass of small, hot silicate particles
In the previous section, we showed that we could reproduce the spectrum of HD 100453 with a dust composition favouring larger ( 6.7 m) silicate grains; we will now show that small grains still can be present, albeit in a limited amount. Therefore, we started from our previous fit, and added grains of several characteristic sizes to this model: = 0.01, 0.02, 0.05, 0.1, 0.2, 0.5, 1 and 2 m. For these grains, the same radial density dependence as the one used in the previous fit was adopted, with the same boundaries. For each selected silicate grain size, a certain amount of silicate was added to the fit, up to a value which is still in agreement with the observed absence of the spectral silicate feature; we always ran the model with just a unique size of small silicates. Herewith, we obtained for each selected size a maximum mass of the silicate grains which can be present.In Fig. 6, we show the effect of adding an increasing mass of silicate grains for = 0.1 m.

The results are shown in Table 3. An obvious trend is that, the larger becomes, the more mass can be added without causing a spectral feature. In the cold component, the amount of mass that can be added is a factor of 1000 larger than in the hot component, while the feature at 20 m is now much more prominent. We also note the expected temperature drop of the silicates when they become larger. The maximum mass possibly residing in small, hot grains is 0.2 to 0.7% of the hot dust mass, which is a negligible fraction of the total dust mass.
| Component: | Hot | Cold | ||
|---|---|---|---|---|
| Size | Mmax | T | Mmax | T |
| (m) | (10-12 M⊙) | (K) | (10-8 M⊙) | (K) |
| 0.01 | 4.54 | 688 | 0.63 | 103 |
| 0.02 | 4.28 | 703 | 0.76 | 105 |
| 0.05 | 3.60 | 760 | 0.76 | 110 |
| 0.1 | 3.56 | 793 | 0.88 | 113 |
| 0.2 | 3.40 | 744 | 1.89 | 109 |
| 0.5 | 5.73 | 589 | 2.52 | 97 |
| 1 | 10.3 | 465 | 5.05 | 86 |
| 2 | 17.2 | 376 | 7.57 | 74 |
4 Discussion
4.1 Comparison with the Herbig Ae star AB Aur
In an earlier study, the spectrum of AB Aur has been modelled with MODUST
(Bouwman et al. 2000a). The overal shape of the infrared SED of AB
Aur is quite similar to that of HD 100453, but unlike that star, it shows
emission features of amorphous silicate, indicating the presence of small, warm
silicate grains. To summarise, the hot component of AB Aur can be reproduced with
a dust shell consisting for 71% of small ( = 0.01–5.0 m) silicate
grains, with a mean radius of 0.02 m. The cold component also contains
larger grains, up to a size of 126 m, resulting in a mean radius of
0.09 m. We now compare the results of AB Aur with those of HD 100453,
considering two questions:
Question 1: Are there small silicates present around HD100453?
We assumed a silicate grain size distribution similar to that of carbon, and did not
set a lower grain size limit a priori. We derived that, in order to avoid the spectral
feature to become visible, the minimum mean radius in the hot component needs to be
6.7 m, with a lower grain size limit of 4 m. This mean radius is 335
times larger than the one derived for the hot silicate grains in AB Aur; this means
that in this case, the size of silicate grains in HD 100453 should be much
larger than in AB Aur.
Question 2: How many small, hot silicates can be present in HD 100453?
For AB Aur, the mass of the small, hot silicate grains is 1.9
M⊙, with a ratio of small, hot silicate mass over hot dust mass 71
; this is much more than what is found for HD 100453. In
this source we find that the ratio
of the mass of small, hot silicates over the total hot dust mass to be
at most 0.2–0.6
10-2. We can conclude that the mass of small, hot silicate grains around
HD 100453 is at least a factor 100 to 500 times less than for AB Aur.
4.2 Lack of small silicate grains
As shown above, the ISO-SWS spectrum of HD 100453 can be fitted with a model which lacks small grains. This lack of small grains may be caused by several mechanisms: (1) If the gas content of the disc is very low the small grains are removed by radiation pressure and/or Poynting-Robertson (P-R) drag; (2) Otherwise, the grains in the disc have experienced more coagulation than other systems with a similar energy distribution, leading to a strong depletion of small grains.
Adopting the timescale for P-R drag given by Backman & Paresce (1993), we derive that for a system like HD 100453, it will take approximately 7 yrs to remove grains up to a size of 10 m up to a distance of 10 AU from the star. Radiation pressure would act even more efficiently, and remove all grains wich are smaller than a few microns in yrs, up to a distance of 1000 AU. Thus, the age of HD 100453 (larger than 10 Myrs) suggests that, if there is only little gas left to mix with the dust particles, radiation pressure and P-R drag had enough time to remove small grains. However, the (low) luminosity of HD 100453 results in larger timescales for these processes than e.g. would be the case for AB Aur (L 48 L⊙; age 2–4 Myr), which still has small grains. Furthermore, there are HAEBE stars of a similar age as HD 100453 and with higher luminosities (e.g. HD100546, L 32 L⊙) that also still show a lot of small, hot silicate grains. More important, the presence of PAHs around these stars require the presence of gas, which would make these dust grain removal processes inefficient. It is hence improbable that radiative small dust grain removal processes have taken place on a large scale in the disc around HD 100453.
This leaves coagulation as an alternative. However, it is hard to understand the presence of very small grains as PAHs in the immediate environment of HD 100453 and also to require the silicate grains to have coagulated so efficiently, leaving a gap in the size distribution between the PAHs and the larger grains. A possible explanation would be that the PAHs are located further away from the star - due to the single-photon heating of these grains, the emission temperature of PAHs is independent of distance. Therefore, the PAHs are not necessarily co-spatial with the hot silicate grains. Even though coagulation may have removed small grains, there is no evidence that it has produced particularly large grains in HD100453. Recent millimetre observations (S. Wolf, private communication) imply a spectral slope between the 100 micron and 1.2 mm fluxes of = -3.7; where Fλ . Here we need to remark that including the 100 micron point in deriving the mm-slope -which was necessary because of a lack of more mm-observations- makes this slope on average 0.5 dex shallower than when calculated from mm-points alone, as we could deduce from our other observations of HAEBEs. This means that the derived slope is only an upper limit and that the real mm-slope probably lies between -4.4 and -3.9. When we now compare this value with the other HAEBEs in our sample (Paper I), it is clear that most of these stars show a shallower long-wavelength slope ( between –4.28 and –2.65, with an average of -3.25), suggesting that in these objects larger grains are responsible for the long-wavelength emission than in HD 100453. This indicates that coagulation has not yet occured on a large scale in HD 100453, a fact which may be in contradiction with the required efficient coagulation of small grains.
4.3 Lack of small, hot silicate grains
In Sect. 3.2.2 we showed that the IR appearance of HD 100453 can be interpreted as a result of a lack of small silicate grains of a certain temperature range, which we estimated to be between about 1000 and 200 K. Interestingly, this possibility has received theoretical support through the new disc models by Dullemond et al. (2001). DDN show that the SED of HAEBE stars can be understood in terms of a disc which has an inner radius whose scale-height is a significant fraction of the disc inner radius. This puffed-up inner disc region results in substantial shadowing of the region outside of this inner rim. This is the region where one normally would find grains with temperatures optimal for producing the 10 m silicate bump. Indeed, a preliminary fit of HD 100453 with the model of DDN predict that, of all grains in the optically thin surface layer, there is a only 3.4 M⊙ that is warmer than 200 K. This is a negligible amount in the required temperature range to cause the silicate emission feature, and a number that is consistent with our empirical limits. However, in order to efficiently suppress the 10 m silicate band, the DDN models require either an artificially large scale-height of the inner disc region or a gap in the disc at the location where the silicate feature normally is produced (Dominik et al 2002, in preparation). It is currently not clear if and how such a high scale height can be achieved. We conclude that the shielding of part of the inner disc by a high inner rim is an interesting alternative explanation for the lack of 10 micron silicate emission in certain HAEBE stars. This idea can be tested by obtaining high spatial resolution near-IR images, e.g. with AMBER on the VLT interferometer.
5 Conclusions
We searched for an explanation for the absence of the 10 m silicate feature in the spectrum of HD 100453 in terms of either a size or a temperature effect. We first showed, from a study of the optical spectra, that the star belongs to the group of the isolated HAEBEs. HD 100453 is member of group Ib, which contains stars with an increasing IR SED that lack the silicate emission feature (see paper I). Our conclusions can be summarised as follows:
-
1.
we confirmed the HAEBE nature of HD 100453 with the observation of the H line in emission, as well as the presence of other typical CS HAEBE lines; furthermore, the star has an age of approximately 10 Myr and is located close to the ZAMS
-
2.
we modelled the IR spectrum of HD 100453 with an optically thin radiative transfer code, with the following properties:
-
•
the dust emission stems from two different temperature regimes, with an average temperature of 360 K and 60 K; the bulk of the mass consists of amorphous silicates, but carbonaceous material and iron(oxide) are present as well
-
•
the absence of the silicate emission feature can be caused by the absence of small particles: a size distribution starting at 4 m, with an average of 6.7 m does not reveal the silicate feature. The minimum average radius derived for the silicate particles is about 355 times larger than that for AB Aur, suggesting that, in the disc of HD 100453, grain growth has taken place on a much larger scale than in the disc of AB Aur.
-
•
we exclude dust removal processes such as radiation pressure and P-R drag to be the main cause for the difference in grain size, given the larger luminosity of AB Aur and, more important the presence of CS gas which makes this processes inefficient
-
•
the presence of small (hot) particles of species other than silicates (such as PAHs and metallic iron) is established. Furthermore, from a comparison of the slope at longer (IR-mm) wavelengths with other HAEBEs showing the silicate feature, we deduce a lack of large grains in the CS disc of HD 100453. These may be seen as arguments against the coagulation explanation for the absence of the silicate feature.
-
•
-
3.
alternatively, the absence of the silicate emission feature can be caused by the absence of a large amount of small, hot silicates; colder (T 200 K), small silicates still can be present in a much larger amount. We obtained a maximal mass of small, hot silicates between 10-12 and 10-11 M⊙, which is 0.2 to 0.7 % of the hot dust mass, and roughly a factor 10-6 of the total dust mass. When comparing HD 100453 with AB Aur, the maximal mass residing in the small, hot grains is a factor hundred to five hundred smaller. The derived maximal mass is in agreement with the theoretical predictions by DDN. They propose shielding by a puffed-up inner region as an attractive explanation for the absence of hot, small silicates; and hence for the absence of the 10 micron silicate emission feature.
High spatial resolution observations are needed to give constraints on the location of the grains emitting in the infrared; also more long-wavelength observations are necessary to study the coldest dust. Only then will we be able to clearly distinguish between both effects.
Acknowledgements.
We thank M. van den Ancker for providing fundamental parameters, T. Reyniers for help on some of the calculations, and S. Wolf, for observing HD 100453 with SIMBA/SEST. Part of this research was funded by the EC-RTN on “The Formation and Evolution of Young Stellar Clusters” (RTN–1999–00436, HPRN–CT–2000–00155) and by the DLR grant 50 OR 0004. CD, LBFMW and AdK acknowledge financial support from NWO Pioneer grant 6000-78-333. This research has made use of NASA’s ADS Abstract Service.References
- Adams et al. (1987) Adams, F. C., Lada, C. J., & Shu, F. H. 1987, ApJ, 312, 788
- Backman & Paresce (1993) Backman, D. E. & Paresce, F. 1993, in Protostars and Planets III, 1253–1304
- Beckwith et al. (1990) Beckwith, S. V. W., Sargent, A. I., Chini, R. S., & Guesten, R. 1990, AJ, 99, 924
- Bouwman et al. (2000a) Bouwman, J., de Koter, A., van den Ancker, M. E., & Waters, L. B. F. M. 2000a, A&A, 360, 213
- Bouwman et al. (2000b) Bouwman, J., de Koter, A., van den Ancker, M. E., & Waters, L. B. F. M. 2000b, in ASP Conf. Ser. 196: Thermal Emission Spectroscopy and Analysis of Dust, Disks, and Regoliths, 63–70
- Chiang & Goldreich (1997) Chiang, E. I. & Goldreich, P. 1997, ApJ, 490, 368
- Chokshi et al. (1993) Chokshi, A., Tielens, A. G. G. M., & Hollenbach, D. 1993, ApJ, 407, 806
- Dullemond et al. (2001) Dullemond, C. P., Dominik, C., & Natta, A. 2001, ApJ, 560, 957
- Dunkin et al. (1997) Dunkin, S. K., Barlow, M. J., & Ryan, S. G. 1997, MNRAS, 290, 165
- Finkenzeller & Mundt (1984) Finkenzeller, U. & Mundt, R. 1984, A&AS, 55, 109
- Garcia-Lario et al. (1997) Garcia-Lario, P., Manchado, A., Pych, W., & Pottasch, S. R. 1997, A&AS, 126, 479
- Henning et al. (1998) Henning, T., Burkert, A., Launhardt, R., Leinert, C., & Stecklum, B. 1998, A&A, 336, 565
- Jones (1990) Jones, A. P. 1990, MNRAS, 245, 331
- Kessler et al. (1996) Kessler, M. F., Steinz, J. A., Anderegg, M. E., et al. 1996, A&A, 315, L27
- Malfait et al. (1999) Malfait, K., Waelkens, C., Bouwman, J., de Koter, A., & Waters, L. B. F. M. 1999, A&A, 345, 181
- Malfait et al. (1998) Malfait, K., Waelkens, C., Waters, L. B. F. M., et al. 1998, A&A, 332, L25
- Mathis et al. (1977) Mathis, J. S., Rumpl, W., & Nordsieck, K. H. 1977, ApJ, 217, 425
- Meeus et al. (1998) Meeus, G., Waelkens, C., & Malfait, K. 1998, A&A, 329, 131
- Meeus et al. (2001) Meeus, G., Waters, L. B. F. M., Bouwman, J., et al. 2001, A&A, 365, 476
- Natta et al. (2001) Natta, A., Prusti, T., Neri, R., et al. 2001, A&A, 371, 186
- Palla & Stahler (1993) Palla, F. & Stahler, S. W. 1993, ApJ, 418, 414