Chandra observation of the central galaxies in A1060 cluster of galaxies
Abstract
Chandra observation of the central region of the A1060 cluster of galaxies resolved X-ray emission from two giant elliptical galaxies, NGC 3311 and NGC 3309. The emission from these galaxies consists of two components, namely the hot interstellar medium (ISM) and the low-mass X-ray binaries (LMXBs). We found the spatial extent of the ISM component was much smaller than that of stars for both galaxies, while the ratios of X-ray to optical blue-band luminosities were rather low but within the general scatter for elliptical galaxies. After subtracting the LMXB component, the ISM is shown to be in pressure balance with the intracluster medium of A1060 at the outer boundary of the ISM. These results imply that the hot gas supplied from stellar mass loss is confined by the external pressure of the intracluster medium, with the thermal conduction likely to be suppressed. The cD galaxy NGC 3311 does not exhibit the extended potential structure which is commonly seen in bright elliptical galaxies, and we discuss the possible evolution history of the very isothermal cluster A1060.
1 Introduction
The X-ray emission from elliptical galaxies directly tells us physical conditions of the interstellar medium (ISM), such as total mass, thermal energy, and chemical composition. Also, the number of low-mass X-ray binaries (LMXBs) gives us a clue how actively supernova explosions have occurred in the past. Systematic relation between the X-ray and the optical blue-band luminosities, called the relation, was found with the Einstein observatory (Canizares et al., 1987) and has been used to study the origin of the X-ray emission. The hard component above keV mainly comes from the LMXBs, and its luminosity is almost proportional to the optical one. The softer ISM component ( keV) shows a large scatter in the relation. Matsushita (2001) analyzed PSPC data of 52 early-type galaxies and found that the galaxies are categorized into two groups, one is an X-ray luminous group ( erg s-1) characterized by extended hot halos with a radius of a few times 10, and the other is an X-ray faint group showing compact halos. As shown clearly in the case of NGC 4636 (Matsushita et al., 1998), a large part of the emission in the X-ray luminous galaxies comes from an extended ( kpc) hot ISM, indicating that they have extended potential wells around the galaxies with a scale as large as groups of galaxies.
In many cluster of galaxies, the central regions exhibit strong X-ray emission from low temperature ( keV) gases, which have been interpreted either due to cooling flows or to ISM in central cD galaxies. The recent results for the cooling flow phenomena from Chandra and XMM indicated that the simple cooling-flow picture does not hold in a straightforward manner, and that some heating sources must be working in the center (Tamura et al., 2001; Kaastra et al., 2001; Peterson et al., 2001; Molendi & Fabio, 2001; Sasaki & Yamasaki, 2002). The ASCA study of the Perseus cluster (Ezawa et al., 2001; Furusho et al., 2001) revealed extended ( kpc) cool emission in the center, suggesting a potential structure larger than that of the cD galaxy NGC 1275. The excess central emission of the Centaurus cluster shows that the intra-cluster medium (ICM) is not isothermal but requires at least a two-phase gas (Ikebe et al., 1999). Paolillo et al. (2002) found that the X-ray surface brightness profile around NGC 1399 in the Fornax cluster had three components, i.e. cooling flow region, galactic and cluster halos. The formation process of these hierarchical potential structures around a galaxy or at the center of a cluster of galaxies is not yet understood.
Interaction between the ISM and the ICM may cause a significant effect on the galaxy evolution. Elliptical galaxies in the regions of high galaxy density tend to be X-ray faint (White & Sarazin, 1991). Recently, Vikhlinin et al. (2001) studied the elliptical galaxies NGC 4874 and NGC 4879 in the center of the Coma cluster and found that the sizes of the ISM are as small as 3 kpc. The good spatial resolution of the Chandra observatory enables us to look into the interaction process around bright galaxies in a number of clusters of galaxies.
A1060 (Hydra I cluster, ) is an X-ray bright cluster of galaxies and is considered to be the archetype relaxed system. The ASCA and ROSAT observations of the cluster (Tamura et al., 1996, 2000) showed that the temperature of the ICM is constant at keV with the X-ray luminosity erg s-1 in the 2–10 keV band. An upper limit for the flux of the cool component assuming keV is erg s-1 in the energy band 0.5–3 keV. The X-ray morphology of the cluster is symmetric, and the surface brightness profile is approximated by a single model or a modified “universal” NFW model (Tamura et al., 2000).
There are two giant elliptical galaxies in the center of the cluster. NGC 3311 is the cD galaxy with . An E3 galaxy NGC 3309 with lies at only (22 kpc in projection) away from NGC 3311, i.e. within the core radius of the cluster () obtained by the model fit for the PSPC surface brightness (Tamura et al., 2000). The redshifts of the two galaxies correspond to 3593 km s-1 for NGC 3311 and 4075 km s-1 for NGC 3309, respectively (de Vaucouleurs et al., 1991). Assuming that NGC 3311 is settled at the center of the cluster potential as the cD galaxy, the velocity of NGC 3309 in the ICM would be at least 500 km s-1. The apparently smooth and isothermal ICM and the presence of two giant galaxies makes this system a suitable object for the study of interaction features between galaxies and the ICM.
We use km s-1Mpc-1 and , where the luminosity distance to A1060 is 46 Mpc and an angular size of corresponds to 0.217 kpc. The solar number abundance of Fe relative to H is taken to be (Anders & Grevesse, 1989) throughout the paper.
2 Observation
The Chandra (Weisskopf et al., 2000) observation was carried out with ACIS-I on 2001 June 4 for a total exposure time of 32 ks (OBSID: 2220). The observational mode was Very Faint (VF) using 5 CCD chips (I0123, S2), and the center of the cluster was focused on ACIS-I3. The analysis was performed on the standard processed data, which were prepared by the Chandra X-ray Center (CXC), using the CIAO v2.1 package and calibration products CALDB v2.8. During the observation, the count rate of ACIS-I3 was stable at (RMS) count s-1 when averaged in a 161 s interval, except for a gradual increase by 20% in the last 1.2 ks of the whole observation. We filtered out the data with count rates exceeding 4.5 count s-1, which resulted in the available exposure time of 30463 s.
3 Analysis
3.1 Image and the ICM component
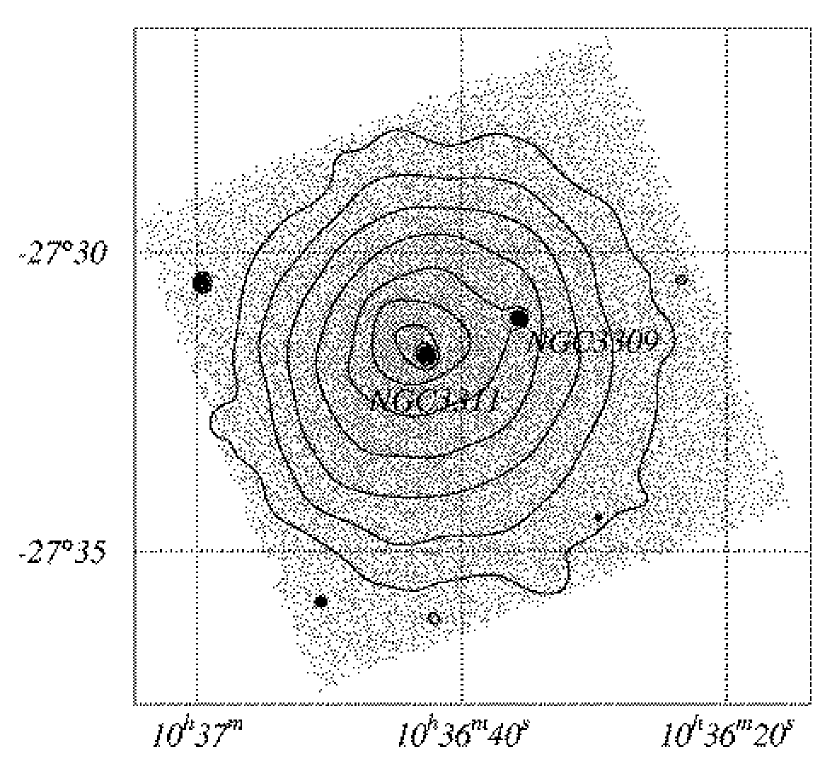
The exposure corrected image taken with ACIS-I3 in the energy band 0.2–1.5 keV is shown in Figure 1. No background is subtracted here. Contours represent an adaptively smoothed image calculated with the CSMOOTH algorithm in the CIAO package, and show logarithmic X-ray intensities between 110-5 and 1.510-3 count arcsec-2 cm-2. The peak near the center of the image corresponds to the cD galaxy NGC 3311, and another peak at west is NGC 3309. These peaks are clearly extended as compared with the combined response for HRMA (with 50% encircled energy diameter of ) (Jerius et al., 2000) and ACIS (), suggesting that the emission comes from the ISM of the galaxies.
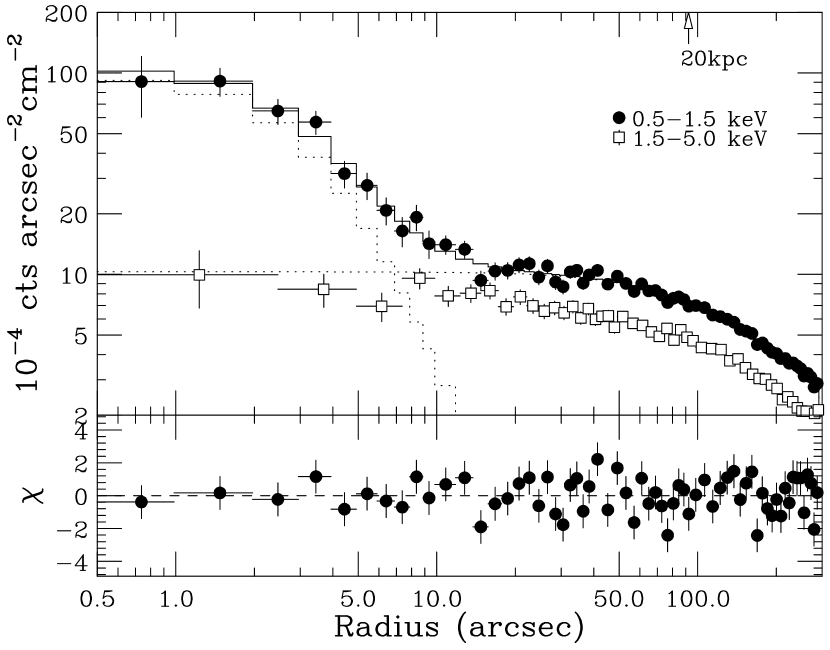
In the first place, we examined the radial profile of the surface brightness. The left panel of Figure 2 shows the profiles in the energy band 0.5 – 1.5 keV and 1.5 – 5.0 keV, which include both the Cosmic X-ray background (CXB) and the non X-ray background (NXB). The center location is asigned to NGC 3311 and the profile covers a radius of , excluding the region with a radius of centered on NGC 3309. The radial profiles broadly consist of two components, namely a narrow emission centered on NGC 3311, likely to be the ISM in the galaxy, and an extended ICM component in A1060. Such a double-component structure is similar to those seen in the Fornax and Centaurus clusters (Ikebe et al., 1996, 1999; Paolillo et al., 2002), which could be empirically fitted with double- models. We tried to fit the profile in 0.5 – 1.5 keV with a double- model, which turned out to be acceptable. The obtained parameters are listed in the first and second rows of Table 1. Looking at only the extended ICM component, the and the core radius () indicate that the emission profile is very different from the previous PSPC result characterized by and (Tamura et al., 2000). We should note, however, that the size of the ACIS chip () is comparable to the core diameter and may not well trace the large ICM structure. This may be the cause of flatter (small ) profile with Chandra. On the other hand, the PSPC data are unable to resolve the emission of NGC 3311, and it could well be the reason for giving the steeper ICM structure. We will deal in the cluster-scale structures of A1060 in a separate paper (see also Furusho et al. (2002)).
The energy spectrum of the ICM emission was examined by taking the data in an annulus with excluding the NGC 3309 region, and is shown in the right panel of Figure 2. The background spectrum including the CXB and NXB is subtracted based on the blank sky data prepared by Maxim Markevitch (http://asc.harvard.edu/cal/). The ICM flux is more than 10 times higher than the sum of CXB and NXB below 5 keV. The spectral fit was performed with the XSPEC v10.0 package. For the energy response, we use a point source response (ARF) for the NGC 3311 as a substitution to the one for the diffuse emission.
When the energy range is limited to 2.0–8.0 keV, the spectral fit of the ACIS spectrum gives the temperature keV with , showing a good agreement with the previous ASCA and ROSAT results, i.e. a Mekal thermal model with keV and metal abundance of 0.3 solar absorbed by the Galactic column density of 1020 cm-2 (Tamura et al., 1996). This suggest that the isothermal ICM is filling up a large volume in A1060, from the outer region to the very inner region within (20 kpc).
The histogram in the right panel of Figure 2 shows the best-fit model by Tamura et al. (1996) compared with the ACIS spectrum. Between 2 and 8 keV, the for this model. However, in the lower energy range down to 0.5 keV with the same spectral parameters, the data points all lie under the model with the deviation by as much as a factor of 2, and the value in this energy range is . If we fit the spectrum by adjusting the hydrogen column density as a free parameter, the best fit value becomes 1.71021 cm-2. However, we are certain from the PSPC spectrum (Tamura et al., 2000) that there is no significant absorption in excess of the Galactic (6 1020 cm-2). The flux difference between the model and the data in 0.5–1 keV is 410-13 erg cm-2 s-1 which is about 5 times larger than those of the central two galaxies as shown later. Therefore, contamination of the galaxy component in the ASCA data cannot explain the spectral difference. We compare the energy spectra of PSPC, GIS and ACIS from the same radius of 98”, including the galaxies NGC 3311 and NGC 3311, and the descrepancy at the low energy band still exists. The degradation in the detection efficiency of the ACIS below 1 keV has been recently reported (http://cxc.harvard.edu/cal/Links/Acis/acis/Cal_projects/index.html), then this deficiency of the soft X-ray flux in the Chandra data could be caused by this phenomena.
3.2 Energy Spectra of NGC 3311 and NGC 3309
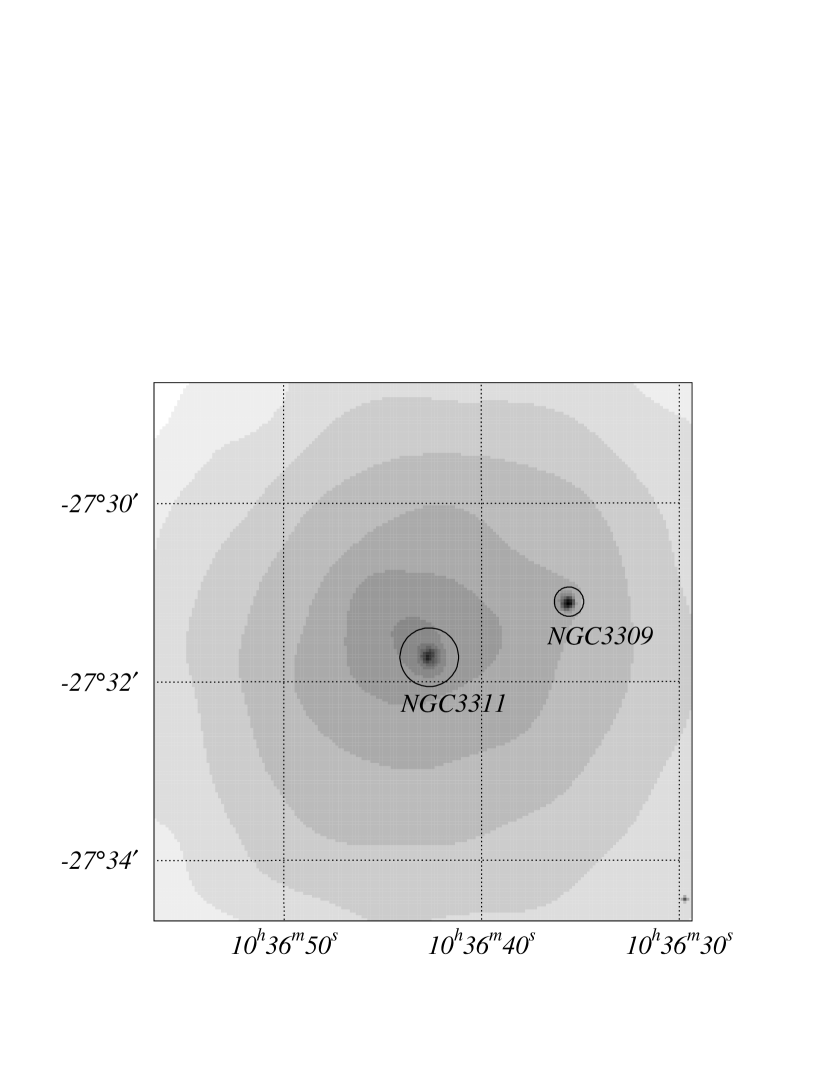
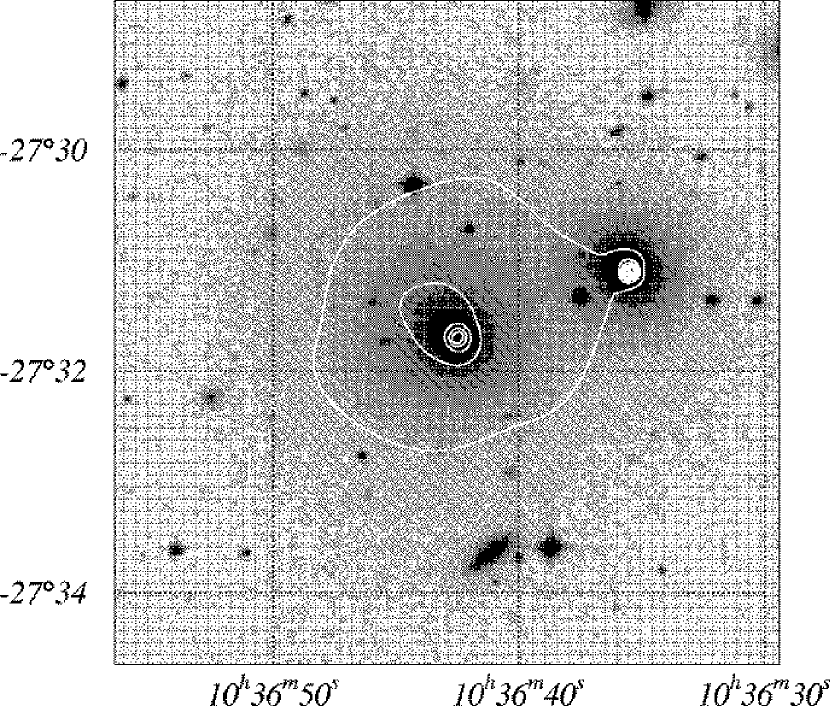
The X-ray image including the two central galaxies was compared with an optical image from Digitized Sky Survey (DSS) for the central region, as shown in Figure 3. The X-ray extents of the two galaxies NGC 3311 and NGC 3309 are much smaller than those in the optical band. This feature is quite similar to the recent results for the two galaxies in the Coma cluster (Vikhlinin et al., 2001). The detailed radial profiles will be analyzed in the next section.
In this section, energy spectra of the central two galaxies, NGC 3311 and NGC 3309, are examined. The X-ray data in circular regions with radii and centered on the respective galaxies were cut out, as indicated with solid circles in Figure 3. These radii correspond to for NGC 3311 and for NGC 3309, respectively (Västerberg et al., 1991). For the common background, we took data from a circular region with radius in the cluster center, excluding the two galaxies. The resultant background spectrum is the same as that already shown in Figure 2. Normalization of this background spectrum, which includes NXB and CXB, was then scaled to match the surface brightness of the ICM at the target positions based on the radial profile fits in the next section. Since the background spectrum is dominated by the ICM emission, the wrong scalings for the NXB and CXB intensitis cause an influence which is less than 1% of the total background flux. The background subtracted spectra of the two galaxies are shown in Figure 4.
Spectral fits were also carried out for the data of two galaxies with XSPEC v.10.0. As for the model spectra, the Mekal model was used for the ISM component and a zbrems model, representing a redshifted thermal bremsstrahlung emission, was applied for the LMXB component, respectively. The temperature of the zbrems model was fixed to keV, as an empirical approximation of the X-ray spectra of LMXBs (Makishima et al., 1989; Matsushita et al., 1994). The absorption and metal abundance in the Mekal model were not effectively constrained. We, therefore, fixed the absorption column to the Galactic value of 6 1020 cm-2 and the metal abundance to 0.5 solar, respectively. The resultant parameters of the spectral fits are listed in Table 2. The ISM temperatures are keV and keV for NGC 3311 and NGC 3309, respectively.
The sum of the ISM fluxes for the two galaxies is () 10-14 erg cm-2s-1, which is consistent with the previous upper limit for the cool component ( keV), 4 10-13 erg cm-2s-1, obtained by ASCA and PSPC (Tamura et al., 1996, 2000). When the metal abundance was varied between and 1.0 solar, the best-fit temperature varied only by 0.02 keV but the emission measure showed a change by a factor of about 2. This is because the emission measure goes almost inversely proportional to the metal abundance. The total luminosities for the sum of ISM and LMXBs in the energy range between 0.5 and 4.5 keV are 2.4 1040 erg s-1 and 1.6 1040 erg s-1 for NGC 3311 and NGC 3309, respectively. The LMXB emission accounts for 50% and 53% of the X-ray luminosities for the respective galaxies.
3.3 Radial profiles of NGC 3311 and NGC 3309
Radial profiles of the X-ray emission from the central two galaxies, NGC 3311 and NGC 3309, are examined in some detail. The profiles before background subtraction in the energy range 0.5 – 1.5 keV are shown in Figure 5 (a1) and (b1) within a radius of for NGC 3311 and NGC 3309, respectively. Västerberg et al. (1991) obtained the optical surface brightness profiles with a resolution of (FWHM). These optical profiles are well represented by de Vaucouleurs law for kpc (NGC 3311) and for kpc (NGC 3309), respectively. The isophotal radii are and , respectively. The dashed lines indicate the optical surface brightness profiles (Västerberg et al., 1991). The X-ray emission profiles are clearly sharper than those in the optical band. The X-ray profiles can be fitted with single models and a constant background. For the radial profile fittings, we use CERN library package (http://wwwinfo.cern.ch). Thick solid lines in Figures 5 (a1) and (b1) indicate the best-fit models, which give and for NGC 3311 and NGC 3309, respectively. The parameters of the profile fits are listed in the third and forth rows in Table 1, and the values for NGC 3311 are consistent with the previous joint fit including the ICM in section 3.1. Both galaxies indicate core radii of about or 1.3 kpc, which is a typical value for elliptical galaxies (Forman et al., 1985). The value () for NGC 3309 is, however, much larger than the average value of 0.5 obtained for nearby bright elliptical galaxies with Einstein (Forman et al., 1985), indicating that the emission of A1060 galaxies falls very sharply. We also tried to fit the profile for NGC 3309 with a cut-off model by fixing , but the fit turned out to be unacceptable with . These profile fits confirm that the X-ray emission from the two galaxies are compact and contained within a small radius of .
Panels in the second row in Figures 5 show hardness ratios (HRs), which are defined as intensity ratios between energy bands 1.5 – 5 keV and 0.5 – 1.5 keV. Since the background is not subtracted, the fluxes contain contribution from ISM, LMXB, ICM and NXB. The HR profile indicates that in the inner region (), the temperature is about 1 keV corresponding to the ISM emission and gradually increase to the outer region. The HR profiles show that the temperature reaches a constant value in the outer region at . The HR of the ICM as shown in the energy spectrum in Figure 2 is , which corresponds to about keV. We also note that the HR profiles of both galaxies show peaks at which are significant at the 95% confidence limit (more than level). This feature is most naturally explained in terms of the emission from LMXBs, which produce harder spectrum ( keV) than both ISM and ICM (Matsushita et al., 1994). Therefore, the HR profiles indicate that the dominant source of the X-ray emission shifts from ISM to LMXBs at , and then into ICM at .
Based on these results, we examined the radial profiles of the ISM component only. The surface brightness of the NXB and the ICM could be regarded as a constant in the galaxy scale as shown in the previous model fit. As for the LMXB emission, we assume that the spatial distribution follows the optical surface brightness profile (Västerberg et al., 1991) and their energy spectra is given by a bremsstrahlung emission of keV. This enables us to estimate the LMXB luminosity as a function of radius as shown by hatched curves in Figure 5 (a3) and (b3). We included the errors due to the flux of the LMXB emission, the temperature and the abundance of the ISM emission. After subtracting the contributions from LMXB, ICM and NXB in this manner, we can obtain the ISM profile as the remaining feature. We present the radial ISM profiles in the energy band 0.5 – 1.5 keV for NGC 3309 and NGC 3311 in Figure 5 (a3) and (b3), respectively.
The radial profiles in Figure 5 (a3) and (b3) clearly indicate that the sizes of the ISM emission are as small as kpc. If we fit the ISM profiles with a model, the obtained values are for NGC3311 and for NGC3309, respectively. The large value for NGC 3309 suggests that the ISM is not in a simple condition characterized by an isothermal gas under a hydrostatic equilibrium in a King shape gravitational potential. Based on these model fits, the central gas densities are estimated as 10-2 cm-3 for NGC 3311 and 10-1cm-3 for NGC 3309, respectively. Hardness ratios for the ISM components, defined by the ratio of the counts between 0.9 –1.5 keV and 0.5 – 0.9 keV bands, are also shown as a function of radius in (a4) and (b4). Within the error, the ISM temperatures are consistent to be constant with radius up to about for both NGC 3311 and NGC 3309. As we show later in the discussion, the LMXB luminosities in NGC 3311 and NGC 3309 are relatively higher than an X-ray faint galaxy NGC 4697 (Sarazin et al., 2001). But even if we reduce the LMXB luminosity to the half of the best-fit value , the change in the hardness ratios are less than 10 % or 0.05 keV. However, at the same time we cannot reject a model that the ISM temperature gradually goes up with radius from the central keV and reaches about 3 keV ( ICM value) at , because of the large error.
4 Discussion
The present Chandra observation of A1060 showed that the ICM temperature within from the center was consistent with the previous ASCA and ROSAT results, keV. The spectrum showed no temperature drop or additional cool component except for the ISM emission from the two elliptical galaxies. The surface brightness profile clearly indicated two components, i.e. the spatially narrow emission confined within the cD galaxy NGC3311 and the widespread ICM component, with the latter well approximated by a simple model with and core radius . Properties of the ICM distribution over the large scale will be studied in our next paper (see also Furusho et al. (2002)).
The X-ray emission from the ISM of two giant elliptical galaxies, NGC3309 and NGC3311, was clearly resolved for the first time. Their spatial extents are as small as , or less than . According to the recent X-ray classification of elliptical galaxies by Matsushita (2001), these sizes are very small even among the X-ray faint and compact class. This feature is very similar to the recent Chandra measurement of NGC 4874 and NGC 4889 in the Coma cluster (Vikhlinin et al., 2001). The X-ray sizes of these Coma galaxies are also unusually small, and the authors discuss that the ISM pressure is balanced with the ICM level with little sign of thermal conduction at the outer boundary of ISM.
Before looking into the origin of this compactness in the X-ray emission region, we first evaluate the luminosity and distribution of the LMXB component. Sarazin et al. (2001) studied X-ray to optical luminosity ratios of LMXBs in elliptical galaxies based on the data from Chandra and XMM. For an X-ray faint elliptical galaxy NGC 4697, they obtained erg s by taking the LMXB luminosity in the energy range 0.3-10 keV. For NGC 3311 and NGC 3309, the same ratios for the entire emission region are higher at 2.9 1030 and 1.3 1030erg s, respectively. The reason why A1060 galaxies indicate higher for LMXBs can be considered in the following way. First, since Sarazin et al. (2001) summed up the fluxes of only detected sources, the faint LMXBs with fluxes less than the detection limit were not included. Second, there may be some influence from nuclear radio sources for NGC 3311 and NGC 3309. Lindblad et al. (1985) reported a weak radio source in NGC 3311 and a radio jet from NGC 3309, whose equipartition energy was 5 1053 erg s-1. In the X-ray data, we cannot exclude possible presence of low-luminosity AGNs with erg s-1 in the center of these galaxies. Thirdly, the possible star-formation activity in NGC 3311 would yield a high LMXB density. The emission line spectrum from NGC 3311 suggests presence of H II regions (Västerberg et al., 1991), and the metal abundance in globular clusters in NGC 3311 is extremely high (Secker et al., 1995) implying a young star population. Recent HST observation, however, obtained normal globular cluster colors and metallicities (Brodie et al., 2000), which has made the high metallicity of NGC 3311 rather uncertain.
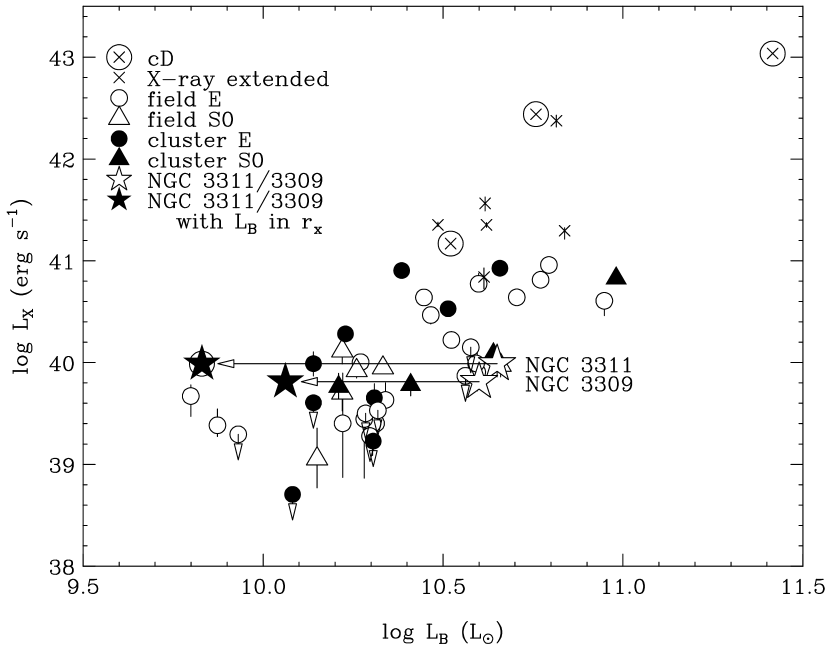
Matsushita (2001) derived relation for the ISM of 27 galaxies. In Figure 6, we reproduced Figure 4 of Matsushita (2001) and plotted the data of NGC 3311 and NGC 3309. If we take the optical luminosity for the whole galaxy, the two galaxies, shown with open pentagrams, indicate slightly lower values than other X-ray compact early-type galaxies. The X-ray integration radii used in the spectral fits correspond to for NGC 3311 and for NGC 3309, respectively. Fractions of the optical luminosity encircled by these radii are 15.0% and 28.6% for the respective galaxies. If optical luminosities only in these regions are taken, ratios become higher by a factor of 4–6 as shown with filled pentagrams in Figure 6. These ratios are higher than most of other galaxies. The spatial extents of the hot ISM in NGC 3311 and NGC 3309 are certainly smaller than those of stars, nevertheless the X-ray luminosities satisfy the average relation. We note that the X-ray luminosities derived in this paper could be underestimated by a factor of about two at maximum due to the uncertainity of the quantum efficincy of the ACIS at the low energy band. However, the tendency described here is not affected. A possible explanation would be that, even though a substantial fraction of the ISM is stripped off, the remaining gas is confined in the galaxy by the external pressure of the ICM. In Figure 7, we plotted radial profiles of the ISM density (cm-3) and the pressure (keV cm-3), compared with the ICM pressure (Tamura et al., 1996). Clearly, the pressure balance between the ISM and the ICM is reached just around the outer boundaries of X-ray emission: 2.8 kpc and 1.7 kpc for NGC 3311 and NGC 3309, respectively.
As for the supply of the ISM matter, the total mass of the ISM is estimated to be 5.6 107 for NGC 3311 and 1.1 107 for NGC 3309, respectively. Under a typical stellar mass loss rate of yr (Faber & Gallagher, 1976), the ISM can be accumulated in 2.7 108 yr and 9.3 107 yr for the two galaxies. The radiative cooling times, , are 5.9 108 yr for NGC 3311 and 1.4 108 yr for NGC 3309. Therefore, the stellar mass loss, together with the input from supernova, can compensate the radiative energy loss. However, if thermal evaporation works at the rate of the classical estimation by Cowie & McKee (1977), the ISM would be completely lost in only a few times yrs. The presence of the X-ray halo shows this is not the case. In spite of the large radial velocity of NGC 3309, higher than the cluster average by km s-1, its X-ray image is circularly symmetric and the center position is consistent with the optical center within the Chandra’s pointing accuracy. This feature also suggests that evaporation or stripping of the ISM is not an ongoing process now.
Vikhlinin et al. (2001) discuss the thermal balance between radiative cooling and thermal conduction from the surrounding ICM, based on the Chandra data for the Coma galaxies. The ISM temperature of NGC 4889 ( keV) was too high compared with the gravitational potential of the galaxy, and a positive temperature gradient was observed in NGC 4874. These features suggested the importance of heat input from the surrounding ICM. In the A1060 galaxies, the conductive heat flux from the ICM would be smaller because of much lower ICM temperature ( keV compared with keV in the Coma cluster). The temperature gradient is not clearly recognized in the ISM, although the poor statistics allow some temperature increase with radius. The ISM temperature can also be evaluated from the relation (Matsushita, 2001). The velocity dispersions are 187 km s-1 for NGC 3311 and 236 km s-1 for NGC 3309 (Pruginiel & Simien, 1996), respectively, leading to values of 0.252 and 0.453. Since typical values within are 0.5–1 (Matsushita, 2001; Matsumoto et al., 1997), the ISM in NGC 3311 and NGC 3309 is hotter than the kinetic temperature of the stars. Since heat conduction at the outer edge of the ISM is likely to be suppressed from the evaporation argument, the high temperatures in the A1060 galaxies would be the result of adiabatic compression of the ISM in the cluster.
Now, let us consider about the dynamical state of the ISM in NGC 3311 and NGC 3309. As shown above, even though the radiative cooling times of several times 108 years are short, inputs from stellar mass loss and Type-1a supernova can maintain the present amount of the ISM. The low values suggest that the hot ISM have sufficient energy to escape from the galaxy potential, even though there is no morphological sign of galactic winds. A slow evaporation of the ISM due to the suppressed conductive heat input from the ICM may be the actual process going on. Regarding the large scatter of the ratios, models incorporating partial winds have been recently developed (e.g. Pellegrini & Ciotti 1998). According to the model, the change of stagnation radius between the outflowing outer region and the inflowing inner region controls the X-ray luminosity. However, these models consider isolated systems and the effect of external pressure needs to be further studied.
The Chandra observation of the central region of A1060 has confirmed that the cluster is indeed the archetype isothermal cluster under hydrostatic equilibrium. When the ISM emission is subtracted, the ICM emission is shown to be very isothermal with no sign of cool component, even though the systematic uncertainty in the soft band response hampers us to set a meaningful upper limit. The X-ray size of the “cD” galaxy NGC 3311 is very compact with no extended potential structure, which has been commonly seen in X-ray bright elliptical galaxies (Matsushita, 2001). Morphological study of a large sample of PSPC images, on the other hand, showed that the cooling flow clusters tend to indicate more circularly symmetric shapes than the systems accompanied by radio halos and relics (Schuecker et al., 2001). In this respect, A1060 seems to be standing at a subtle location in the evolution process. Numerical simulations suggest that cooling flows can be disrupted by major mergers (McGlynn & Fabian, 1984) and a highly inhomogeneous temperature distribution should remain for about 2 Gyr (Roettiger et al., 1997). A possible interpretation for A1060 is that a sufficiently long time ( Gyr) has passed from the last major merger, which has stirred the central ICM, so that good isothermality and hydrostatic equilibrium was reached. However, the elapsed time is not long enough to assemble the matter and to establish a hierarchical potential structure dominated by the cD galaxy. This picture is also consistent with the observed uniform distribution of metals in the A1060 ICM (Tamura et al., 2000; Ohashi et al., 2000).
5 Conclusion
Chandra observation of the central region of the relaxed cluster of galaxies, A1060, confirmed that the temperature of the ICM was almost constant from outside to the inner 20 kpc region. The X-ray emission from the ISM of the two giant elliptical galaxies, NGC 3311 and NGC 3309, were clearly resolved. X-ray properties of the two galaxies are very similar and the ISM morphologies do not show a stripping feature even though the velocity difference between the two galaxies is km s-1. The ISM temperatures are constant at 0.7–0.9 keV, and the X-ray to optical luminosity ratios for the sum of the ISM and LMXB components are within the scatter for other galaxies. The spatial extents of the ISM emission are, however, as small as kpc for both galaxies, and the pressure balance between the ISM and the ICM is achieved at the ISM boundaries. We discuss, based on these results, that the ISM is mainly supplied from stellar mass loss and is confined by the external pressure of ICM, with highly suppressed heat conduction. The ICM in the central region of A1060 is relaxed, and the extended potential structure around the cD galaxies has not grown up yet, possibly due to gas mixing in past merger episodes.
References
- Anders & Grevesse (1989) Anders, E., & Grevesse, N. 1989, Geochim. Cosmochim. Acta, 53, 197
- Brodie et al. (2000) Brodie, J.P., Larsen S.S., Kissler-Patig, M., 2000, ApJL, 543, L19
- Canizares et al. (1987) Canizares, C.R.,Fabbiano, G., Trinchieri G., 1987, ApJ, 312, 503
- Cowie & McKee (1977) Cowie, L.L., & McKee, C.F., 1977, ApJ, 211, 135
- Ezawa et al. (2001) Ezawa, H., Yamasaki, N.Y., Ohashi, T., Fukazawa, Y., Hirayama, M., Honda, H., Kamae, T., Kikuchi, K., Shibata, R., PASJ, 2001, 53, 595
- de Vaucouleurs et al. (1991) de Vaucouleurs, G., de Vaucouleurs A., Corwin H.G., Jr, 1991, Third Reference Catalogue of Bright Galaxies. Springer-Verlag, New York
- Faber & Gallagher (1976) Faber, S. & Gallagher, J., 1976, ApJ, 204, 365
- Forman et al. (1985) Forman, W., Jones, C., Tucker W., 1985, ApJ, 293, 102
- Furusho et al. (2001) Furusho, T., Yamasaki, N. Y., Ohashi, T., Shibata, R., & Ezawa, H., 2001, ApJ, 561, L165
- Furusho et al. (2002) Furusho, T., Yamasaki, N. Y., & Ohashi, T., 2002, “New Visions of the X-ray Universe in the XMM-Newton and Chandra Era”, ESTEC (astro-ph/0203244)
- Ikebe et al. (1996) Ikebe, Y., et al. 1996, Nature, 379, 427
- Ikebe et al. (1999) Ikebe, Y., Makishima, K., Fukazawa, Y., Tamura, T., Xu, H., Ohashi, T., Matsushita, K., 1999, ApJ, 525, 581
- Jerius et al. (2000) Jerius, D., Donnelly, R.H¿, Tibbetts, M.S.,Edgar, R.J., gaetz, T.J., Schwartz, D.A.,Van Speybroeck, L.P., Zhao, P., 2000, Proc., SPIE, 4012,17
- Kaastra et al. (2001) Kaastra, J.S., Ferrigno, C., Tamura, T., Paerels, F.B.S., Peterson, J.R., and Mittaz, J.P.D. 2001, A&A 365, L99
- Lindblad et al. (1985) Lindblad, P.O., Jörsäter, S., Sandqvist, Aa., 1985, A&A, 144, 496
- Makishima et al. (1989) Makishima, K., Ohashi, T.,Hayashida, K., Inoue, H., Koyama, K., Takano, S., Tanaka, Y., Yoshida, A., Turner, M.J.L., Thomas, H.D., Stewart, G.C., Williamsn R.O., Awaki, H., Tawara, Y., 1989, PASJ, 41, 697
- Matsumoto et al. (1997) Matsumoto, H., et al. 1997, ApJ, 482, 133
- Matsushita et al. (1994) Matsushita, K., et al. 1994, ApJL, 436, L41
- Matsushita et al. (1998) Matsushita, K., Makishima, K., Ikebe, Y., Rokutanda, E., Yamasaki, N., Ohashi, T., 1998, ApJL, 499, L13
- Matsushita (2001) Matsushita, K., 2001, ApJ, 547, 693
- McGlynn & Fabian (1984) McGlynn, T.A., Fabian, A.C., 1984, MNRAS, 208, 709
- Molendi & Fabio (2001) Molendi, S. & Fabio, P., 2001, ApJ, 560,194
- Ohashi et al. (2000) Ohashi, T., Furusho, T., Yamasaki, N. Y., & Shibata, R., 2001, ASP Conference Series, 251, 146
- Paolillo et al. (2002) Paolillo, M., Fabbiano, G.,Peres,G., & Kim, D-W, 2002, ApJ, 565, 883
- Pellegrini & Ciotti (1998) Pellegrini, S. & Ciotti, L., 1998, A&A, 333,433
- Peterson et al. (2001) Peterson, J.R., Paerels, F.B.S., Kaastra, J.S., Arnaud, M., Reiprich, T.H., Fabian, A.C., Mushotzky, R.F., Jernigan, J.G., & Sakelliou, I. 2001, A&A 365, L104
- Pruginiel & Simien (1996) Prugniel, P., Simien, F., 1996, A&A, 309, 749
- Roettiger et al. (1997) Roettiger, K., Loken, C., Burns, J.O., 1997, ApJS, 109,307
- Sarazin et al. (2001) Sarazin, A.L., Irwin, J.A., Bregman, J., 2001, ApJ, 556, 533
- Sasaki & Yamasaki (2002) Sasaki,S., & Yamasaki, N.Y., 2002, PASJ, 54 in press
- Secker et al. (1995) Secker, J., Geisler, D., McLaughlin, D., E., Harris, W.E., 1996, AJ, 109, 1019
- Schuecker et al. (2001) Schuecker, P., Böhringer, H., Reiprich, T.H., Feretti, L., 2001, A&A, 378, 408
- Tamura et al. (1996) Tamura, T., Day, C.S., Fukazawa, Y., Hatsukade, I., Ikebe, Y., Makishima, K., Mushotzky, R.F., Ohashi, T., Takenaka, K., and Yamashita, K., 1996, PASJ, 48, 671
- Tamura et al. (2000) Tamura, T., Makishima, K., Fukazawa, Y., Ikebe, Y., , Zu, H., 2000, ApJ 535, 602
- Tamura et al. (2001) Tamura, T., Kaastra, J.S., Peterson, J.R., Paerels, F.B.S., Mittaz, J.P.D., Trudolyubov S.P., Stewart, G., Fabian, A.C., Mushotzky, R.F., Lumb, D.H., and Ikebe, Y. 2001, A&A 365, L87
- Västerberg et al. (1991) Västerberg, A.R., Jörsäter, S., Lindblad P.O., 1991, A& A, 247, 335
- Vikhlinin et al. (2001) Vikhlinin, A., Markevitch, M., Forman, W., Jones, C., 2001, ApJL, 555, L87
- Weisskopf et al. (2000) Weisskopf, M., Tananbaum, H., Van Speybroeck, L., & O’Dell,S., 2000, Proc. SPIE, 4012, 2
- White & Sarazin (1991) White III, R.E., & Sarazin C.L., 1991, ApJ, 367, 476


| object | fit radiusaaarcsec | core radiusaaarcsec | normalizationbb10-4 c arcsec-2 cm-2 | backgroundbb10-4 c arcsec-2 cm-2 | /dof | |
|---|---|---|---|---|---|---|
| ICMccBased on a double- fit assuming the ICM and NGC 3311 emission together | 294 | 0.36 | 100.9 | 10.20.37 | 69.8/58 | |
| NGC 3311ccBased on a double- fit assuming the ICM and NGC 3311 emission together | 0.71 | 3.95 | 97.5 | |||
| NGC 3311 | 49 | 0.67 | 3.79 | 95.4 | 9.34 | 96.9/96 |
| NGC 3309 | 49 | 1.08 | 3.73 | 220.6 | 6.810.25 | 95.6/96 |
Note. — The energy range is between 0.5 and 1.5 keV. Errors denote the 90% confidence limits for a single parameter.
| object | (keV) | (ISM)aaFlux unit: 10-14 erg cm-2s-1 between 0.5 and 4.5 keV | (LMXB)aaFlux unit: 10-14 erg cm-2s-1 between 0.5 and 4.5 keV | /dof |
|---|---|---|---|---|
| NGC3311 | 0.87 | 3.9(2.9-5.6) | 4.5(3.1-7.2) | 23.2/25 |
| NGC3309 | 0.77 | 2.6(2.2-3.7) | 3.7(1.9-4.2) | 44.7/35 |
Note. — Errors denote the 90% confidence limits for a single-parameter. The fitting model is wabs(mekal+zbrems), in which fixed parameters are the column density at the Galactic value of 61020cm-2, the redshift , the abundance at 0.5 solar, and the temperature of zbrems at keV.