Cold Fronts in CDM Clusters
Abstract
Recently, high-resolution Chandra observations revealed the existence of very sharp features in the X-ray surface brightness and temperature maps of several clusters (Vikhlinin et al., 2001). These features, called “cold fronts”, are characterized by an increase in surface brightness by a factor over 10-50 kpc, accompanied by a drop in temperature of a similar magnitude. The existence of such sharp gradients can be used to put interesting constraints on the physics of the intracluster medium (ICM), if their mechanism and longevity are well understood. Here, we present results of a search for cold fronts in high-resolution simulations of galaxy clusters in cold dark matter (CDM) models. We show that sharp gradients with properties similar to those of observed cold fronts naturally arise in cluster mergers when the shocks heat gas surrounding the merging sub-cluster, while its dense core remains relatively cold. The compression induced by supersonic motions and shock heating during the merger enhance the amplitude of gas density and temperature gradients across the front. Our results indicate that cold fronts are non-equilibrium transient phenomena and can be observed for a period of less than a billion years. We show that the velocity and density fields of gas surrounding the cold front can be very irregular which would complicate analyses aiming to put constraints on the physical conditions of the intracluster medium in the vicinity of the front.
Subject headings:
cosmology: theory – intergalactic medium – methods: numerical – galaxies: clusters: general – instabilities–turbulence–X-rays: galaxies: clusters1. Introduction
Recently, high-resolution Chandra observations revealed the existence of very sharp features in the X-ray surface brightness and temperature maps of several clusters, including A2142 (Markevitch et al., 2000) and A3667 (Vikhlinin et al., 2001). The sharp gradients in the X–ray surface brightness were first found in the ROSAT images of A2142 and A3667 along with signatures of substructures (i.e., several small groups and merging components embedded in a larger cluster). Due to lack of spatially resolved temperature maps, these features were initially interpreted as shock fronts arising during cluster mergers (Markevitch et al., 1999). This interpretation turned out to be incorrect when detailed X–ray surface brightness and temperature maps were obtained with the Chandra satellite. The maps showed that the increase in gas density and X–ray surface brightness by a factor of across the sharp features is accompanied by a decrease in temperature of gas of a similar magnitude, the behavior opposite to that expected across shock fronts. These sharp features were therefore named “cold fronts”. Markevitch et al. (2000) and Vikhlinin et al. (2001) interpreted these fronts as a boundary of “the dense subcluster core that has survived a merger and ram pressure stripping by the surrounding shock-heated gas.”
The existence of the sharp temperature gradients can be used to put interesting constraints on the conditions in the intracluster medium (ICM) in the vicinity of the front. In particular, the width of the observed front ( kpc) is several times smaller than the Coulomb mean free path for electrons in the ICM. This indicates that the thermal conduction must be suppressed, at least across the front. In the case of A2142, Ettori & Fabian (2000) find that the thermal conductivity has to be reduced by several orders of magnitude from the classical Spitzer value near the front. The observed extent, kpc, of the sharp boundary may also indicate that the Kelvin-Helmholtz instabilities are partially suppressed, most likely by magnetic fields parallel to the boundary. The instabilities, expected to arise on the boundary if the hot gas flows along the front, would disrupt and widen the boundary. Using a simple dynamical model that approximates the gas cloud as a dense spherical cloud, Vikhlinin et al. (2001) find that the magnetic field of 7-16G parallel to the front must be present at the boundary to maintain its stability. The detailed studies of cold fronts can, thus, provide new detailed insights into the physics of the ICM, including the efficiency of energy transport and the magnetic field strength in the ICM. The reliability of such models, however, depends on understanding the dynamics of gas motions during cluster mergers and, especially, in the vicinity of the cold fronts. The constraints on the transport mechanisms require also that we understand how long the cold fronts can survive dynamically.
In this paper we present results of the search and analysis of features similar to the observed cold fronts in very high-resolution cosmological N-bodygasdynamics simulations of clusters forming in Cold Dark Matter (CDM) models. The main goals of this paper are 1) to test the interpretation of the cold fronts as boundaries between hot shock-heated gas and dense cold gas of the merging sub-clump; 2) identify the situations and mechanisms that can produce cold fronts and 3) analyze the dynamics and density fields of gas and dark matter in the vicinity of the front.
Although numerous extensive theoretical analyses of cluster mergers have been done in the past, the typical spatial resolution in studies of cluster formation in the full cosmological context is too low to match the superb spatial resolution of the Chandra images. Eulerian gasdynamics codes based on the modern high-resolution shock capturing techniques are capable of resolving sharp density and temperature gradients of arbitrary amplitude within grid cells and are thus well suited for studies of shocks and cold fronts in cluster mergers. However, high-dynamic range required in self-consistent simulations of cluster formation limited use of the Eulerian codes to controlled merger experiments (e.g., Roettiger et al., 1997; Quilis et al., 1998; Ricker & Sarazin, 2001). The results of these simulations were widely used for physical interpretation of the new high-resolution X–ray observations of merging clusters. More recently, the advent of cosmological codes using the adaptive mesh refinement (AMR) (e.g., Bryan & Norman, 1997; Kravtsov et al., 2002; Teyssier, 2002) allowed to achieve the dynamic range of with Eulerian gasdynamics algorithms, thus making possible high-resolution self-consistent cluster simulations in a realistic cosmological setting. As we will show below, these simulations can resolve sharp gradients in density and temperature fields of the ICM on scales of kpc, approaching the typical resolution of Chandra images.
The paper is organized as follows. In 2, we discuss the cluster simulations used in our analysis. In 3, we discuss and illustrate the detailed structural evolution of the cluster gas and surrounding filaments during cluster mergers and accretion of matter. In § 4 we present cold fronts identified in numerical simulations and discuss their origin, structure, dynamical properties, and detectability. We discuss our results and summarize our conclusions in § 5.
2. Numerical simulations
In this study, we analyze the high-resolution cluster simulations performed using the Adaptive Refinement Tree (ART) -bodygasdynamics code (Kravtsov, 1999; Kravtsov et al., 2002). ART is an Eulerian code designed to achieve high spatial resolution by adaptively refining regions of interest, such as high-density regions or regions of steep gradients in gas properties, and has good shock-capturing characteristics. The code can capture discontinuities in gas properties within grid cells, which makes it well-suited for studying sharp features such as shock and cold fronts. At the same time, the adaptive refinement in space and (non-adaptive) refinement in mass (Klypin et al., 2001) allows us to reach the high dynamic range required for high-resolution self-consistent simulations of cluster evolution in a cosmological setting.
We note that the effects of magnetic fields, gas cooling, stellar feedback, and thermal conduction are not included in these simulations. This is the first theoretical study of cold fronts and it is therefore interesting to see whether these features can be produced in the case of purely adiabatic gasdynamics. As we show below, cold fronts arise at the interfaces between relative low density hot medium and dense cold gas of merging clumps. These regions should not be significantly affected by gas cooling, which is expected to have the largest effect in cluster cores. The absence of thermal conduction is acceptable because our primary goal is to study the dynamical origin of cold fronts, rather than their precise properties. The very existence of cold fronts indicates that thermal conduction is suppressed in their vicinity. Other theoretical arguments (e.g., Loeb, 2002) constrain the thermal conduction coefficient to be significantly smaller than the classical Spitzer value over most of the ICM, except perhaps in the cluster cores (Voigt et al., 2002). Our simulations, in fact, implicitly assume that the Coulomb mean free path is smaller than the size of computational cells (this is one of the main assumption of gasdynamics), and hence there is no thermal conduction.
We analyze simulations of two clusters of intermediate mass in the CDM and standard CDM models. The first (CDM) cluster was simulated in the “concordance” flat CDM model: , , and , where the Hubble constant is defined as , and is the power spectrum normalization on Mpc scale. The simulation used 1283 uniform grid and 7 levels of mesh refinement in the computational box of Mpc, which corresponds to the dynamic range of and peak resolution of . Only the region of Mpc around the cluster was adaptively refined, the rest of the volume was followed on the uniform grid. Similarly, the simulation used initial conditions sampled with different particle masses (see Klypin et al., 2001). The mass resolution (dark matter particle mass) in the region around the cluster was , while other regions were simulated with lower mass resolution (the total of three particle species, different in mass by a factor of eight, were used). The region of the cluster was selected for re-simulation at higher resolution from a lower resolution -body run.
The second (SCDM) cluster is simulated from the initial conditions used in the “Santa Barbara cluster comparison project” (Frenk et al., 1999). The cosmological parameters assumed were those of the standard CDM cosmology: , , and . The simulation used 1283 uniform grid and 6 levels of refinement, which corresponds to the peak resolution of kpc in the Mpc computational box. Here, again we used a resampling technique to set up the initial conditions for multiple particle species. The lowest particle mass is and corresponds to effective number of particles. The Lagrangian region corresponding to the spherical volume of the radius , where is the virial radius of the cluster at , was simulated with the highest mass resolution and was adaptively refined. The SCDM cluster simulation was previously used to compare performance of the ART code to other existing cosmological gasdynamics codes in a realistic cosmological setting (Kravtsov et al., 2002), where good agreement was found in both cluster properties and its radial profiles.
The SCDM and CDM clusters had virial masses of and and virial radii of Mpc and Mpc, respectively. Here subscripts indicate the cosmology-dependent virial overdensity with respect to the mean density of the universe. Both clusters were therefore simulated with about one million dark matter particles within the virial radius. In addition to cells of the uniform grid, approximately mesh cells were generated in the process of adaptive refinement in the regions surrounding clusters. The simulations were thus designed to concentrate the bulk of the computational effort on the individual clusters, which allowed the simulations to reach the high dynamic range critical for this study. The spatial resolution of these simulations allows us to resolve sharp gradients over scales within the virial radius of clusters. This is comparable to, albeit still somewhat worse than, the superb angular resolution of the Chandra satellite.
3. Cluster Evolution
Let us start the discussion of cold fronts with a general description of cluster evolution. Figure 1 shows maps of projected gas density (top) and entropy (defines as , bottom) of the simulated CDM cluster at four different redshifts in a kpc slice centered on the central gas density peak. The maps are color-coded on a scale in units of cm2 (density) and keV cm2 (entropy). The size of the region shown is 8Mpc (10% of the entire simulation volume). The figure illustrates complex dynamical processes accompanying cluster formation: accretion of clumps and diffuse gas along filaments, strong accretion and virial shocks both around cluster and surrounding filaments, weaker merger shocks within the virial shock of the cluster, and the complicated flow pattern of the ICM gas revealed by the entropy map.
The evolution of intergalactic gas is driven by accretion and mergers between clumps. Between and , the main cluster undergoes a nearly equal mass merger. Such mergers are spectacular events involving the kinetic energy as large as ergs, the most energetic events since the Big Bang. More common are smaller mergers and accretion of groups along large-scale filaments. At , highly supersonic accretion (Mach numbers of ) of pristine gas from low-density regions leads to formation of strong shocks located roughly at the virial radii of the two merging proto-clusters. Note that shocks of similar strength also surround the filament along which these clusters move. Note also that virial shocks do not penetrate into the filament itself and it is in fact difficult to separate the virial shocks of clusters from the accretion shocks around the filament.
During the evolution from to , as the mass of the main cluster grows, the radius and entropy gradient of the virial shocks steadily increase. Similar increases can be observed for the accretion shocks around the filament. However, even at the present epoch the gas flowing along the filament reaches the central regions of cluster without passing through a strong virial shock. This is clearly illustrated in the entropy maps in which relatively low-entropy gas flowing along the filament can be traced all the way to the central of the cluster. The virial shocks instead propagate along directions of the steepest pressure gradient into the low-density voids. The flow of filamentary gas, with entropy already increased by the accretion shocks (temperature of several million degrees K), has considerably smaller Mach numbers (typically ). Its motion is therefore slightly supersonic at best, compared to the highly supersonic motion of the yet unshocked gas flowing from voids. When this gas reaches the cluster core it accelerates and generates random, weak shocks in which it dissipates its kinetic energy. The flows from different filaments and directions result in a complicated flow patterns. We will discuss these motions in relation to the cold fronts below (see also Figure 5).
4. Cold fronts
The main question we want to answer in this study is whether cosmological simulations of galaxy clusters forming in hierarchical models can produce features similar to the “cold fronts” observed by the Chandra satellite. If so, simulations can then be used to shed light on the origin and properties of these features. In this section, we analyze the high-resolution cluster simulations described above to search for sharp gradients in temperature and density structure of clusters.
4.1. X-ray surface brightness and temperature maps
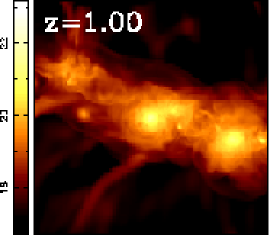
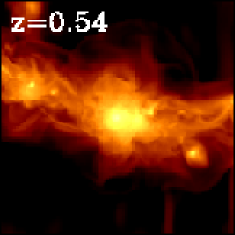
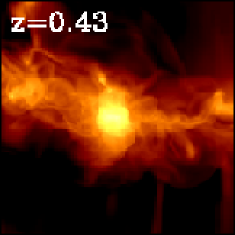
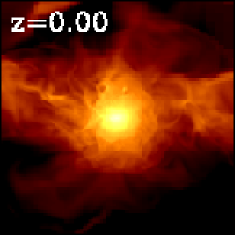
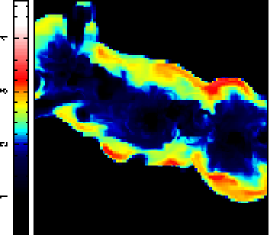
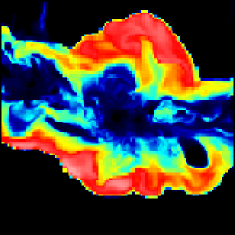
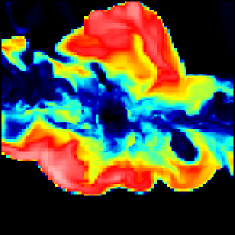
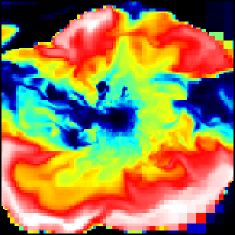
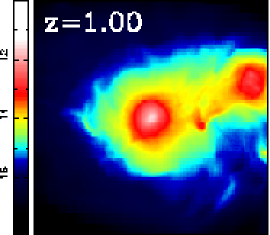
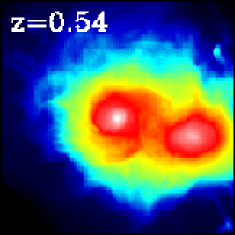
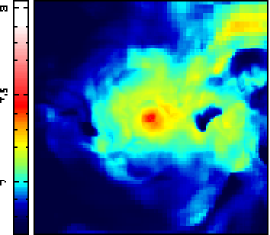
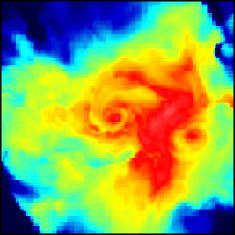
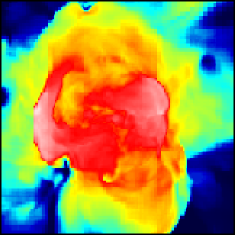
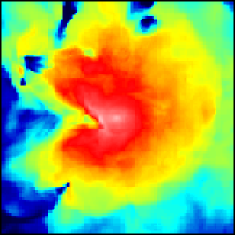
To perform the search and analysis of cold fronts, we generate the X-ray surface brightness and emission-weighted temperature maps of the simulated clusters. The maps were generated from uniform density and temperature grids centered on the minimum of cluster potential. The density and temperature grids, in turn, were constructed using interpolation from the original mesh refinement structure. The X-ray emissivity of gas cells was calculated in the 0.5-2 keV energy band using the Raymond & Smith (1977) plasma emission model and assuming a uniform metallicity of 0.3 solar. Figure 2 shows the X-ray surface brightness (top) and emission-weighted temperature (bottom) maps of the simulated CDM cluster at four different redshifts. The maps are color-coded on a scale in units of erg s-1 cm-2 arcmin-2 (surface brightness) and keV (temperature). The region shown in the figure is 2 Mpc; the pixel size is . The size of the pixels were chosen to be similar to the effective resolution of the simulation within the cluster.
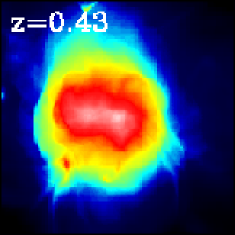
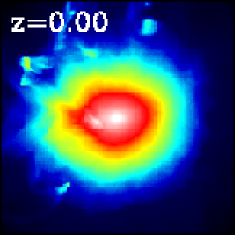
These maps show that complex density and temperature structure of the intracluster gas, illustrated by the thin density and entropy slices in Figure 1, is present in the observables averaged over the line-of-sight. At , two clusters are approaching each other along a massive filament. These clusters undergo a nearly equal-mass, slightly off-axis merger at . Compression of gas between two merging clumps significantly enhances the temperature in the large band visible in panel. By , the clusters have passed each other once and their supersonic motion results in two large-scale bow shocks propagating in opposite directions along the merger axis. These rather strong shocks are clearly seen in the temperature map of epoch as regions of enhanced temperature with very sharp boundaries. At , the cluster formed by the merger is relatively relaxed but continues to accrete matter and undergo minor mergers (note a small merging sub-clump to the left of the cluster center).
4.2. Origin, properties and detectability
The maps in Figure 2 show that a variety of very sharp features in temperature and surface brightness arises during minor and, especially, major mergers. Some of these features, indeed, exhibit properties qualitatively similar to the observed cold fronts. Below, we present two cases of cold fronts found in the CDM simulations.
4.2.1 Large-scale cold front during a major merger
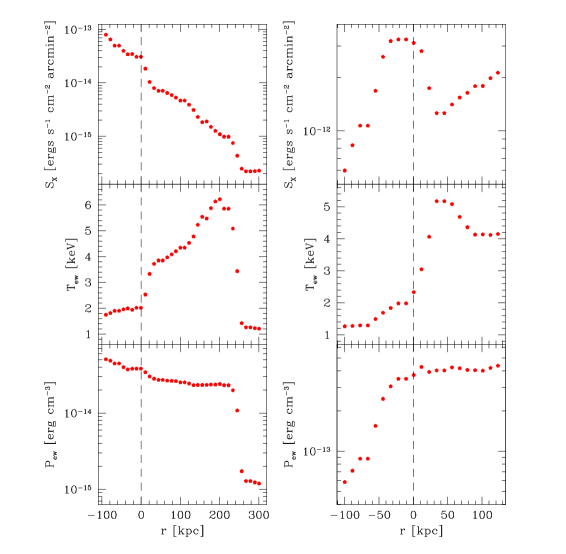
A spectacular cold front arises in a major merger of the CDM cluster at . This cold front is a low temperature region embedded in the high temperature gas just behind the left bow shock in the panel of Fig. 2. The colder gas belongs to one of the merging clusters. The dark matter halo of this cluster is in the process of disruption and the cluster gas appears to be “sloshed out” of its potential well (see Fig. 5). Rapid motion of the gas inside the freshly shocked gas then results in a sharp boundary between cold unshocked gas of the cluster and the hot shocked surrounding gas. The left panels of Figure 3 show the X-ray surface brightness (top), emission-weighted temperature (middle) and emission-weighted pressure (bottom) profiles across this temperature gradient in the maps. The profiles were constructed by drawing a straight line across the front and selecting values of map pixels nearest to the line in equally spaced intervals. The distance in kpc is measured relative to the sharp temperature gradient indicated by the dashed line. The profiles show that a drop of temperature over the scale of is accompanied by a jump in surface brightness by a factor of , the behavior is very similar to the profiles of observed cold fronts. Despite jumps in gas density and temperature, pressure changes relatively smoothly across this boundary. The smooth change of pressure was also deduced for observed cold fronts. Note that the profiles show the presence of a bow shock kpc from the cold front. A similar bow shock was also observed in A3667 ahead of the cold front, although its detection was marginal.
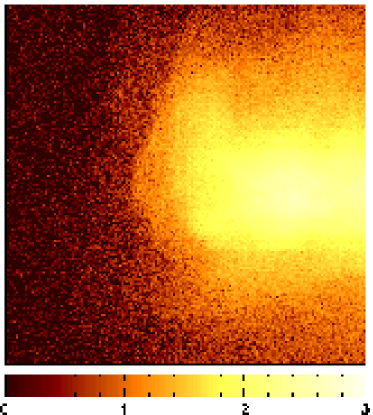
The overall structure of the front also exhibits qualitatively similar behavior to those observed in A3667 (Vikhlinin et al., 2001). To illustrate its appearance in a realistic observations, we constructed the mock photon count Chandra X–ray map of the region around the simulated cold front. The map is shown in Figure 4. We assumed a 50 ksec exposure in the keV band, cluster redshift of , and a flat background level of cnts s-1 pixel-1. The figure shows the full ACIS-I field of view binned to pixels. The color represents photon counts per pixel in log10 scale. The figure shows that the cold front is detectable by Chandra and appears remarkably sharp in the photon count map. The boundary of the front spans , comparable to the size of the observed cold front in A3667. At larger angles, the sharp discontinuity widens and then gradually disappears, the onset of Kelvin-Helmholtz instability also seen in A3667; however, the appearance of the simulated cold front seems to be more irregular than that of the observed front (see also Fig. 5 and 5 for more discussions).
To examine the processes that produce and then destroy this cold front, we created a movie of the temperature, density, and X-ray surface brightness evolution similar to the maps in Figure 2. The movie is based on 142 outputs finely spaced between and 0.26. Examination of the evolution showed that the large-scale cold front arises when a merging dense subclump is moving through hotter ambient intergalactic gas of the merging system. The hotter temperatures are due to the merger shocks111Bialek et al. (2002) pointed out that the gas sloshed out of its potential well can expand and adiabatically cool, which would also enhance the temperature difference between clump’s and ambient gas.. The shocks are driven by supersonic motions of the merging clusters and thus propagate away from them (the situation is similar to that of a supersonically moving piston in a gas tube). The shocks appear to originate as cluster pass each other for the first time when their velocity is greatest. The clumps thus trail the bow shocks they produce and the cold gas of clusters is not actually shocked until much later when the cold front is disrupted. Two additional weaker bow shocks are produced when the clusters pass each other for the second time. These secondary shocks play a role in heating the cold gas and disrupting the front. As the cold front observed in the temperature map is located at the large distance from the cluster center the front exists approximately for a time it takes for its sub-cluster to travel back to the center and merge plus the time required for the secondary shock to propagate from the center to the front. This is roughly equal to the dynamical time of the cluster ( years). Kelvin-Helmholtz instability and merger-induced turbulence also appear to contribute to eventual disruption of the front. Based on this estimate, the frequency of large cold fronts should be somewhat smaller than the frequency of major mergers in progress because the cold front may appear only in certain projections (projection direction perpendicular to the plane of the merger). Cold fronts thus appear to be a common dynamic phenomenon accompanying merger events during cluster formation.
4.2.2 Small-scale Cold front from Minor merger
Examining outputs of the simulations, we find that large-scale sharp gradients of gas temperature most often correspond to the boundaries between the relatively cold intracluster gas of merging clumps and hot, already shocked gas surrounding them. This is in agreement with interpretation of Markevitch et al. (2000) and Vikhlinin et al. (2001). We found many smaller cold fronts in frequent minor mergers. For example, a small-scale cold front associated with the merging subclump to the left of the cluster center can be seen in the panel of Figure 2. This cold front has a size of kpc and temperature of keV, so this is essentially a poor group. Here, unlike the advanced merger stage discussed in the previous section, the merging subclump is on the first approach to the cluster center and has not yet suffered major tidal disruption. The motion of the dense clump of gas compresses the ICM upstream of the front. The compression sharpens and enhances the amplitude of gas density and temperature gradients across the front. The surface brightness, temperature and pressure profiles across this cold front are shown in the right panels of Figure 3. Here again, the simulated profiles reproduce all the main features of the observed cold fronts.
The smaller fronts would be much more difficult to observe because they have both much lower X–ray luminosity and surface brightness contrast; however, they can be observed in the nearby clusters. Recently, Forman et al. (2002) presented examples of small-scale cold fronts in the Fornax cluster which have a size of kpc and temperatures of keV. These observed properties are very similar to those found in our simulations. Note also that the relatively cooler gas of the merging sub-clump is trailed by low-entropy (1-2 keV) intergalactic gas in the direction of the subclump’s motion (see also the entropy map in Figure 1). Such elongated regions of low-temperature gas trailing a subclump, if observed, can be identified with regions where filamentary material is accreting onto the cluster. The filamentary structures visible in the temperature map, however, does not appear in the X–ray surface brightness map.
4.3. Dynamics of gas motions
Detailed understanding of gas dynamics in the vicinity of cold fronts is important for placing meaningful constraints on the physics of the ICM, since the power of these constraints relies on the validity of the underlying assumptions of the dynamical model.
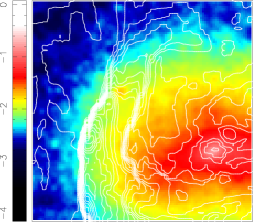
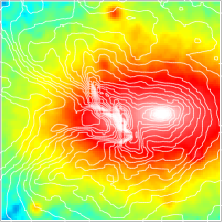
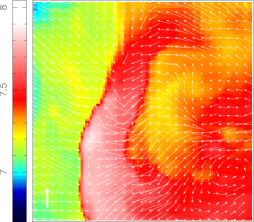
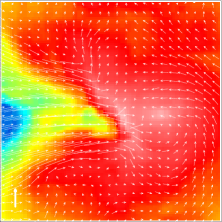
Figure 5 presents projected DM density maps with overlayed contours of emission-weighted temperature (top panels) and emission-weighted temperature maps with overlayed gas velocity fields (bottom panels) for the two cold fronts discussed in the previous section. The velocity fields were constructed by averaging velocities in slice centered on the DM subclump associated with cold front. The figure reveals a variety of high-velocity streams arising during cluster merger. In the large cold front () shown in the left panels, the dominant feature of the velocity field is the collision of two gas flows on the shock boundary. Note that there is no indication of a regular gas flow around the cold front boundary. Instead, the cold gas of the front appears to be moving together with the surrounding hot gas. Moreover, it is clear that the subclump is in the process of tidal disruption: the velocity of its gas is highly non-uniform and the peak of the DM density is displaced with respect to the center of the front. In the minor merger (right panels) the ICM of the main cluster is considerably more relaxed (typical velocities of just ). The bulk flow of gas associated with the merging subclump is also quite regular. Although in this case the assumption of regular flow would be closer to truth, the figure shows that the flow on small-scales around the cold-hot interface is still quite complicated which may hamper development of Kelvin-Helmholtz instabilities.
Finally, we would like to note that we performed a similar search for cold fronts in the SCDM cluster simulation. We found several cold fronts with properties similar to those found in the CDM run. Here again the features were associated with mergers in different stages. In the two clusters that we analyzed, we identified many “small-scale” cold fronts many of which are located in the outskirts of the main cluster progenitor.
5. Discussion and conclusions
We used high-resolution -bodygasdynamics cluster simulations in CDM models to search for counterparts of “cold fronts” within cluster ICM recently discovered in Chandra observations. The observed cold fronts are very sharp features in the X-ray surface brightness and temperature maps found in several clusters. These features are characterized by an increase in surface brightness by a factor accompanied by a drop in temperature of a similar magnitude over the scale of 10-50 kpc. The existence of such sharp features can put interesting constraints on the properties of the intracluster medium (ICM), including the efficiency of energy transport (Ettori & Fabian, 2000) and the magnetic field strength in the ICM (Vikhlinin et al., 2001). In this paper, we investigate whether such features can be produced naturally in clusters forming in hierarchical models and study their origin, structural properties and detectability.
We find that cold fronts appear to be common and often arise in major and minor cluster mergers. In the preceding sections we discussed two specific cases of cold fronts found in the simulation of the CDM cluster. In the most spectacular case, the cold front arises in a major merger when the merging subclump, moving slightly supersonically, is undergoing tidal disruption (see distribution of DM and velocity field in Fig. 5). The motion of the gas, which appears to be in the process of being “sloshed out” of the potential well of its DM halo, drives the shock and leads to a steepening of density and temperature gradients which produces the cold front. The surface brightness and temperature profiles across the front show that a drop of temperature over the scale of is accompanied by a jump in surface brightness by a factor of , behavior very similar to the profiles of observed cold fronts. In addition, we find that similarly to observations pressure changes smoothly accross cold fronts in simulations. The spatial extent of the cold front in simulation () is comparable to the extent of two prominent observed cold fronts in clusters A2142 and A3667 (Markevitch et al., 2000; Vikhlinin et al., 2001). Note also that the cold front is preceded by a bow shock ( kpc from the cold front). In this case the jump in surface brightness by a factor of is accompanied by an increase in temperature of a similar magnitude over the scale of kpc. The shock front has a much lower X–ray surface brightness than the gas around the cold front and therefore would be difficult to observe. Nevertheless, indications of a similar bow shock preceding the cold front were found in A3667.
In another discussed case, the cold front arises in a minor merger when a merging subclump reaches the inner regions of the larger cluster and gas in front of the subclump is significantly compressed. The compression sharpens and enhances the amplitude of gas density and temperature gradients across the front. Here the subcluster is on the first approach to the main cluster’s core and is not yet significantly disturbed by tides. The relatively cooler gas of the merging sub-clump is trailed by low-entropy (1-2 keV) intergalactic gas in the direction of the subclump’s motion. Such elongated regions of low-temperature gas trailing a subclump, if observed, can therefore be identified with regions where filamentary material is accreting onto cluster and could potentially be targets for studies of properties of intergalactic material. Unfortunately, the X–ray surface brightness of this gas is very low and detecting such regions will be a challenge. The best chance of observing such gas in candidate regions would be X-ray and UV metal absorption lines in spectra of bright background sources (e.g., Hellsten et al., 1998).
Cold fronts in both observed and simulated clusters seem to come in all shapes and sizes and are rather frequent, as reports of many new instances of cold fronts are published (e.g. Sun & Murray, 2002; Forman et al., 2002; Markevitch et al., 2002). In the two clusters that we analyzed, we identified many “small-scale” cold fronts many of which are located in the outskirts of the main cluster progenitor. Most of these cold fronts would probably not be detected in distant clusters with typical exposures and field sizes of Chandra observations, although they are similar to those observed in the Fornax cluster (Forman et al., 2002). The fact that large-scale ( Mpc) cold fronts arise in major mergers and survive for approximately dynamical time ( Gyr) implies that their frequency will be similar to the frequency of major mergers. The latter is a very strong function of redshift (, (see, e.g. Gottlöber et al., 2001)) and may not be very high at (depending on cosmology and the power spectrum normalization), but be increasingly larger for higher redshift clusters. Indeed, the large-scale cold front that we discussed occurs at . Observationally, cluster ZW3146 at exhibits several cold front like features (Forman et al., 2002). More recently, Markevitch et al. (2002) reported results of a systematic search for cold fronts in archival Chandra observations of 30 apparently relaxed clusters. Surprisingly, they find cold-front like features in the large fraction of the clusters. Larger samples of both observed and simulated clusters will be useful to determine the frequency of cold fronts.
Our results support the interpretation of cold fronts as boundaries between hot ICM of the main cluster and “the dense subcluster core that has survived a merger and ram pressure stripping by the surrounding shock-heated gas” (Markevitch et al., 2000). Based on this interpretation, Vikhlinin et al. (2001) proposed the detailed dynamical model of the cold front observed in cluster A3667 assuming a spherical dense gas subclump in a spherical dark matter potential moving through the uniform ICM. This model was used to place constraints on the magnetic field configuration and strength and plasma conductivity in the vicinity of cold front. The conductivity can be constrained simply by the sharpness of the observed front if a certain lifetime is assumed for the front. The constraint on the magnetic field configuration, on the other hand, is obtained from the fact that no indication of Kelvin-Helmholtz instabilities is present in observations. Such instabilities are expected to develop quickly for a regular high-velocity flow of hot surrounding gas around the dense subclump along the cold front boundary. The power of these constraints relies on the validity of the underlying assumptions. Of these, the assumption of regular flow is particularly worrisome, given the complicated flow structure apparent from entropy and temperature maps shown in Figs. 1 and 2.
Indeed, Figure 5 shows that this assumption fails in the case of cold fronts identified in our cluster simulations. Our simulations show that dynamics of gas around the simulated cold front is much more complicated than that assumed in Vikhlinin et al.’s model. In particular, the flow of gas around the front is not laminar and in general is not parallel to the front. Vikhlinin et al., on the other hand, assumed a laminar flow similar to flow of gas around a blunt body. In this case the gas flow lines are parallel to the front - the conditions ideal for development of the Kelvin-Helmholtz instabilities. The velocity field shown in Fig. 5 is very different and the conditions are probably not as conducive to the Kelvin-Helmholtz instability as those assumed in Vikhlinin et al.’s model. On the other hand, the cold front in A3667 that they model has a much more regular appearance than the simulated cold front shown in Fig. 4. But, such detailed comparison is difficult because processes discussed by Vikhlinin et al. would be poorly resolved in our simulations, which cannot resolve well perturbations smaller than 20 kpc. It is also difficult to draw conclusions about how generic the differences are (i.e., whether the flow pattern assumed in Vikhlinin et al. can arise in simulated clusters). These questions will be addressed in future studies using considerably higher resolution simulations and a large sample of simulated clusters, respectively.
To conclude, our results indicate that cold fronts are non-equilibrium transient phenomena arising in cluster mergers. They occur when the relatively cold gas of the merging subclump is moving fast with respect to the hotter gas of the main cluster. Both simulated cold fronts discussed in the paper would be detectable in a Chandra observation of ksec exposure, if the clusters were located at a moderately low redshift (e.g., , see Fig. 4). Cluster mergers (especially minor) are common and the fact that we were able to identify several cold fronts in the simulations of only two clusters means that we can expect many more cold fronts to be discovered in the near future (e.g., Sun & Murray, 2002). If the origin and properties of these features are understood, they can provide powerful constraints on the frequency of cluster mergers and properties of the intracluster medium. The analysis presented here is a first step in studying the origin and properties of cold fronts. The presented results should be useful in assessing the validity of the assumptions in the detailed modeling of cold fronts and developing more sophisticated models.
References
- Bialek et al. (2002) Bialek, J. J., Evrard, A. E., & Mohr, J. J. 2002, ApJ, 578, L9
- Bryan & Norman (1997) Bryan, G. L. & Norman, M. L. 1997, in ASP Conf. Ser. 123: Computational Astrophysics; 12th Kingston Meeting on Theoretical Astrophysics, 363
- Ettori & Fabian (2000) Ettori, S. & Fabian, A. C. 2000, MNRAS, 317, L57
- Forman et al. (2002) Forman, W., Jones, C., Markevitch, A., Vikhlinin, A., & Churazov, E. 2002, (astro-ph/0207165)
- Frenk et al. (1999) Frenk, C. S., White, S. D. M., Bode, P., Bond, J. R., Bryan, G. L., Cen, R., Couchman, H. M. P., Evrard, A. E., Gnedin, N., Jenkins, A., Khokhlov, A. M., Klypin, A., Navarro, J. F., Norman, M. L., Ostriker, J. P., Owen, J. M., Pearce, F. R., Pen, U. ., Steinmetz, M., Thomas, P. A., Villumsen, J. V., Wadsley, J. W., Warren, M. S., Xu, G., & Yepes, G. 1999, ApJ, 525, 554
- Gottlöber et al. (2001) Gottlöber, S., Klypin, A., & Kravtsov, A. V. 2001, ApJ, 546, 223
- Hellsten et al. (1998) Hellsten, U., Gnedin, N. Y., & Miralda-Escudé, J. 1998, ApJ, 509, 56
- Klypin et al. (2001) Klypin, A., Kravtsov, A. V., Bullock, J. S., & Primack, J. R. 2001, ApJ, 554, 903
- Kravtsov (1999) Kravtsov, A. V. 1999, Ph.D. Thesis
- Kravtsov et al. (2002) Kravtsov, A. V., Klypin, A., & Hoffman, Y. 2002, ApJ, 571, 563
- Loeb (2002) Loeb, A. 2002, accepted for publication in New Astronomy, (astro-ph/0203450)
- Markevitch et al. (2000) Markevitch, M., Ponman, T. J., Nulsen, P. E. J., Bautz, M. W., Burke, D. J., David, L. P., Davis, D., Donnelly, R. H., Forman, W. R., Jones, C., Kaastra, J., Kellogg, E., Kim, D. ., Kolodziejczak, J., Mazzotta, P., Pagliaro, A., Patel, S., Van Speybroeck, L., Vikhlinin, A., Vrtilek, J., Wise, M., & Zhao, P. 2000, ApJ, 541, 542
- Markevitch et al. (1999) Markevitch, M., Sarazin, C. L., & Vikhlinin, A. 1999, ApJ, 521, 526
- Markevitch et al. (2002) Markevitch, M., Vikhlinin, A., & Forman, W. R. 2002, To appear in ASP Conference Series, (astro-ph/0208208)
- Quilis et al. (1998) Quilis, V., Ibanez, J. M. A., & Saez, D. 1998, ApJ, 502, 518
- Raymond & Smith (1977) Raymond, J. C. & Smith, B. W. 1977, ApJS, 35, 419
- Ricker & Sarazin (2001) Ricker, P. M. & Sarazin, C. L. 2001, ApJ, 561, 621
- Roettiger et al. (1997) Roettiger, K., Loken, C., & Burns, J. O. 1997, ApJS, 109, 307
- Sun & Murray (2002) Sun, M. & Murray, S. S. 2002, To appear in ApJ, Vol 576, 2002, (astro-ph/0206255)
- Teyssier (2002) Teyssier, R. 2002, A&A, 385, 337
- Vikhlinin et al. (2001) Vikhlinin, A., Markevitch, M., & Murray, S. S. 2001, ApJ, 551, 160
- Voigt et al. (2002) Voigt, L. M., Schmidt, R. W., Fabian, A. C., Allen, S. W., & Johnstone, R. M. 2002, submitted to MNRAS, (astro-ph/0203312)