The Pulsar Wind Nebula in G11.20.3
Abstract
We present an X-ray and radio study of the wind nebula surrounding the central pulsar PSR J18111925 in the supernova remnant G11.20.3. Using high resolution data obtained with the Chandra X-ray observatory and with the VLA radio telescope we show the X-ray and radio emission is asymmetric around the pulsar, despite the latter’s central position in the very circular shell. The new X-ray data allows us to separate the synchrotron emission of the pulsar wind nebula from the surrounding thermal emission and that from the pulsar itself. Based on X-ray data from two epochs, we observe temporal variation of the location of X-ray hot spots near the pulsar, indicating relativistic motion. We compare thermal emission observed within the shell, which may be associated with the forward shock of the pulsar wind nebula, to thermal emission from a nearby portion of the remnant shell, the temperature of which implies an expansion velocity consistent with the identification of the remnant with the historical event of 386 A.D. The measured X-ray and radio spectral indices of the nebula synchrotron emission are found to be consistent with a single synchrotron cooling break. The magnetic field implied by the break frequency is anomalously large given the apparent size and age of the nebula if a spherical morphology is assumed, but is consistent with a bipolar morphology.
1 Introduction
The overall structure and evolution of the X-ray emission produced by a spherically symmetric relativistic particle wind coming from a young pulsar in a supernova remnant has been modelled extensively (Reynolds & Chevalier, 1984; Kennel & Coroniti, 1984; van der Swaluw et al., 2001; Blondin, Chevalier, & Frierson, 2001). In addition, some progress has been made on the fine structure and time dependence of the sites of shock acceleration in the inner regions (Gallant & Arons, 1994). The observational tests of these models have been dominated by discussions of the Crab nebula. The advantages of studying the Crab, with its high luminosity, known age, and well observed pulsar, are many. However, the Crab is less than an ideal test case for understanding pulsar wind nebulae (PWNe) in supernova remnants (SNRs) as a class due to its anomalously high luminosity and lack of an observable SNR shell. There are a number of observed radio composite SNRs which consist of a shell and a spectrally distinct inner nebula, presumably PWNe. Only in a few cases, however, has the central pulsar been detected (eg. W44, see Kaspi & Helfand 2002 for a review, also Gotthelf 2001), leaving the spin-down energy driving the emission to be inferred from the PWN itself.
G11.20.3 is a remarkably spherical young SNR plausibly associated with the historical event of 386 A.D. recorded by Chinese astrologers (Clark & Stephenson, 1977). A 65 ms pulsar with spin-down energy was discovered in X-rays by ASCA (Torii et al., 1997, 1999). The characteristic spin-down age is much greater than the apparent age of the SNR and that inferred from its remarkably central position within the remnant given any reasonable transverse velocity (Kaspi et al. 2001, hereafter Paper I). The simplest explanation for this apparent age discrepancy is that the initial spin period of the pulsar is very near the current spin period, which in turn suggests that has remained nearly constant since the supernova explosion. The distance to G11.20.3 has been reasonably well determined to be kpc from HI measurements (Becker, Markert, & Donahue, 1985; Green et al., 1988). We therefore have a system where the assumptions of spherical symmetry, at least in regards to the shell around the pulsar, and constant known energy input are observationally supported, and reasonable estimates of the physical size of various components can be made.
The bright spherical radio shell, reminiscent of the remnants of Tycho’s and Kepler’s supernovae (Downes, 1984), and the lack of an obvious hard central component in the PSPC image, initially led some authors to conclude that G11.20.3 was the remnant of a Type Ia supernova (Reynolds et al., 1994). The first hints of a central plerionic component came from high frequency single dish radio measurements which suggested a central flattening of the radio spectrum (Morsi & Reich, 1987). ASCA observations first clearly demonstrated that there was a central, non-thermal X-ray source (Vasisht et al., 1996). This component was resolved by , the image of which has been presented in Paper I. Further single dish radio observations have clearly demonstrated the existence of a flat central radio component (Kothes & Reich, 2001). Archival VLA observations separate the central plerion from the shell and measure the spectral index to be (defined as , where is the energy flux density at frequency ), a fairly typical value (Tam, Roberts, & Kaspi 2002, hereafter Paper II). In this paper we combine the radio data with the data to make spectral measurements of the pulsar itself, the hard pulsar wind nebula, and soft thermal emission possibly related to the PWN which we compare to a portion of the shell. We also present evidence for apparent temporal variation in the positions of emission features in the central portion of the X-ray PWN, and make a detailed comparison of the X-ray morphology with a new 3.5 cm VLA image. We then compare these observations to models of PWN evolution and explore the possibility that within the SNR shell a wind termination shock produces the variable hard emission, and the forward shock of the PWN expanding into the stellar ejecta produces the interior thermal structures.
2 Observations and Analysis
2.1 X-Ray and Radio Observations
NASA’s Chandra X-ray Observatory observed G11.20.3 at two epochs, the first (Sequence Number 50076) on 2000 August 6, and the second (Sequence Number 50077) on 2000 October 15, for 20 ks and 15 ks respectively. The remnant was positioned on the back-illuminated CCD chip S3 of the ACIS instrument in standard exposure mode with a time resolution of 3.2 s, too coarse to detect pulsations from the pulsar. The data were reduced and analysed with CIAO 2.2.1 using Caldb 2.12, XSPEC V.11.1.0 and the MIRIAD software packages. Details of the image analysis and a three color X-ray image of the SNR can be found in Paper I. Here, we focus on the emission interior to the shell.
Analysis of archival 20 cm and 6 cm VLA data presented in Paper II revealed the extent of the radio PWN by showing that most of the central enhancement has a significantly flatter spectrum than the surrounding shell. In order to further enhance the relative brightness of the PWN over the shell, we have obtained 3.5 cm data with the VLA in the DnC, C, and CnB configurations as part of a campaign to better constrain the broad-band radio spectrum and measure the shell expansion. Details of the radio observations will be presented elsewhere (Tam et al. in preparation).
2.2 Spatial Analysis
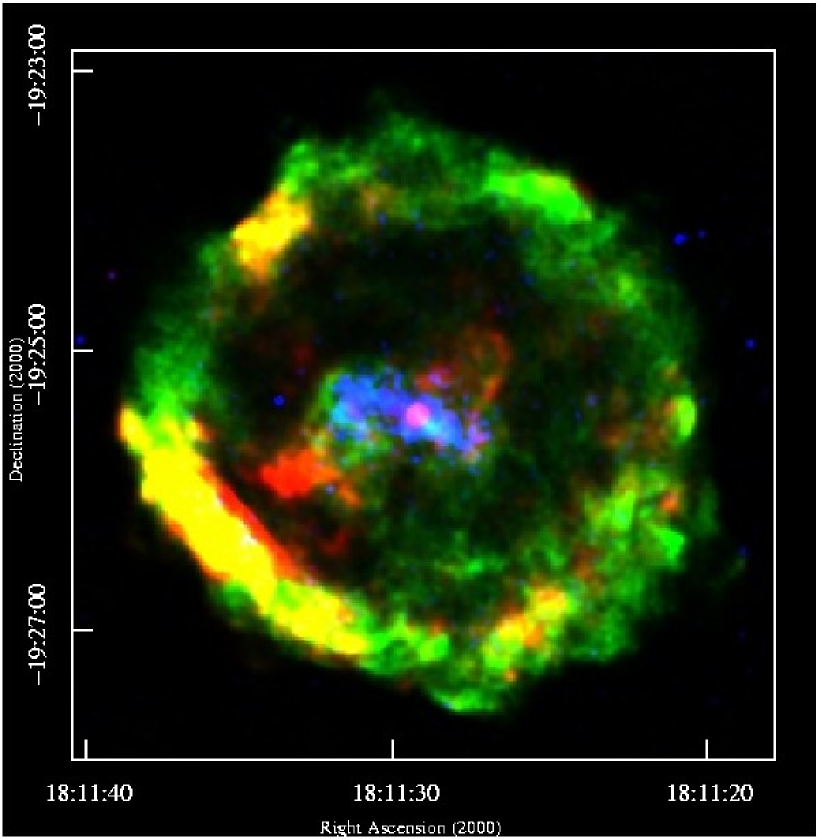
The multi-wavelength image of G11.20.3 is presented in Figure 1. The 3.5 cm radio image is shown in green, the soft (0.6-1.65 keV) X-ray image, dominated by thermal emission, is in red, and the hard (4-9 keV) X-ray image is in blue. This image shows the relationship between the interior thermal X-ray emission, the radio PWN and the bright, hard X-ray emission of the PWN. It also shows how the relative brightness of the soft X-ray emission and the radio emission changes around the shell. The point source at the center is the pulsar, which is only seen in the X-ray images. Paper I noted that the hard X-ray PWN consists of a bright region southwest of the pulsar, a narrow, almost linear component to the northeast, and a larger, faint, diffuse component with reasonable bi-lateral symmetry around the pulsar (see Figure 2 in Paper I).
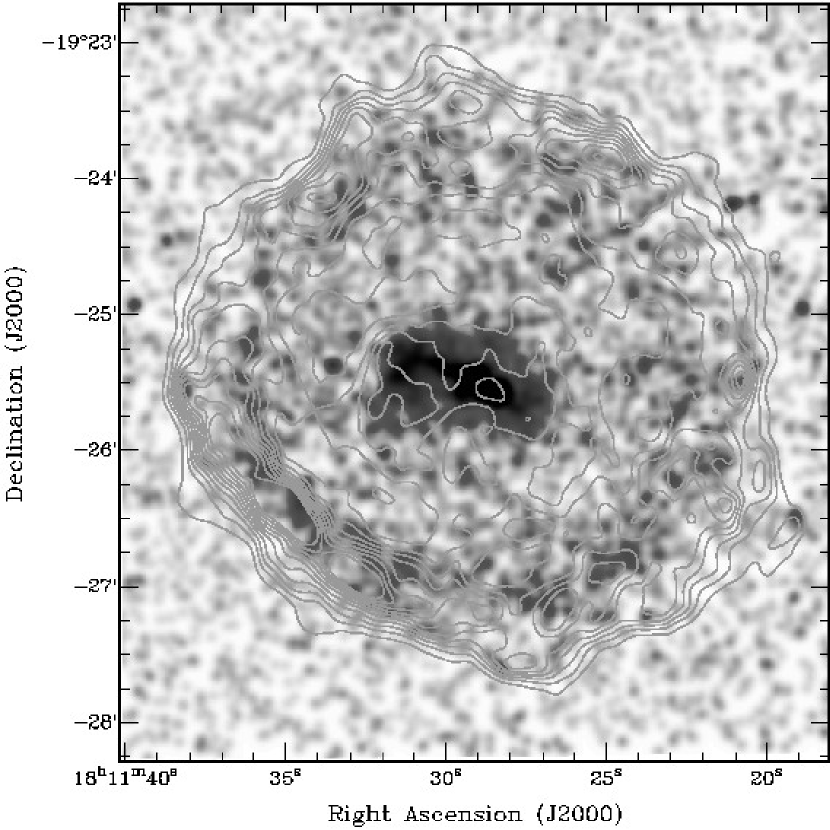
In Figure 2 we show the exposure corrected, 4-9 keV summed image of the two observing epochs, smoothed with a Gaussian, with 6 cm radio (which better shows a combination of flatter and steeper features) contours overlain. The SNR shell predominantly emits soft, thermal X-ray emission which is mostly invisible above 4 keV, and so the features in this image show regions of non-thermal emission. The central PWN is quite hard, and the greyscale levels in this image have been chosen to highlight the difference between the bright and faint parts of the PWN. The extent and shape of the radio PWN correlate well with the faint hard PWN X-ray component. To the northeast of the pulsar, the narrow bright hard X-ray feature goes through a region of low radio luminosity, and then terminates at a bright arc in the radio emission. To the southwest, the bright hard X-rays coincide with the radio emission, with a radio enhancement coincident with the X-ray peak (the ‘spot’ region referred to below). The shell is clearly seen in hard X-rays, although they are concentrated towards the inner edge of the shell, especially in the bright southwestern section. These hard X-rays are largely interior to the peak emission of the radio shell in this region.
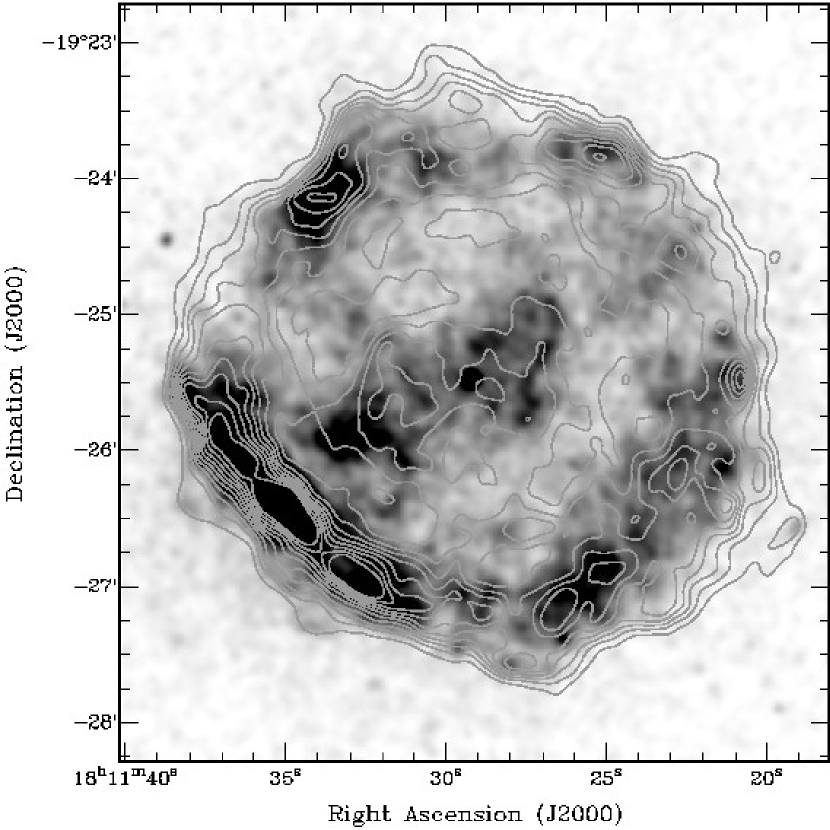
In Figure 3 we show the soft (0.61.65 keV) X-ray emission with the same radio contours as in Figure 2. There is a large, soft X-ray structure which we refer to as the soft “PWN”, which is centered on the pulsar, reaching to the northwest and southeast. The ratio of medium to soft X-ray flux, suggests this structure does not have any large spectral variations (see Paper I). This soft X-ray emission seems to outline much of the radio PWN and largely coincides with radio features that were shown in Paper II to have steeper spectra consistent with the radio shell emission rather than the PWN emission. The soft X-ray and radio shells are quite similar, except the radio emission is slightly more extended than are the X-rays around most of the shell. However, the bright enhancement in the southeastern portion of the shell seems to be broader in thermal X-rays relative to the radio than elsewhere in the shell.
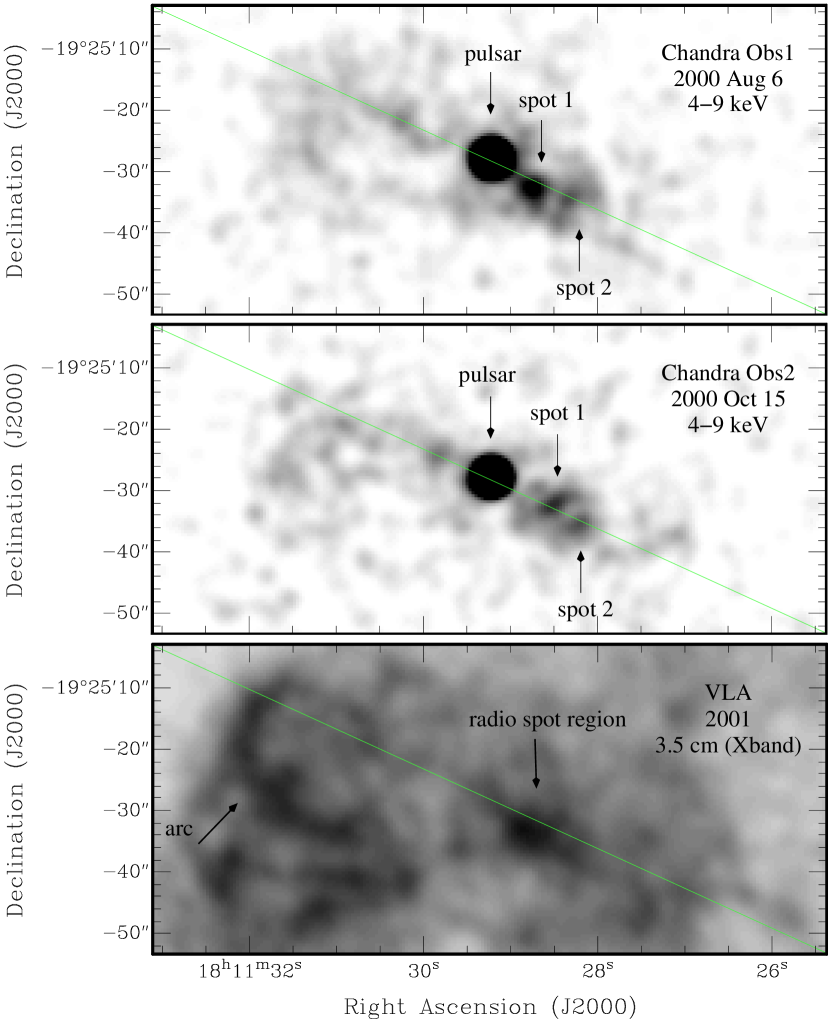
To study the details of the PWN, we produced separate hard X-ray images for the two observation epochs whose coordinates we aligned by using the bright emission of the pulsar to correct for slight differences in the aspect solution. These were then exposure corrected and smoothed with a Gaussian (Figure 4). For comparison, we also present the same region from the 3.5 cm radio observation, which best shows the PWN due to its flatter spectra relative to the shell. The brightest features in both X-ray images other than the pulsar are two spots to the southwest of the pulsar, which are and above the surrounding PWN level. To better see the relative amplitudes, we also show line intensity profiles of all three images of the slice indicated in the images (Figure 5). The positions of the two spots were determined for each epoch both by centroiding and by fitting a 2-D Gaussian on top of a constant background, the two methods giving consistent results. The latter method gives uncertainty estimates with which we add in quadrature a relative aspecting uncertainty of using the pulsar as our reference (see aspecting calibration memos by M. Markevitch 111http://asc.harvard.edu/cal/Hrma/ hrma/optaxis/platescale/geom_public.html ). During the first observation, the physical distances of the spot centers from the pulsar were pc and pc, where . By the second observation the apparent centers had moved significantly, and away from the pulsar, implying apparent transverse velocities of and .
2.3 Spectral Analysis
2.3.1 Methodology
’s high resolution imaging capabilities allow the measurement of point source spectra to be made with remarkably low background levels. We initially used a 7 pixel radius circular region to extract a pulse height spectrum from the pulsar with an annular background region from 7 to 10 pixels. The spectrum showed an enhancement at high energies, a clear signature of pileup. From the observed count rate of , we estimate a pile-up fraction %, which is enough to significantly affect the measurement of the spectral index. Around half of the counts are contained within one pixel at the center of the PSF, which is where most of the pile-up occurs. By excluding the central pixel, we can minimize the effects of pileup, but must then worry about the variations in the PSF as a function of energy which will affect the spectrum when a restricted extraction region is used. Since the current version of CIAO is not able to calculate the effective area when only a fractional part of the PSF is enclosed, we examined the PSF enclosed energy curves and carefully chose annular extraction regions for the on source and background spectra whose difference would provide a relatively constant enclosed energy fraction over most of the Chandra waveband. Choosing an annular source extraction region with inner and outer radii of , and a background annular region of , we obtained an enclosed energy fraction of which varies by only a few percent in the 1-9 keV range. We fit the resulting spectrum to an absorbed power-law model, the results of which are listed in Table 1.
For extended sources, both the cosmic X-ray and particle background are non-negligible, and vary with position on the detector. At the moment, there is no consensus on the best way of approaching this problem. We have therefore used the following procedure, based on one developed by Roberts, Romani & Kawai (2001) for analysis of GIS data. We assume that the background consists of three components: a particle component which is not necessarily spatially correlated with the telescope effective area, an extragalactic component which suffers from absorption by the Milky Way, and a Galactic component. We further assume that the particle background is relatively time independent once the data are screened for background flaring events and that the two cosmic contaminating components uniformly illuminate the telescope over the S3 chip field of view. The science support center has made available blank-sky observations of high Galactic latitude fields which we assume accurately represent the particle and unabsorbed extra-Galactic components of the background.
Using the above assumptions, we account for the different background contributions in the following way. We extract spectra from the region of interest and a source-free region of the chip. From each of these, we subtract spectra extracted from blank-sky data sets from the same chip regions in order to remove the particle background contribution. Since the effective exposure varies as a function of chip position, we scale the local background spectra by the ratio of average exposures of the source and background regions using the exposure maps which were used in producing the exposure corrected images of Paper I. Although this corrects for the gross differences in effective area between the source and background extraction regions, it should be noted that the variation in effective area with position is energy dependent, which is not taken into account with the current procedure. However, this assumption allows us to account for the background in a model independent way. In practice, for G11.20.3 the spectral results are not strongly sensitive to the background subtraction method used, as the source to background ratio is high. To create effective area and response matrix files, we make a binned image of the source region photons from which we subtract an image created from the blank-sky data set, and use this as the input weighting map to the CIAO mkwarf and mkrmf tools. The resulting source and background spectra and calibration files are used in XSPEC to fit models to the spectra. Note that, given the assumptions described above, all three background components are accounted for by this procedure.
2.3.2 Results of Model Fitting
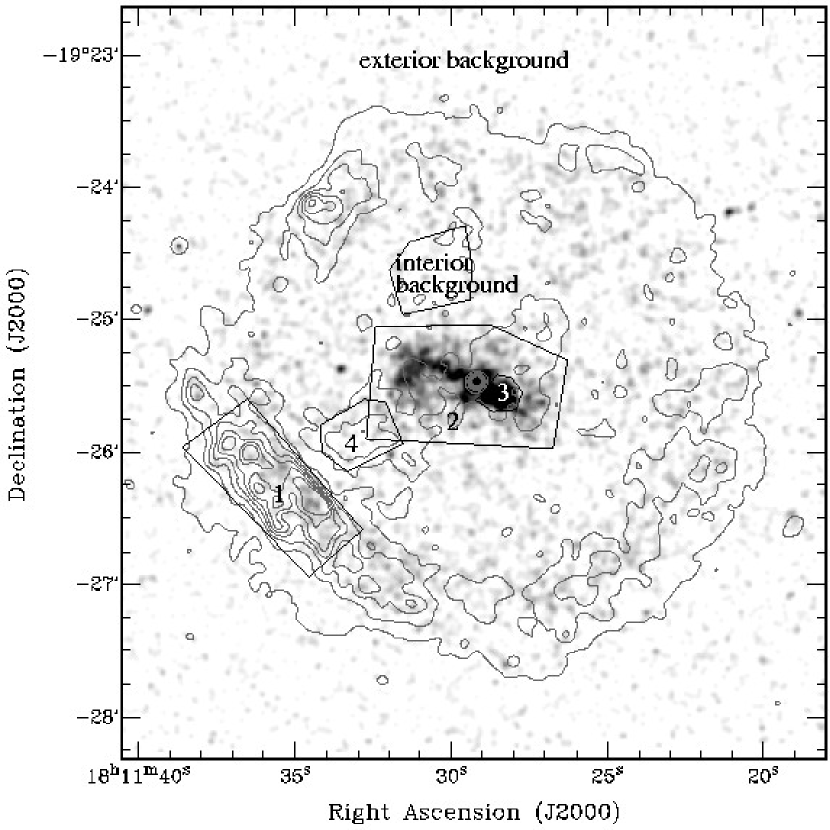
In Figure 6, we show the extraction regions used for spectral analysis. The greyscale again shows the hard X-ray emission, while the contours show the soft X-ray emission. The interior of the shell has enhanced emission over the general background, so for features within the shell, we choose a background region interior to the shell. In the case of the shell itself (region 1), a region exterior to the shell is chosen as background.
We analyzed the bright region of the shell (region 1) near that of a portion of the interior soft feature (region 4). In order to compare the two regions, we initially used the constant temperature, plane-parallel shock plasma model PSHOCK in XSPEC for both. However, there is a clear hard excess in region 1 seen both in the spectrum and the hard X-ray image (Figure 6), while there is very little emission above 4 keV in region 4. This hard X-ray emission is expected from shock acceleration of particles in SNR shells, the presumed source of Galactic cosmic rays. To account for this, we add the synchrotron roll-off SRCUT model (Reynolds & Keohane, 1999), which simulates the roll-off of the synchrotron emission spectrum of an exponentially cut off power-law distribution of electrons, to the region 1 fit, fixing the radio spectral index as determined in Paper II and the 1 GHz flux extrapolated from the 1465 MHz image. We then fit for the roll-off break frequency which will reproduce the observed hard excess. In both regions, the spectral features seemed to be shifted by channels. Since we used a 10 eV/channel binning scheme when generating the response matrices, this is similar to the +16 eV zero point gain shift reported on 31 Jan. 2002 to the Chandra users committee222http://asc.harvard.edu/udocs/ucom.jan02.html. We corrected for this by applying a 1.6 channel bin shift to the response matrix. A significant improvement to the region 4 fit could be made by adding a weak narrow line at 1.18 keV, and there was weaker evidence for this feature in the other spectra. The strength of this line varied with the size of the extraction region, and not the total flux. We therefore suspect that this is some background component not adequately removed by the procedure described in the above section.
For region 4, (and subsequently regions 2 and 3), we were able to obtain a reasonable fit using the simple absorption and shock models, but found the much greater signal to noise region 1 spectrum, with counts, showed significant residuals around all of the spectral line features. Using the VPSHOCK model, which allows the individual element abundances to vary, greatly improved the fit, but there still seemed to be systematic offsets in the location of the spectral features. Allowing a redshift improved the fit statistically, but the implied velocities were too large to be plausible. We then tried allowing variable abundances in the absorption using the VPHABS model, which significantly improved the overall fit resulting in a reduced . However, there is significant correlation between the individual element abundances as well as between the abundances in the shock model and their corresponding absorption abundances. It is also true that calibration uncertainties in the response, which are known to lead to overestimates of line widths, will have had an unknown effect on the abundance values. We therefore do not report the individual abundance values quantitatively and instead make only general comments. It should be noted that the various model changes only slightly alter the fit temperature and overall absorption column of the region 1 spectrum. The VPSHOCK and VPHABS also improved the region 4 spectral fit, but the freedom allowed by poorer statistics (from only counts in the spectrum) could not effectively constrain the parameters, and so we only report the results of the fits without individually varying abundances.
The resulting temperatures of regions 1 and 4 were similar, with the shell having abundances several times solar. However, these are all sensitive to the fit absorption abundances, which tended to be high in Si and S, but low in Mg. High resolution spectra very sensitive to low energies would be required to disentangle the absorption and emission features. There were several local minima in the multi-parameter space near the best fit values, with moderately different temperatures (ranging from keV) and absorptions. The ionization timescale upper limit parameter of the shock model and the SRCUT break frequency were somewhat more sensitive, but did not vary by more than a factor of 2. We emphasize that the 90% multi-parameter confidence regions presented in Table 1 are statistical around our best fit values and may not represent the true uncertainty. However, the systematic uncertainties are not likely to affect the qualitative interpretation of the results presented in the discussion below.
We also tried fitting the shell portion using the VNPSHOCK model which allows for different ion and electron temperatures. There were no significant differences between the two temperatures, indicating that the ions and electrons are in rough equilibrium. However, the dependence of the model on changes in ion temperature is weak (Borkowski, Lyerly, & Reynolds, 2001), and moderate temperature differences could not be ruled out.
In order to determine the synchrotron emission properties of the hard PWN (regions 2 and 3), the soft thermal emission in the central regions near the pulsar needs to be accounted for. We use our best fit PSHOCK and PHABS values from the interior soft emission (region 4) spectral fits, and allow only the normalization and total to vary. To this we add a simple power-law model to fit the hard PWN components. The synchrotron X-rays are clearly seen in the data (Figure 7). The results of all the fits are listed in Table 1 with 90% multi-parameter confidence regions in parentheses. The observed fluxes with 1 errors are listed for the energy ranges indicated for the pulsar and regions 1 and 4. For regions 2 and 3, the unabsorbed fluxes of the power-law model component only are given.
3 Discussion
Models of PWN evolution in SNRs suggest there are two major epochs in the life of the system. In the early evolution, the PWN expands into the freely expanding ejecta of the SNR. The highly relativistic pulsar wind is terminated at a shock near the pulsar, which continuously injects electrons and ions having a power-law distribution of energies, as well as magnetic field, into a surrounding cavity. The particles then gyrate in the nebular magnetic field, causing the synchrotron emission. This cavity itself expands at supersonic speeds relative to the surrounding SNR ejecta. Therefore, there should be a forward shock at the edge of this cavity, similar to the SNR forward shock moving into the surrounding ISM.
As the SNR shell expands, sweeping up more of the interstellar medium, a reverse shock is launched which travels towards the SNR center, carrying information about the external medium to the inner portions of the remnant. When the reverse shock encounters the forward shock of the PWN, the PWN is compressed, and reverberates several times (van der Swaluw et al., 2001). The compressed PWN finally settles into a smaller size relative to the SNR shell, and begins to expand again, this time sub-sonically. This corresponds to the SNR entering the Sedov expansion phase, where the dynamics are dominated by the swept-up ISM mass.
Hydrodynamical models of spherically symmetric PWNe in SNRs suggest the collision between the reverse shock and the PWN occurs after yr (van der Swaluw et al., 2001; Blondin, Chevalier, & Frierson, 2001). Although the energy input of the pulsar in these models was appropriate for the high energy output of the Crab and not the relatively steady low energy output of PSR J18111925, the time of collision is largely determined by the propagation of the reverse shock which only depends on the dynamics of the supernova ejecta. We therefore expect the timescale in the case of G11.20.3 to be roughly similar. If we assume the age of the SNR to be 1615 yr, corresponding to the 386 A.D. historical association, then we would expect the time of collision to be near. If the collision has not yet occurred, the PWN should be near its largest extent relative to the SNR shell, and its morphology should be largely determined by the geometry of the pulsar wind. If the collision has occured or is currently occurring, then the PWN should be compressed and distorted by the reverse shock.
The separation of the PWN from the surrounding shell in both the X-ray and radio images suggests that the reverse shock has not yet reached the PWN. The hard X-ray emission concentrated at the inner edge of the shell may result from the recent passage of the reverse shock, suggesting the latter is still near the observed shell. This hypothesis is somewhat supported by the rather large size of the radio PWN (Paper II). In this case, one might hope to see evidence of the PWN forward shock in the form of thermal X-rays. The thermal emission interior to the shell, which we refer to as the soft “PWN”, may be a result of this shock. The smaller ionization timescale of this feature compared to the nearby shell emission may support this interpretation. The similar temperatures suggest the shock speeds are nearly identical, which might be unexpected if the radius of the soft “PWN” is only 2/3 the radius of the shell, as it appears in the image. However, the SNR forward shock will have been significantly slowed by the accumulation of ISM material over the lifetime of the remnant, and the relative magnitude of the velocity jumps at the two shock fronts is model dependent (van der Swaluw et al., 2001). It is therefore difficult to say what relative shock velocities, and hence relative temperature, should be expected.
Following the reasoning of Reynolds et al. (1994), the Rankine-Hugoniot shock speed can be inferred from the best fit temperature of keV of the shell region to be assuming electron-ion equilibrium and that the mean mass per particle is 0.6 times the proton mass. Since the ions heat the electrons, the observed electron temperature is a lower bound on the ion temperature and hence the shock velocity. However, the results of the VNPSHOCK model suggest that the electrons and ions are not far from equilibrium. The velocity thus derived implies a current expansion rate of , giving a free expansion age of yr for the SNR radius . If we adopt the Sedov relation for a blast wave of radius we obtain a Sedov age estimate of yr, close to the historical age yr. The ionization timescale parameter from the VPSHOCK model implies a reasonable electron density of for a 1615 yr old shock, while the synchrotron roll-off break frequency implies a maximum electron energy of TeV for a typical magnetic field strength G (Reynolds & Keohane, 1999).
The pulsar has a hard spectrum with no sign of a thermal component, although that is not surprising given the high level of absorption. The photon index is similar to what has been found recently from other Chandra observations of young pulsars (Lu et al., 2002; Pavlov et al., 2001; Gaensler et al., 2002). The unabsorbed flux, in the 1-10 keV energy band, is similar to the quoted by Torii et al. (1997) for the total pulsed flux, suggesting that the pulsed fraction is nearly 100%.
3.1 Spots as Wisps
The spatial variability observed in the bright PWN spots may be the equivalent of the Crab’s wisps, which are seen to form at the radius of the inner ring ( pc) then move outwards at a speed (Mori et al., 2001). In the Gallant and Arons (1994) model, the wisp spacing roughly corresponds to the post-shock ion Larmor radius. In such a scenario, the spots should form at the characteristic radii and then propagate outward and dissipate. The coincident enhanced radio emission (Figure 4), with its much longer cooling timescale, suggests that these spots are persistently found in this region. We also note that there appears to be dynamical activity within the narrow feature on other side of the pulsar, but the variations in the flux levels are too near the noise level to unambiguously identify individual knots at both epochs. The bright features may also represent a collimated, jet-like outflow. In this case, we might expect new knots to be ejected near the pulsar and move outwards and diffuse. The apparent velocity of or even greater and the brightness asymmetry around the pulsar suggest this may be the case.
The asymmetry of the radio emission compared with the X-ray emission is puzzling. On one side of the pulsar, the emission is coincident, while on the other, the radio and X-ray emission are anti-coincident. Such correlations have been observed in other PWN, most notably around PSR B150958 (Gaensler et al., 2002) whose characteristic age is similar to the age of G11.20.3. The central location and corresponding upper limits on the velocity of the pulsar (see Paper I) make interpretations of such features as a trail marking the previous passage of the pulsar through the region untenable, and argue against a large asymmetry in the birth explosion as a causal factor.
3.2 Magnetic Field
In this section, we present a very simplistic modification to standard PWN magnetic field estimates to account for non-sphericity. We can identify the location of spot 1, , as being downstream from the pulsar wind termination shock , and use this to estimate the downstream magnetic field of the PWN. If we assume a radial relativistic flow and a postshock velocity of , then (eg. Chevalier 2000):
| (1) |
where is the ratio of magnetic energy to total energy in the postshock flow. To allow for a non-spherical outflow, we include a beaming fraction at the termination shock .
The current best estimate of the radio energy spectral index is (defined as ) with an acceptable range of -. The corresponding range of the X-ray energy index is - with a best fit value . The difference between the X-ray and radio spectral indices is consistent with what is expected for a single synchrotron cooling break between the radio and X-ray bands, although the uncertainty may be as large as 0.25. By assuming , we can find the break frequency from the measured radio index and radio and X-ray flux densities:
| (2) |
We estimate the flux density of the radio nebula at 1.5 GHz to be Jy and of the spot region to be Jy, although these could be off by a factor of two (see Paper II for a discussion of flux uncertainties). For the observed range of values for , this results in estimated upper limits on the break frequencies of GHz and GHz, with values for the nominal spectral index of GHz and GHz, respectively.
If we assume constant energy injection of particles over the lifetime of the PWN, as indicated by the inferred initial spin being nearly the same as the current spin period (Paper I), we can estimate the average magnetic field from the apparent break frequency (eg. Chevalier 2000) from:
| (3) |
This is very large compared to the post-shock estimate above (Eq. 1). Even with the most extreme values of flux and spectral index, because of the weak dependence on , the magnetic field in the nebula and in the spot region G. If the magnetic field is constant throughout the emitting volume of the PWN, then the maximum magnetic field can be inferred from the energy injected over the lifetime of the pulsar assuming negligible radiative losses (eg. Pacini and Salvati 1973):
| (4) |
where is the fraction of the spin-down energy which ultimately goes into magnetic field (0.5 for equipartition) and is the ratio of the emitting volume to a sphere of radius , the distance from the pulsar to the radio arc. In order to reconcile Equations 3 and 4, we need a nebular filling fraction . This is feasible if the emission region is bipolar or toroidal rather than spherical, and if the region of high magnetic field, where most of the emission takes place, is somehow confined to the narrow region of high X-ray emission and the surface of the wind bubble. The observed PWN structure in the 3.5 cm image may support this picture (see Figure 4). In general, , since we expect that the outflow would not become much further collimated after the termination shock, but rather the solid angle of the flow would tend to increase with radius. This suggests that the pulsar wind is initially confined to narrow, polar outflows with opening angles in the case of a bipolar nebula or a thin, equatorial sheet in the case of a toroidal nebula.
We introduce the parameters and . It can be shown that the arguments of Rees & Gunn (1974) (see also Kennel & Coroniti 1984) for the build up of the magnetic field to approximate equipartition strength may be applied to both a conical and nozzle type flow, in which case we expect . We can then combine Equations 1 and 4 to derive the following estimate of the termination shock radius:
| (5) |
suggesting should be a few arcseconds from the pulsar. In that case, monitoring of the emission by Chandra should resolve the region of spot formation.
Bandiera, Pacini, and Salvati (1996) noted that the extrapolated ASCA PWN spectra combined with previous estimates of the radio PWN flux led to an anomolously high magnetic field, and suggested a period of rapid spin-down early in the pulsar’s history where the magnetic field was dumped into the surrounding region, and confined by the external SNR shell. This was previous to the discovery of pulsations, and their models greatly overestimate the pulsar spin period. It is interesting to note, however, that an initial spin period ms, similar to that of the Crab pulsar’s, would provide the necessary energy for the magnetic field. Nevertheless, the arguments made above for non-sphericity in the nebula obviate the need for an ad-hoc invocation of an early, short-term, very rapid spin-down era.
Inferring the magnetic field by extrapolating the total PWN radio and X-ray spectra assuming a single break may be questionable. There may be a change in spectral index over the PWN to which we are not sensitive. There is also a possibility that the reverse shock has begun to encounter the PWN, temporarily enhancing the magnetic field at the edges. However, the spot region shows evidence of current particle injection and is likely not yet affected by the reverse shock. The break frequency of this region is times higher here than for the PWN as a whole, which only lowers the magnetic field estimate by a factor of 2, assuming this feature has existed for the entire lifetime of the PWN.
4 Conclusions
We have measured the X-ray spectrum of various components of the shell and pulsar wind nebula of G11.20.3 and compared them with the radio spectrum and morphology. The shell temperature and hard X-ray structure are consistent with a yr old remnant nearing the onset of the Sedov phase. The pulsar wind nebula itself shows evidence of relativistic dynamic evolution of bright X-ray enhancements near the pulsar. We argue that the reverse shock has not yet reached the expanding pulsar wind bubble, and therefore the observed structure is largely determined by the structure of the wind itself. The morphology and magnetic field suggested by the low spectral break energy suggests the outflowing wind is highly non-spherical. The wind may be largely constrained to a narrow, bipolar outflow, or possibly a thin, equatorial sheet. Further high-resolution observations at X-ray, radio and infrared wavelengths could identify the region of spot formation, help determine the true morphology, and further constrain the break energy of the spectrum.
Acknowledgements
We would like to thank S. Reynolds and K. Borkowski for useful discussions on the spectral modelling. This work was supported in part by grant GO0-1132X from the Smithsonian Astrophysical Observatory, NASA LTSA grants NAG5-8063 (VMK) and NAG5-7935 (EVG), a Quebec Merit Fellowship (MSER), and NSERC research grant RGPIN228738-00 (VMK). The National Radio Astronomy Observatory is a facility of the National Science Foundation operated under cooperative agreement by Associated Universities, Inc.
References
- Bandiera, Pacini, & Salvati (1996) Bandiera, R., Pacini, F., & Salvati, M. 1996, ApJ, 465, L39
- Becker, Markert, & Donahue (1985) Becker, R. H., Markert, T., & Donahue, M. 1985, ApJ, 296, 461
- Blondin, Chevalier, & Frierson (2001) Blondin, J. M., Chevalier, R. A., & Frierson, D. M. 2001, ApJ, 563, 806
- Borkowski, Lyerly, & Reynolds (2001) Borkowski, K. J., Lyerly, W. J., & Reynolds, S. P. 2001, ApJ, 548, 820
- Chevalier (2000) Chevalier, R. 2000, ApJ, 539, L45
- Clark & Stephenson (1977) Clark, D. H. & Stephenson, F. R. 1977, Oxford [Eng.] ; New York : Pergamon Press, 1977. 1st ed.
- Downes (1984) Downes, A. 1984, MNRAS, 210, 845
- Gaensler et al. (2002) Gaensler, B. M., Arons, J., Kaspi, V. M., Pivovaroff, M. J., Kawai, N., & Tamura, K. 2002, ApJ, 569, 878
- Gallant & Arons (1994) Gallant, Y. A. & Arons, J. 1994, ApJ, 435, 230
- Gotthelf (2001) Gotthelf, E. V. 2001, 20th Texas Symposium on relativistic astrophysics, 513
- Green et al. (1988) Green, D. A., Gull, S. F., Tan, S. M., & Simon, A. J. B. 1988, MNRAS, 231, 735
- Helfand, Gotthelf, & Halpern (2001) Helfand, D., Gotthelf, E., Halpern, J. 2001, ApJ, 556, 380
- Kaspi et al. (2001) Kaspi, V. M., Roberts, M. E., Vasisht, G., Gotthelf, E. V., Pivovaroff, M., & Kawai, N. 2001, ApJ, 560, 371 (Paper I)
- Kaspi & Helfand (2002) Kaspi, V. M. & Helfand, D. J. 2002, To appear in “Neutron Stars in Supernova Remnants” (ASP Conference Proceedings), eds P. O. Slane and B. M. Gaensler
- Kennel & Coroniti (1984) Kennel, C. F. & Coroniti, F. V. 1984, ApJ, 283, 694
- Kothes & Reich (2001) Kothes, R. & Reich, W. 2001, A&A, 372, 627
- Lu et al. (2002) Lu, F. J., Wang, Q. D., Aschenbach, B., Durouchoux, P., & Song, L. M. 2002, ApJ, 568, L49
- Mori et al. (2001) Mori, K., Hester, J. J., Burrows, D. N., Pavlov, G. G., & Tsunemi, H. 2001,To appear in “Neutron Stars in Supernova Remnants” (ASP Conference Proceedings), eds P. O. Slane and B. M. Gaensler.
- Morsi & Reich (1987) Morsi, H. W. & Reich, W. 1987, A&AS, 71, 189
- Pacini & Salvati (1973) Pacini, F. & Salvati, M. 1973, ApJ, 186, 249
- Pavlov et al. (2001) Pavlov, G. G., Zavlin, V. E., Sanwal, D., Burwitz, V., & Garmire, G. P. 2001, ApJ, 552, L129
- Pavlov et al. (2001) Pavlov, G. G., Kargaltsev, O. Y., Sanwal, D., & Garmire, G. P. 2001, ApJL, 554, L189
- Rees & Gunn (1974) Rees, M. J. & Gunn, J. E. 1974, MNRAS, 167, 1
- Reynolds & Chevalier (1984) Reynolds, S. P. & Chevalier, R. A. 1984, ApJ, 278, 630
- Reynolds & Keohane (1999) Reynolds, S. P. & Keohane, J. W. 1999, ApJ, 525, 368
- Reynolds et al. (1994) Reynolds, S. P., Lyutikov, M., Blandford, R. D., & Seward, F. D. 1994, MNRAS, 271, L1
- Roberts, Romani & Kawai (2001) Roberts, M., Romani, R. & Kawai, N. 2001, ApJS, 133, 451
- Scargle (1969) Scargle, J. D. 1969, ApJ, 156, 401
- Tam, Roberts, & Kaspi (2002) Tam, C., Roberts, M. S. E., & Kaspi, V. M. 2002, ApJ, 572, 202 (Paper II)
- Torii et al. (1997) Torii, K., Tsunemi, H., Dotani, T., & Mitsuda, K. 1997, ApJ, 489, L145
- Torii et al. (1999) Torii, K., Tsunemi, H., Dotani, T., Mitsuda, K., Kawai, N., Kinugasa, K., Saito, Y., & Shibata, S. 1999, ApJ, 523, L69
- van der Swaluw et al. (2001) van der Swaluw, E., Achterberg, A., Gallant, Y. A. & Tóth, G. 2001, A&A, 380, 309
- Vasisht et al. (1996) Vasisht, G., Aoki, T., Dotani, T., Kulkarni, S. R., & Nagase, F. 1996, ApJ, 456, L59
- Weisskopf et al. (2000) Weisskopf, M. et al. 2000, ApJ, 536, L81


| Model | Parameter | Pulsar | Shell (1) | PWN (2) | Spots (3) | Soft “PWN” (4) |
|---|---|---|---|---|---|---|
| (V)PHABSaaPhotoelectric absorption model, allowing the elemental abundances to vary for the shell (1) region only. | 2.36(1.75-3.19)bbValues in parentheses are 90% multi-parameter confidence regions. | 1.71(1.70-2.36) | 2.14(2.04-2.25) | 2.28(1.86-2.77) | 2.15(2.03-2.27) | |
| POWERccsimple photon power law | 1.11(1.00-1.48) | – | 1.73(1.54-1.90) | 1.73(1.55-1.95) | – | |
| (V)PSHOCKddPlane Parallel shock model of Borkowski, Lyerly, & Reynolds (2001), allowing the elemental abundances to vary for the shell (1) region only. | (keV) | – | 0.581(0.553-0.595) | 0.583(frozen) | 0.583(frozen) | 0.583(0.517-0.691) |
| – | 6.7(5.7-8.1) | 4.2(frozen) | 4.2(frozen) | 4.2(2.3-14.9) | ||
| SRCUTeeSynchrotron roll-off model of Reynolds & Keohane (1999). | – | 0.56 | – | – | – | |
| GHz) | – | 1.80(1.68-1.90) | – | – | – | |
| (Jy) | – | 2.0 | – | – | – | |
| (1-10 keV) | (0.7-8 keV) | ffUnabsorbed flux of power law component only. (1-10 keV) | ffUnabsorbed flux of power law component only. (1-10 keV) | (0.7-8 keV) | ||