Evidence for Cluster Evolution from an Improved Measurement of the Velocity Dispersion and Morphological Fraction of Cluster 1324+3011 at
Abstract
We have carried out additional spectroscopic observations in the field of cluster Cl 1324+3011 at . Combined with the spectroscopy presented in Postman, Lubin & Oke (2001, AJ, 122, 1125), we now have spectroscopically confirmed 47 cluster members. With this significant number of redshifts, we measure accurately the cluster velocity dispersion to be km s-1. The distribution of velocity offsets is consistent with a Gaussian, indicating no substantial velocity substructure. As previously noted for other optically-selected clusters at redshifts of , a comparison between the X-ray luminosity () and the velocity dispersion () of Cl 1324+3011 implies that this cluster is underluminous in X-rays by a factor of when compared to the relation for local and moderate-redshift clusters. We also examine the morphologies of those cluster members which have available high-angular-resolution imaging with the Hubble Space Telescope (HST). There are 22 spectroscopically-confirmed cluster members within the HST field-of-view. Twelve of these are visually classified as early-type (elliptical or S0) galaxies, implying an early-type fraction of in this cluster. This fraction is a factor of lower than that observed in nearby rich clusters. Confirming previous cluster studies, the results for cluster Cl 1324+3011, combined with morphological studies of other massive clusters at redshifts of , suggest that the galaxy population in massive clusters is strongly evolving with redshift. This evolution implies that early-type galaxies are forming out of the excess of late-type (spiral, irregular, and peculiar) galaxies over the Gyr timescale.
1 Introduction
Clusters of galaxies represent the largest scale of fully collapsed, virialized structures in the universe and provide a powerful probe of the evolution of structure formation via dynamical collapse. Therefore, quantifying the abundance and dynamical state of clusters is key to understanding the formation of clusters and the evolution of the galaxies within them. With the advent of sensitive X-ray and optical satellites, such as Einstein, ROSAT, Chandra, XMM, and HST, and large ground-based telescopes, such as the Keck 10-m and the VLT 8-m, it has been possible to extend cluster studies up to redshifts of . Optical surveys have revealed a only modest decline in the comoving volume density of rich clusters out to (Gunn, Hoessel & Oke 1986; Postman et al. 1996; Carlberg et al. 1997; Bahcall & Fan 1998; Postman et al. 2002). X-ray observations indicate that the group/cluster X-ray luminosity function does not evolve significantly to for modest X-ray emitters in the luminosity range of to (Ebeling et al. 1997; Nichol et al. 1997; Rosati et al. 1998; Jones et al. 1998); however, there appears to be a measurable decrease in the number of very X-ray luminous () clusters out to (Edge et al. 1990; Henry et al. 1992; Bower et al. 1994; Jones et al. 1998; Henry 2002; Lewis et al. 2002). With these large-area surveys, it has been possible to study the global X-ray and optical properties of clusters and use the observed evolution, or lack thereof, to place strong constraints on the cosmological world model (e.g., Luppino & Gioia 1995; Carlberg et al. 1997; Bahcall & Fan 1997; Borgani et al. 2001).
The galaxy populations within massive clusters, and how their properties evolve with time, have also been the subject of considerable study. In local clusters, early-type (elliptical and S0) galaxies comprise more than 80% of the total population. The galaxy content of clusters is part of the general morphology–density relation which describes the strong correlation between galaxy morphology and environment. As the local density increases, the fraction of early-type galaxies increases, while the fraction of late-type galaxies decreases (Dressler et al. 1980a,b; Postman & Geller 1984). Studies of clusters at have revealed deviations in this universal relation because the morphology and color of the cluster members are evolving. One of the most notable changes is the progressive bluing of the cluster’s galaxy population with redshift. Butcher & Oemler (1984) found that the fraction of blue galaxies in a cluster is a strong function of redshift, increasing from in local clusters to in clusters at . HST imaging reveals that many of these blue galaxies are either normal spirals or have peculiar morphologies, resulting in late-type fractions which are times higher than the average current epoch cluster (Dressler et al. 1994, 1997; Couch et al. 1994; Oemler, Dressler & Butcher 1997; Fabricant, Franx & van Dokkum 2000).
Even though these clusters show an increased fraction of blue galaxies, moderate-redshift clusters still contain a population of early-type galaxies distinguished by extremely red colors and a tight color–magnitude (CM) relation (a “red envelope”). Both the mean color and the CM relation are consistent with that of present–day ellipticals (Butcher & Oemler 1984; Aragón-Salamanca et al. 1991; Stanford, Eisenhardt & Dickinson 1995). At , the red envelope moves bluewards with redshift (e.g. Aragón-Salamanca et al. 1993; Lubin 1996; Stanford et al. 1997; Stanford, Eisenhardt & Dickinson 1998). This color trend is consistent with passive evolution of an old stellar population formed largely at . The red envelope is reasonably narrow and uniform from cluster to cluster, implying that the galaxies formed in an episode of star formation lasting no longer than a few Gyrs (Bower, Lucey & Ellis 1992a,b; Ellis et al. 1997; Stanford et al. 1998; Bower, Kodama & Terlevich 1998; van Dokkum et al. 2001).
To probe the properties of clusters and their galaxy populations at even earlier stages in their development, we have conducted an extensive observational program to study nine candidate clusters of galaxies at (Oke, Postman & Lubin 1998; hereafter Paper I) with the goal of establishing an evolutionary reference sample of clusters analogous to the MORPHS survey at (Smail et al. 1997). The cluster sample was chosen from the optical/near-IR surveys of Gunn, Hoessel & Oke (1986) and Postman et al. (1996). For each cluster, we have obtained deep photometry from the Keck 10-m and KPNO 4-m telescopes, over 120 low-resolution spectra from a -band magnitude-limited spectroscopic survey with Keck, and high-angular-resolution imagery from the Wide Field Planetary Camera 2 (WFPC2) aboard HST. Five papers based on this survey have been published so far. They include Postman, Lubin & Oke (1998; hereafter, Paper II) and Lubin et al. (1998; hereafter, Paper III) which describe the photometric, spectroscopic, and morphological properties of Cl 1604+4304 () and Cl 0023+0423 (). In addition, Postman, Lubin & Oke (2001; hereafter, Paper IV) describe the cluster dynamical properties and the spectrophotometric properties of the galaxies in Cl 1324+3011 () and Cl 1604+4321 ().
In this paper, we present additional spectroscopic observations of the massive cluster, Cl 1324+3011 at , taken at the Keck 10-m telescope. The goal of these observations is to obtain more cluster redshifts in order to measure the dynamics of the cluster and the properties of the cluster galaxy population more accurately. The new observations are described in §2. We have used these new spectroscopic data, combined with those described in Paper IV, to improve the measurement of the cluster velocity dispersion and total mass (§3), to make a more accurate comparion between the X-ray and optical properties of this cluster (§4), and to estimate with reasonable uncertainties the morphological mix of the cluster galaxy population. The discussion of our results and their implication for cluster evolution is presented in §6. Unless otherwise noted, we adopt , , and .
2 Spectroscopic Observations
As in our original program, the spectroscopic observations were conducted using the Low Resolution Imaging Spectrograph (LRIS; Oke et al. 1995) at the W.M. Keck Observatory. Additional spectra for galaxies in an approximately field centered on Cl 1324+3011 were obtained on January 17-19, 2001 at the Keck I telescope. We observed two slitmasks, containing 33 and 35 objects each, with the 400 g/mm grating which is blazed at 8500Å. This grating provides a dispersion of 1.86Å per pixel, and a spectral coverage of 3800Å. The grating angle was set to 7000Å, so that it provided coverage from approximately 5500Å to 9500Å in the first order. This grating was chosen because of its high spectral efficiency at 7000Å where we expect the prominent absorption features, Ca II H & K, for galaxies at .
Broadband optical and, in some cases, data taken as part of the original survey were used to measure photometric redshifts of all galaxies within the field using the empirical approach described in Brunner & Lubin (2000). This approach works well for almost all types of galaxies, specifically normal blue, star-forming galaxies and red, elliptical-like galaxies which are expected to comprise the majority of cluster members. We note that this method does not work well for galaxies with unusual spectra, for example quasars or, more importantly, very strong E+A galaxies, which may comprise 10–20% of the cluster population (see e.g. Dressler et al. 1999). The Brunner & Lubin (2002) technique allows us selectively to maximize completion or minimize contaminaton by tuning the parameters of the algorithm. Specifically, we can use the photometric redshift and its associated error to estimate the probability that a given galaxy is a member of the cluster. Based on the available spectroscopy of this field, we have chosen a probability threshold which indicates a completeness level of 76% and a contamination rate of 28%. Those galaxies above this threshold were weighed most heavily when creating the two slitmasks. Due to the practicality of assigning objects to a slitmask, many galaxies which do not meet this probability criterion are included. For these cases, the galaxies are weighed according their -band (or rest-frame -band) luminosity, allowing us to get a relatively unbaised sample of these galaxies.
Each mask was observed for sec. To calibrate the multi-slit observations, flat-fielding and wavelength calibration were performed using internal flat-field and arc lamp exposures which were taken after the science exposures. Observations of the Oke (1990) spectrophotometric standard stars Feige 66 and G191B2B were used to remove the response function of the chip.
Using the procedures described in Paper I, we were able to measure redshifts for 68% of the objects observed. Failure to measure a redshift is mostly due to insufficient signal-to-noise as some of the targeted objects were as faint as . In Table 1a, we provide the key photometric and spectroscopic parameters for the new objects. These parameters are the same ones as given in Table 2 of Paper IV for the other objects observed in the Cl 1324+3011 field. For ease of reference in the following sections, we include in Table 1b the parameters for the original 32 confirmed members of Cl 1324+3011 determined in Paper IV. In Table 1a, a * indicates a confirmed cluster member based on the dynamical analysis presented in §3.
The parameters listed in Tables 1a & 1b include the Keck object identification number, the absolute AB magnitudes given in the four passbands (ABB, ABV, ABR, ABI), geocentric redshift, and our measure of the redshift quality (see Paper I). Measures of the star-formation rate (column 17), emission line equivalent widths (columns 12-14), and Balmer jump strengths (columns 15-16) are also listed. Emission line intensities are calculated by measuring the observed flux of the continuum at the line and converting the equivalent widths to intensities. Negative and positive values indicate emission and absorption line equivalent widths, respectively. The typical errors in the equivalent widths are estimated from the differences between rest-frame equivalent widths derived from two independent and comparable spectra of the same object. The comparisons imply errors of approximately 5Å for the [O II] line and Å for the H and [O III] lines.
We also provide a spectral classification (column 10) which is based on the line strengths of various metal and Balmer absorption features. Our classification does not include emission line equivalent widths because they have large intrinsic scatter; therefore, it differs from the approach used by Dressler et al. (1999) who use the widths of the [O II] and H lines as their primary discriminants. We opt to use our spectral classification scheme because the four classes encompasss the level at which we can visually discriminate. The strengths of the [O II] are listed separately and present distinctly different information from the absorption lines used in the visual spectral classification. For a full justification of our clasification scheme and a comparison with that of Dressler et al. (1999), see §5.2 of Paper IV. We also refer the reader to Papers II and IV for a complete description of all parameters listed here.
In Figure 1, we show the distribution of redshifts (excluding Galactic stars) for the galaxies observed in the two new slitmasks and for all galaxies observed in the Cl 1324+3011 field, which include the redshifts presented in Paper IV. Both panels show a clear peak at the measured redshift of the cluster, .
3 Cluster Velocity Dispersion and Mass
We use the new redshifts, combined with those presented in Paper IV, to measure a more accurate cluster velocity dispersion. The velocity dispersion is computed by first defining a broad redshift range, typically , in which to conduct the calculations. This range is manually chosen to be centered on the approximate redshift of the cluster. We then compute the bi-weight mean and standard deviation of the velocity distribution (Beers, Flynn, & Gebhardt 1990) and identify the galaxy with the largest deviation from the mean. Velocity offsets from the mean are taken to be which corrects for cosmological and relativistic effects. In the case of bi-weight statistics, is the median of the distribution. If the galaxy with the largest velocity deviation differs from the bi-weight median by either more than 3 or by more than 3500 km s-1, it is excluded, and the computations are redone. The procedure continues until no further galaxies satisfy the above criteria. The 3500 km s-1 limit is based on extensive data available for low clusters (see Papers II and IV for more details). This clipping procedure is conservative and does not impose a Gaussian distribution on the final redshift distribution (see e.g. CL0023+0423 in Paper II). Based on this analysis, we find that we have obtained redshifts for 15 additional cluster members, for a total of 47 spectroscopically-confirmed members. In Figure 2, we show spectra of five of the new cluster members. These representative spectra span the range of spectral properties that are observed in the cluster members of Cl 1324+3011.
We use the histogram of velocity offsets to measure a new cluster velocity dispersion of km s-1. The velocity dispersion has been corrected for the redshift measurement errors which are typically about 200 km s-1. We compute the uncertainty in the dispersion according to the prescription of Danese, de Zotta, & di Tullio (1980), which assumes that the errors in velocity dispersion can be modeled as a distribution and that a galaxy’s velocity deviation from the mean cluster redshift is independent of the galaxy’s mass (i.e., the cluster is virialized). In Figure 3, we show the histogram of velocity offsets relative to the mean cluster redshift for the 47 confirmed cluster members and the best-fit Gaussian to the distribution.
The new velocity dispersion measurement is completely consistent with the old measurement, km s-1, which was based on only 32 members (Paper IV). Because of the larger number of cluster members, the errors in the dispersion have been reduced by more than 20%. We use the Kolmogorov-Smirnov (KS) Test to compare the observed distribution of velocity offsets to a Gaussian model. Based on the KS statistic, we find that the null hypothesis that the two distributions are the same can be disproved at only the 72% level. Consequently, the distribution of velocity offsets is consistent with a Gaussian, indicating no obvious or substantial velocity substructure. The consistency between the velocity dispersion measurements even after including more galaxies suggests that our measured value is an accurate representation of the true velocity dispersion of the cluster; however, it is not possible to determine whether this system is truly virialized based on these data.
In Figure 4, we show the distribution on the sky of the confirmed cluster members. The distribution of cluster members is well concentrated with 50% of the cluster members within Mpc of the -band luminosity-weighted cluster center. The measured harmonic radius is Mpc, consistent with the wide range of values found in local and moderate-redshift clusters of galaxies (e.g., Carlberg et al. 1996).
As in Paper IV, we use the velocity dispersion and distribution of cluster members to derive cluster masses based on three virial theorem mass estimators, the pairwise mass (), the projected mass (), and the ringwise mass () estimators. The differences in the mass estimates are due primarily (but not solely) to the difference in the radius estimators. The pairwise estimator gives a high weight to close pairs; the other two estimates are less sensitive to this and, therefore, give more similar values. For the exact formalisms, see §3.1 of Paper II. The derived kinematic parameters, including mean , dispersion, and mass estimates, are given in Table 2. We give these results using all available redshift data (no radius limit), as well as the results for those galaxies within the central 385 and 770 kpc regions. The derived mass of the cluster, from all of the estimators, is well in excess of , implying that this cluster is typical of an Abell Richness Class 1 or 2 cluster (e.g. Bahcall 1981; Struble & Rood 1991).
4 The Relation for High-Redshift Clusters
In local clusters, which were exclusively identified optically because of historical reasons (e.g., Abell 1958; Zwicky et al. 1961; Abell, Corwin & Olowin 1989), the properties of the galaxies and the intracluster gas are strongly related. In particular, there exist well-defined correlations between the X-ray properties of the gas, such as luminosity ( and temperature (), and the optical properties of the galaxies, such as blue luminosity () and velocity dispersion (). These relations indicate that the galaxies and gas are in thermal equilibrium, i.e. (e.g. Edge & Stewart 1991). Moderate-redshift clusters up to , selected on the basis of both starlight and X-ray emission, still exhibit the same X-ray–optical relations (Mushotzky & Scharf 1997). However, at higher redshifts of , there are indications that at least some massive clusters do not obey the local relations. Specifically, optically-selected clusters at (Couch et al. 1991; Postman et al. 1996; Oke et al. 1998) do not obey the local relation (Castander et al. 1994; Bower et al. 1997; Holden et al. 1997; Paper IV). Their X-ray luminosities are low for their velocity dispersions; thus, they are underluminous compared to their X-ray–selected counterparts.
We can observe this phenomenon in Figure 5 which shows the relation between and for massive clusters up to . The high-redshift () sample includes the three optically-selected clusters from Paper IV (Cl 1324+3011 at , Cl 1604+4304 at , and Cl 1604+4321 at ); however, we now include Cl 1324+3011 with its improved velocity dispersion measurement. The X-ray luminosities of these three clusters are taken from Castander et al. (1994). As is obvious from Figure 5, the points representing the three optically–selected clusters at fall at least an order of magnitude below the relation defined by the low and intermediate-redshift clusters. For example, Cl 1324+3011 has a measured X-ray luminosity of in the keV passband (Castander et al. 1994) or a bolometric X-ray luminosity of . Based on the relation of low-redshift clusters (Mushotzky & Scharf 1997) and our improved measurement of the velocity dispersion, we predict a bolometric X-ray luminosity of (see Paper IV). Consequently, the X-ray luminosity of Cl 1324+3011 is low by a factor of . The results of Cl 1324+3011, and the other optically–selected clusters, clearly suggest that the relation between the galaxies and the gas has evolved between redshifts of and the present day.
In Figure 5, we also show for comparison all high-redshift, X-ray–selected clusters discovered by Einstein and ROSAT which have measured velocity dispersions and X-ray luminosities (Donahue 1996; Henry et al. 1997; Donahue et al. 1998; Gioia et al. 1999; Ebeling et al. 2001; Stanford et al. 2001, 2002). Previous X-ray surveys, such as the Einstein Medium Sensitivity Survey (Gioia et al. 1990), mainly discovered very X-ray luminous () clusters. Consequently, all but one of the high-redshift, X-ray–selected clusters in Figure 5 are more X-ray luminous than our optically-selected clusters. We note that deep X-ray surveys, such as the ROSAT Deep Cluster Survey (Rosati et al. 1998) and the Chandra Deep Field South (Giacconi et al. 2001), are now discovering X-ray underluminous clusters at high redshift. Over a half-dozen clusters at have been identified with very modest X-ray luminosities of (Henry et al. 1997; Giacconi et al. 2001; Stanford et al. 2001, 2002; Hashimoto et al. 2002; Holden et al. 2002). Unfortunately, we cannot currently compare them to our optically-selected clusters because the majority of these X-ray–selected clusters have only a handful of confirmed galaxy redshifts and, therefore, do not have accurately measured velocity dispersions.
5 Cluster Members with HST Imaging
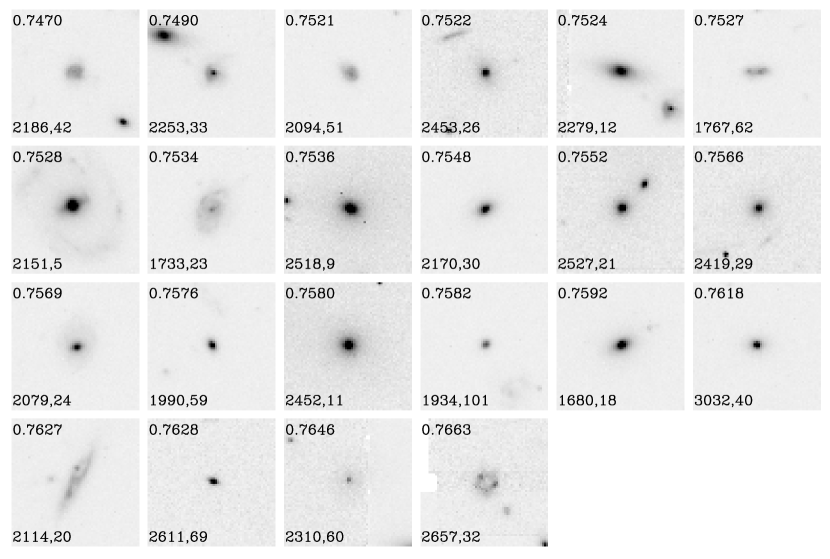
The Cl 1324+3011 field was observed by the WFPC2 in the F606W filter for 16.0 ks and the F814W filter for 32.0 ks in observations taken in 1995 (PI Westphal). We have obtained these data from the archive, reduced the observations, and measured the properties of all galaxies within the field. Details on the image reduction, object detection, and analyses of the galaxy morphological characteristics are described fully in Lubin et al. (2002; hereafter, Paper V). In this paper, we discuss only those galaxies in the HST image which are spectroscopically-confirmed cluster members. From the combined data of Paper IV and the new redshifts presented here, we find that there are 22 galaxies in the HST field-of-view which are spectroscopically-confirmed members of this cluster. In Figure 6, we show postage-stamp images of each of these galaxies taken from the composite F814W image. We have used data in this band to make a visual classification of these galaxies based on the Revised Hubble scheme (e.g., Sandage 1961, Sandage & Bedke 1994). The classifications and other relevant information, including some spectral characteristics, are listed in Table 3 (for more details on these parameters, see Papers III and V).
5.1 Spectral Properties
Twelve of these galaxies are classified as early-type (elliptical or S0) galaxies. As expected, their spectra are characterized by strong Ca II H & K and G-band absorption features. Consequently, nine of the twelve galaxies are given a spectral classification which is defined as strong Ca II K, , and G band features with little or no absorption (see §5.2 of Paper IV). The remaining three galaxies show more Balmer line activity and are classified as either or, in one case, (see Table 3). All but one of these early-type galaxies show little (less than 10Å rest equivalent width) or no [O II] emission. The luminosity-normalized star formation rates (SFRNs; see §7.2 of Paper IV) for the early-type galaxies are low, with a mean of 0.09 yr-1 per unit ABB luminosity. As expected, these galaxies are also distinguished by their reddest colors, with an average color of (see Paper V). The optical/near-infrared colors suggest that the stellar populations in these galaxies formed largely at , consistent with findings for local and moderate-redshift clusters (Papers II; III; IV; V).
The remaining cluster members are classified as either normal spiral or irregular/peculiar galaxies. The spectra of these galaxies show more star-formation activity with moderate-to-strong [O II], O III, and/or emission (see Table 1 of this paper and Table 2 of Paper IV). Eight of the ten galaxies have spectral classification of , , or indicating Balmer line activity (see Table 3). The mean rest-frame equivalent width of the [O II] emission is 16Å, and the mean SFRN is 0.59 yr-1 per unit ABB luminosity. These galaxies are also typically bluer than the early-type members, with an average color of .
5.2 The Cluster Morphological Fraction
Based on the 22 spectroscopically-confirmed cluster members with HST imaging, we measure an early-type fraction in Cl 1324+3011 of . As previously observed in other high-redshift clusters (e.g., Stanford et al. 1997, 1998; van Dokkum et al. 2000; Nelson et al. 2001; Paper II; Paper IV), the population of Cl 1324+3011 still contains a significant number of old, red, early-type galaxies; however, this fraction is lower by a factor of , compared to nearby rich clusters (Dressler 1980a,b; Andreon, Davoust & Helm 1997). This decline in early-type fraction is consistent with other studies of galaxy clusters at redshifts of (Dressler et al. 1997; Andreon et al. 1997; Fabricant et al. 2000; van Dokkum et al. 2000; Paper III). Consequently, our results, when combined with these previous observations, imply that the early-type fraction is strongly evolving with time.
This morphological evolution can clearly be seen in Figure 7 where we plot the early-type fraction versus cluster redshift for all currently available morphological studies of galaxy clusters between and (Dressler 1980a,b; Dressler et al. 1997; Andreon et al. 1997; Fabricant et al. 2000; van Dokkum et al. 2000; Paper III), including the new results for Cl 1324+3011 at . We note that all of the measurements for the moderate and high-redshift clusters have been made in roughly the same physical radius of kpc, corresponding to one WPFC2 pointing. Unlike our measurement and the others made at , Dressler et al. (1997) do not include galaxies which appeared extremely chaotic or insufficiently detailed to fit into a Revised Hubble type in their determination of the early-type fractions in their sample of ten clusters at . These “peculiar” galaxies account for only a few percent of the total and, therefore, do not affect their overall measurements (Dressler et al. 1997; Smail et al. 1997).
The local data points are derived from two sources. First, we use the data, presented in Dressler (1980a,b) and reanalyzed in Dressler et al. (1997), of the morphological fraction versus local surface density for a sample of 55 clusters at . Based on data given in Table 2 of Dressler et al. (1997), we calculate the median early-type fraction (and its associated uncertainty) in local clusters within regions of local surface density [i.e., log (galaxies/Mpc2) ] which are similar to those probed in the moderate and high-redshift clusters (see Dressler et al. 1997; Paper V). Second, we plot the measurement of the morphological mix in the central region ( Mpc) of the Coma cluster at made by Andreon et al. (1997). Both studies yield similar measures of the early-type fraction () in the central regions of nearby rich clusters.
Figure 7 clearly shows that the early-type fraction declines with redshift. At , the fraction is lower by a factor of , compared to local clusters. Consequently, the fraction of late-type (spiral, irregular, and peculiar) galaxies increases with redshift. This evolution implies that early-type galaxies are forming out of the excess of late-type galaxies over a timescale of Gyr. The observed evolution in the morphologies of the cluster galaxies is completely consistent with the photometric and spectral analyses of massive clusters at redshifts between and the present. In particular, Butcher & Oemler (1984) were the first to detect a progressive bluing of the cluster’s galaxy population with redshift. They found that the fraction of blue galaxies in a cluster is a strong function of redshift, increasing from in nearby clusters to in clusters at . HST imagery revealed that most of these blue galaxies are either normal spirals or have peculiar morphologies, resulting in late-type fractions which are times higher than the average current epoch cluster (Dressler et al. 1994, 1997; Couch et al. 1994; Oemler, Dressler & Butcher 1997; Fabricant et al. 2000). In addition, our spectral analysis of three clusters at shows a similar trend at even higher redshifts. We find a much higher fraction of blue, star-forming galaxies in the cluster population. Within the central Mpc, the fraction of active ([O II] rest equivalent widths greater than 15Å) galaxies is 45% (Paper IV). This fraction is substantially higher than the 10–20% active galaxy component seen in the centers of clusters at (Balogh et al. 1997).
6 Discussion
We have obtained additional spectroscopy for galaxies in the field of the massive cluster Cl 1324+3011 at . With these new data and those previously taken as part of our original cluster survey (Paper IV), we have now spectroscopically-confirmed 47 cluster members, of which 22 have available high-angular-resolution HST imaging and, therefore, have measured morphological properties. We have used these data to measure accurately the cluster velocity dispersion () and the fraction of early-type galaxies in the cluster galaxy population (). We find km s-1 and . Both of these quantities imply significant differences between Cl 1324+3011 and the average properties of local clusters of galaxies.
Firstly, Cl 1324+3011 does not follow the relation between X-ray luminosity and velocity dispersion observed in nearby and moderate-redshift clusters. We find that the X-ray luminosity of Cl 1324+3011 is low by a factor of for its velocity dispersion and, therefore, its estimated total mass. This cluster is typical of optically-selected clusters at redshifts of and seems to imply that the galaxies and the gas are no longer in thermal equilibrium. We expect such behavior if these clusters are still dynamically young. For example, at these early epochs, clusters of galaxies may still be in the process of merging. This process can result in a velocity dispersion which is inflated due to infalling matter or large scale structure, artificially implying a high mass. However, the X-ray emission can also evolve in a significant way if (1) subclumps in the process of cluster formation are not yet fully virialized or (2) subclumps are currently in the process of merging. In the former case, the gas will reside in lower-temperature (and lower-density) subclumps, substantially reducing its X-ray emission relative to the total mass within the region. In the latter case, the cluster would have a significant excess luminosity and temperature over that of non-merging clusters, which results from higher-density shocks between the merging cores (Ricker 1998; Ricker & Sarazin 2001; Sarazin 2001). These enhancements can be over 4–10 times in lumonisity and up to 3 times in temperature, and the effect can last at least one crossing time ( 1–2 Gyr).
There is, in fact, strong observational evidence that a large fraction (up to 75%) of clusters at are still in the process of forming and are, therefore, dynamically young (see e.g. Henry 2002). The signatures of this formation include double peaks, strong substructure, and/or a filamentary appearance in the distribution of galaxies, gas, and total mass (e.g., Lubin & Postman 1996; Henry et al. 1997; Luppino & Kaiser 1997; Donahue et al. 1998; Gioia et al. 1999; Della Ceca et al. 2000; Ebeling et al. 2000; Jeltema et al. 2001; Stanford et al. 2001; Hashimoto et al. 2002).
Despite evidence suggesting that most clusters at are not relaxed, there is no evidence that the average relation between X-ray luminosity and temperature has evolved with redshift. Using a sample of 11 X-ray–selected clusters, Holden et al. (2002) find no statistically significant evolution in the slope or zero-point of the relation at a median redshift of (see also Donahue et al. 1999; Della Ceca et al. 2000; Fairley et al. 2000; Arnaud, Aghanim & Neumann 2002). However, there may be preliminary indications that some clusters (for example, the double-peaked cluster RXJ 0152.7-1357 at ; Ebeling et al. 2000; Della Ceca et al. 2000; Lewis et al. 2002) do fall well off the relation. This behavior would be expected if the dynamical and evolutionary state of clusters at these early epochs is diverse, as indicated by some optical, X-ray, and weak-lensing studies.
As of yet, we have not been able to determine where optically-selected clusters at high redshift fall on the relation as none have been the subject of X-ray spectral observations. However, this situation will soon be rectified for Cl 1324+3011 as we are currently in the process of analyzing a 40 ksec XMM observation of this cluster. For the first time, we will have accurate information on the luminosity, temperature, and mass of an optically-selected cluster at . These data will go far in determining what physical processes are responsible for the differences between X-ray and optically-selected clusters at these redshifts.
Secondly, we measure an early-type fraction in Cl 1324+3011 which is lower by a factor of compared to that observed in nearby rich clusters (Dressler 1980a,b; Andreon et al. 1997). A decrease in the number of early-type galaxies was first observed by Dressler et al. (1997), Andreon et al. (1997), Fabricant et al. (2000), and van Dokkum et al. (2000) in massive clusters with redshifts between . The results for Cl 1324+3011, combined with these previous studies, show a general trend of decreasing early-type fraction with redshift. The most significant question raised by this evolution is what physical mechanisms associated with the cluster environment can transform disk galaxies into spheroids. Over the years, at least three plausible mechanisms have been suggested. The first is galaxy harassment which involves a high-speed encounter of a faint spiral (Sc or Sd) galaxy with the cluster tidal field or a brighter cluster galaxy. The tidal shock strips the stellar disk, producing a remnant consistent with the mass profiles of dwarf ellipticals (Moore, Lake & Katz 1998). The second is ram pressure stripping by the intracluster medium as an early spiral (Sa or Sb) galaxy enters the cluster potential. This interaction can result in either a burst or truncation of star formation (Gunn & Gott 1972; Abadi, Moore & Bower 1999; Poggianti et al. 1999). In both scenarios, the gas is eliminated, and the disk fades. The final mechanism is galaxy–galaxy merging. The morphological signatures of a merger between two disk galaxies, such a long, bright tidal tail, would be visible for only 1–2 Gyrs. After this time, the tidal debris becomes indistinguishable from the main merger remnant, a morphologically–normal elliptical galaxy (Schweizer 1986; Hibbard et al. 1994; Mihos 1995). Merging is unlikely to occur in the cluster environment because the velocities are too high; however, small groups of galaxies being accreted into the cluster are ideal sites for merging because the group velocity dispersion is on the order of the internal velocity of the member galaxies (Aarseth & Fall 1980; Barnes 1985; Merritt 1985).
At least two of these processes require infall of individual galaxies and/or galaxy groups into the cluster environment. Since the field population is comprised mainly of spiral and irregular galaxies (e.g Driver et al. 1995; Abraham et al. 1996), infall is the natural means for providing a reservoir of late-type galaxies. Simulations predict that clusters should form at the intersections of large scale sheets and filaments (Shandarin & Zel’dovich 1989) through the accretion of smaller subclumps from the surrounding environment (Evrard 1990; Lacey & Cole 1993, 1994). Semi-analytic models show that the accretion rates increase strongly with look-back time. In early stages of cluster formation, the infall rate is up to a factor of higher than in present-day clusters (Kauffmann 1995). Observationally, the strong substructure and filamentary nature in a large fraction of clusters at (see above) suggests that clusters are actively forming at these redshifts.
These results indicate that infall regions are likely to be active sites of galaxy evolution. Unfortunately, the field-of-view of WFPC2, which is only , has strongly limited morphological studies in these regions. Because of these constraints, only one morphological study of a high-redshift cluster has extended beyond the central Mpc (i.e. a single WFPC2 pointing), that of the very X-ray luminous cluster MS 1054.4-0321 at (van Dokkum et al. 1999, 2000). This WFPC2 study, which covered a 2.7 1.8 Mpc2 area in the F606W and F814W filters, has revealed some stunning results. The authors find that 17% of the cluster population is comprised of ongoing mergers which will likely evolve into luminous () early-type galaxies. These mergers are preferentially found in the outskirts of the cluster, indicating they probably reside in cold infalling clumps. If the galaxy population in MS1054.4-0321 is typical for its redshift, 50% of the early-type galaxies in present-day clusters have experienced a major merger at . The crucial question is whether MS1054.4-0321 is typical of other clusters at these redshifts. In order to convincingly discriminate between the physical processes which can transform galaxy morphologies in this environment, it is necessary to study galaxy properties at large radii for a statistical sample of high-redshift clusters. We expect significant progress to be made on this front with the wide-area capability of the Advanced Camera for Surveys which was placed aboard HST this year.
References
- (1) Aarseth, S.J. & Fall, S.M. 1980, ApJ, 236, 43
- (2) Abadi, M.G., Moore, B., & Bower, R.G. 1999, MNRAS, 308, 947
- (3) Abell, G.O. 1958, ApJS, 232, 689
- (4) Abell, G.O., Corwin, H., & Olowin, R. 1989, ApJS, 70,
- (5) Abraham, R.G., van den Bergh, S., Glazebrook, K., Ellis, R.S., Santiago, B.X., Surma, P. & Griffiths, R.E. 1996, ApJ, 107, 1
- (6) Andreon, S., Davoust, E. & Heim, T. 1997, A&A, 323, 337
- (7) Aragón-Salamanca, A., Ellis, R.S. & Sharples, R.M. 1991, MNRAS, 248, 12
- (8) Aragón-Salamanca, A., Ellis, R.S., Couch, W.J., & Carter, D. 1993, MNRAS, 262, 764
- (9) Arnaud, M., Aghanim, N., & Neumann, D.M. 2002, A&A, in press (astro-ph/0110428)
- (10) Bahcall, N.A. 1981, ApJ, 247, 787
- (11) Bahcall, N.A. & Fan, X. 1998, ApJ, 504, 1
- (12) Balogh, M.L., Morris, S.L., Yee, H.K.C., Carlberg, R.G., & Ellingson, E. 1997, ApJ, 488, L 75
- (13) Balogh, M.L., Schade, D., Morris, S.L., Yee, H.K.C., Carlberg, R.G., & Ellingson, E. 1998, ApJ, 504, L75
- (14) Barnes, J. 1985, MNRAS, 215, 517
- (15) Beers, T.C., Flynn, K., & Gebhardt, K. 1990, AJ, 100, 32.
- (16) Borgani, S. et al. 2001, ApJ, 561, 13
- (17) Bower, R.G., Lucey, J.A. & Ellis, R.S. 1992a, MNRAS, 254, 589
- (18) Bower, R.G., Lucey, J.A. & Ellis, R.S. 1992b, MNRAS, 254, 601
- (19) Bower, R.G., Bohringer, H., Brierl, U.G., Ellis, R.S., Castander, F.J., & Couch, W.J. 1994, MNRAS, 268, 345
- (20) Bower, R.G., Castander, F.J., Couch, W.J., Ellis, R.S., & Bohringer, H. 1997, MNRAS, 291, 353
- (21) Bower, R.G., Kodama, T., & Terlevich, A. 1998, MNRAS, 299, 1193
- (22) Brunner, R.J. & Lubin, L.M. 2000, AJ, 120, 2851
- (23) Butcher, H. & Oemler, A. 1984, ApJ, 285, 426
- Carlberg et al. (1996) Carlberg, R.G., Yee, H.K.C., Ellingson, E., Abraham, R., Gravel, P., Morris, S., & Pritchet, C.J. 1996, ApJ, 462, 32
- (25) Carlberg, R.G., Morris, S.L., Yee, H.K.C., & Ellingson, E. 1997, ApJ, 479, 19
- (26) Castander, F.J., Ellis, R.S., Frenk, C.S., Dressler, A. & Gunn, J.E. 1994, ApJ, 424, L79
- Couch et al. (1991) Couch, W.J., Ellis, R. S., Maclaren, I., Malin, D. F. 1991, MNRAS, , 249, 606
- (28) Couch, W.J., Ellis, R.S., Sharples, R.M. & Smail, I. 1994, ApJ, 430, 121
- (29) Danese, L., DeZotti, G., & Tullio, G. 1980, A&A, 82, 322
- (30) Della Ceca, R., Scaramella, R., Gioia, I.M., Rosati, P., Fiore, F., & Squires, G. 2000, A&A, 353, 498
- (31) Donahue, M. 1996, ApJ, 467, 79
- (32) Donahue, M., Voit, M.G., Gioia, I., Luppino, G., Hughes, J.P., & Stocke, J.T. 1998, ApJ, 502, 550
- (33) Dressler, A. 1980a, ApJ, 236, 351
- (34) Dressler, A. 1980b, ApJS, 42, 565
- (35) Dressler, A., Oemler, A., Butcher, H.R., & Gunn, J.E. 1994, ApJ, 430, 107
- (36) Dressler, A., Oemler, A., Couch, W.J., Smail, I., Ellis, R.E., Barger, A., Butcher, H., Poggianti, B.M., & Sharples, R.M. 1997, ApJ, 490, 57
- (37) Dressler, A., Smail, I., Poggianti, B. M., Butcher, H., Couch, W. J., Ellis, R. S., Oemler, A., 1999, ApJS, 122, 51
- (38) Driver, S.P., Windhorst, R.A., Ostrander, E.J., Keel, W.C., Griffiths, R.E. & Ratnatunga, K.U. 1995, ApJ, 449, L23
- (39) Ebeling, H., Edge, A.C., Fabian, A.C., Allen, S.W., Crawford, C.S., & Boehringer, H. 1997, ApJ, 479, 101
- (40) Ebeling, H., Jones, L.R., Perlman, E., Scharf, C., Horner, D., Wegner, G., Malkan, M., Fairly, B.W., & Mullis, C.R. 2000, ApJ, 534, 133
- (41) Ebeling, H., Jones, L.R., Fairly, B.W., Perlman, E., Scharf, C., & Horner, D. 2001, ApJ, 548, L23
- (42) Edge, A.C., Stewart, G.C., Fabian, A.C., & Arnaud, K.A. 1990, MNRAS, 245, 58
- (43) Edge, A.C. & Stewart, G.C. 1991, MNRAS, 252, 428
- (44) Ellis, R.S., Smail, I., Dressler, A., Couch, W.J., Oemler, A., Butcher, H., & Sharples, R. 1997, ApJ, 483, 582
- (45) Evrard, A.E. 1990, ApJ, 363, 349
- (46) Fabricant, D., Franx, M., & van Dokkum, P.G. 2000, ApJ, 537, 577
- (47) Fairley, B.W., Jones, L.R., Scharf, C., Ebeling, H., Perlman, E., Horner, D., Wegner, G., & Malkan, M. 2000, MNRAS, 315, 669
- (48) Giacconi, R. et al. 2001, ApJ, 551, 624
- (49) Gioia, I.M., Maccacaro, T., Schild, R.E., Wolter, A., Stocke, J.T., Morris, S.L., & Henry, J.P. 1990, ApJS, 72, 567
- (50) Gioia, I.M., Henry, J.P., Mullis, C.R., Ebeling, H., & Wolter, A. 1999, AJ, 117, 2608
- (51) Gunn, J.E., & Gott, J.R. 1972, ApJ, 176, 1
- (52) Gunn, J.E., Hoessel, J.G., & Oke, J.B. 1986, ApJ, 306, 30
- (53) Hashimoto, Y., Hasinger, G., Arnaud, M., Rosati, P., & Miyaji, T. 2002, A&A, 381, 841
- (54) Hibbard, J.E., Guhathakurta, P., van Gorkom, J.H., & Schweizer, F. 1994, AJ, 107, 67
- (55) Henry, J.P. 2002, in AMiBA 2001: High-z Clusters, Missing Baryons, and CMB Polarization, eds. L.W. Chen et al. ASP Conference Series
- (56) Henry, J.P., Gioia, I.M., Maccacaro, T., Morris, S.L., Stocke, J.T. & Wolter, A. 1992, ApJ, 386, 408
- (57) Henry, J.P., Gioia, I.M., Mullis, C.R., Clowe, D.I., Luppino, G.A., Boehringer, H., Brierl, U.G., Voges, W., & Huchra, J.P. 1997, AJ, 114, 1293
- (58) Holden, B.P., Romer, A.K., Nichol, R.C., & Ulmer, M.P. 1997, AJ, 114, 1701
- (59) Holden, B.P., Stanford, S.A., Squires, G.K., Rosati, P., Tozzi, P., Eisenhardt, P., & Spinrad, H. 2002, AJ, in press (astro-ph/0203474)
- (60) Jeltema, T.E., Canizares, C.R., Bautz, M.W., & Malm, M.R. 2001. ApJ, 562, 124
- (61) Jones, L.R., Scharf, C., Ebeling, H., Perlman, E., Wegner, G., Malkan, M., & Horner, D. 1998, ApJ, 495, 100
- (62) Kauffmann, G. 1995, MNRAS, 274, 153
- (63) Lacey, C. & Cole, S. 1993, MNRAS, 262, 627
- (64) Lacey, C. & Cole, S. 1994, MNRAS, 271, 676
- (65) Lewis, A.D., Stocke, J.T., Ellingson, E., Gaidos, E.J. 2002, ApJ, 566, 744
- (66) Lubin, L.M. 1996, AJ, 112, 23
- (67) Lubin, L.M., & Postman, M. 1996, AJ, 111, 1795
- (68) Lubin, L.M., Postman, M., Oke, J.B., Ratnatunga, K.U., Gunn, J.E., Hoessel, J.G., & Schneider, D.P. 1998, AJ, 116, 584 (Paper III)
- (69) Lubin, L.M., Postman, M., Oke, J.B., Brunner, R., Gunn, J.E., & Schneider, D.P. 2002, AJ, in preparation (Paper V)
- (70) Luppino, G.A., & Gioia, I.M. 1995, ApJ, 445, 77
- (71) Luppino, G.A., & Kaiser, N. 1997, ApJ, 475, 20
- (72) Merritt, D. 1985, ApJ, 289, 18
- (73) Mihos, J.C. 1995, ApJ, 438, L45
- (74) Moore, B., Lake, G., & Katz, N. 1998, ApJ, 495, 139
- (75) Mushotzky, R.F. & Scharf, 1997, ApJ, 482, 16
- (76) Nelson, A.E., Gonzales, A.H., Zaritsky, D., & Dalcanton, J.J. 2001, ApJ, 566, 103
- (77) Nichol, R.C., Holden, B.P., Romer, A.K., Ulmer, M.P., Burke, D.J., & Collins, C.A. 1997, ApJ, 481, 644
- (78) Oke, J.B. 1990, AJ, 99, 1621
- (79) Oke, J.B. et al. 1995, PASP, 107, 375
- (80) Oke, J.B., Postman, M., & Lubin, L.M. 1998, AJ, 116, 549 (Paper I)
- (81) Oemler, A., Dressler, A., & Butcher, H. 1997, AJ, 474, 561
- (82) Poggianti, B.M., Smail, I., Dressler, A., Couch, W.J., Barger, A.J., Butcher, H., Ellis, R.S., & Oemler, A. 1999, ApJ, 518, 576
- (83) Postman, M. & Geller, M.J. 1984, ApJ, 281, 95
- (84) Postman, M., Lubin, L. M., Gunn, J. E., Oke, J. B., Hoessel, J. G., Schneider, D. P. & Christensen, J. 1996, AJ, 111, 615
- (85) Postman, M., Lubin, L.M., & Oke, J.B. 1998, AJ, 116, 560 (Paper II)
- (86) Postman, M., Lubin, L.M., & Oke, J.B. 2001, AJ, 122, 1125 (Paper IV)
- (87) Postman, M., Lauer, T.R., Oegerle, W., & Donahue, M. 2002, ApJ, submitted
- (88) Ricker, P.M. 1998, ApJ, 496, 670
- (89) Ricker, P.M., & Sarazin, C.L. 2001, ApJ, 561, 621
- (90) Rosati, P., Della Ceca, R., Norman, C., & Giacconi, R. 1998, ApJ, 492, L21
- (91) Sandage, A. 1961, The Hubble Atlas, The Carnegie Institution of Washington Publication
- (92) Sandage, A. & Bedke, J. 1994, The Carnegie Atlas of Galaxies, The Carnegie Institution of Washington Publication
- (93) Sarazin, C.L. 2001, in Galaxy Clusters and the High Redshift Universe Observed in X-rays, eds. D. Newmann et al., Proceedings of XXI Moriond Conference
- (94) Schweizer, F. 1986, Science, 231, 227
- (95) Shandarin, S. & Zel’dovich, Y. 1989, Rev Mod Phys, 61, 18
- Smail et al. (1997) Smail, I., Dressler, A., Couch, W. J., Ellis, R. S., Oemler, A., Butcher, H., Sharples, R. M. 1997 ApJS, 110, 213
- (97) Stanford, S.A., Eisenhardt, P.R.M., & Dickinson, M. 1995, ApJ, 450, 512
- (98) Stanford, S.A., Eisenhardt, P.R.M., & Dickinson, M. 1998, ApJ, 492, 461
- (99) Stanford, S.A., Elston, R., Eisenhardt, P.R., Spinrad, H., Stern, D., & Dey, A. 1997, AJ, 114, 2232
- (100) Stanford, S.A., Holden, B., Rosati, P., Tozzi, P., Borgani, S., Eisenhardt, P.R., & Spinrad, H. 2001, ApJ, 552, 504
- (101) Stanford, S.A., Holden, B., Rosati, P., Eisenhardt, P.R., Stern, D., Squires, G.K., & Spinrad, H. 2002, AJ, 123, 619
- (102) Struble, M.F. & Rood, H.J. 1991, ApJS, 77, 363
- (103) van Dokkum, P.G., Franx, M., Fabricant, D., Kelson, D.D., & Illingworth, G.D. 1999, ApJ, 520, 95
- (104) van Dokkum, P.G., Franx, M., Fabricant, D., Illingworth, G.D., & Kelson, D.D. 2000, ApJ, 541, 95
- (105) van Dokkum, P.G., Stanford, S.A., Holden, B.P., Eisenhardt, P.R., Dickinson, M., & Elston, R. 2001, ApJ, 552, 101
- (106) Zwicky, F., Herzog, E., Wild, P., Karpowicz, M., & Kowal, C.T. 1961, Catalog of Galaxies and Clusters of Galaxies, Vols. 1-6 (Pasadena : California Institute of Technology)
| ID# | z | Q | b | tau | Sp | Age | [OII] | H | [OIII] | SFR | |||||||
|---|---|---|---|---|---|---|---|---|---|---|---|---|---|---|---|---|---|
| (1) | (2) | (3) | (4) | (5) | (6) | (7) | (8) | (9) | (10) | (11) | (12) | (13) | (14) | (15) | (16) | (17) | (18) |
| 37 | 22.73 | 21.84 | 21.49 | 21.11 | 0.2166 | 4 | 5.49 | 5.0 | 2.4 | 20.3 | 14.4 | 0.000 | -18.11 | ||||
| 292 | 25.52 | 24.74 | 23.72 | 23.54 | 1.1838 | 1 | 6.52 | 1.0 | 2.6 | -21.49 | |||||||
| 297 | 24.47 | 23.97 | 23.31 | 22.91 | 0.4852 | 4 | 5.88 | 5.0 | 1.7 | -8.8 | -27.1 | 0.533 | -18.45 | ||||
| 469 | 25.53 | 25.12 | 24.13 | 23.38 | 1.0798 | 2 | 7.73 | 0.6 | 3.0 | -82.4 | 5.439 | -20.79 | |||||
| 478 | 25.12 | 23.51 | 22.48 | 0.8455 | 1 | 0.1 | -38.6 | 0.51 | -0.01 | 0.000 | |||||||
| 546 | 23.48 | 22.99 | 22.62 | 22.10 | 0.2033 | 4 | 4.99 | 10.0 | 1.9 | -38.9 | -182.3 | 0.915 | -16.93 | ||||
| 570 | 24.90 | 25.57 | 23.10 | 21.99 | 0.3919 | 2 | 10.01 | 0.2 | 9.0 | 2.6 | -2.0 | 0.034 | -17.98 | ||||
| 652 | 26.01 | 28.74 | 23.70 | 23.05 | 9.0000 | 0 | |||||||||||
| 715* | 27.29 | 26.45 | 23.23 | 21.38 | 0.7509 | 3 | 15.79 | 11.0 | 1.0 | -5.1 | 1.4 | 1.54 | 0.58 | 0.000 | -20.70 | ||
| 762 | 26.04 | 25.34 | 23.85 | 22.72 | 9.0000 | 0 | 10.63 | -17.16 | |||||||||
| 828 | 29.00 | 27.37 | 21.19 | 19.41 | 0.4219 | 4 | 14.76 | 11.0 | 2.5 | 1.6 | 0.000 | -20.39 | |||||
| 835 | 26.09 | 25.54 | 24.30 | 23.66 | 1.3996 | 2 | 8.13 | 0.6 | 3.2 | -32.9 | 5.542 | ||||||
| 934 | 26.73 | 22.68 | 21.31 | 0.7849 | 3 | 0.1 | -13.6 | -2.4 | -10.2 | 0.91 | 0.17 | 0.000 | |||||
| 985 | 24.13 | 24.03 | 23.55 | 22.41 | 1.0530 | 2 | 6.86 | 1.0 | 2.6 | -22.0 | 2.517 | -21.32 | |||||
| 1040 | 22.10 | 21.79 | 21.37 | 21.09 | 0.5952 | 4 | 4.11 | long | 1.1 | -57.3 | -15.1 | -47.2 | 0.99 | 0.48 | 6.275 | -20.94 | |
| 1050 | 23.01 | 22.63 | 22.30 | 21.94 | 0.4815 | 4 | 4.04 | long | 1.0 | -64.6 | -11.4 | -34.2 | 0.81 | 0.43 | 1.651 | -19.49 | |
| 1085 | 24.16 | 23.73 | 23.82 | 23.38 | 0.4810 | 3 | 2.32 | long | 0.3 | -4.1 | 3.0 | -22.1 | 0.033 | -18.02 | |||
| 1154 | 25.16 | 24.30 | 23.84 | 22.82 | 0.6444 | 4 | 8.20 | 1.5 | 2.6 | -45.2 | 6.8 | -17.4 | 1.96 | 0.81 | 0.651 | -18.99 | |
| 1247 | 22.36 | 21.01 | 24.09 | 23.50 | 9.0000 | 0 | |||||||||||
| 1484 | 25.93 | 24.73 | 25.57 | 23.93 | 9.0000 | 0 | 5.81 | ||||||||||
| 1499 | 23.95 | 23.91 | 23.47 | 22.74 | 9.0000 | 0 | 4.22 | ||||||||||
| 1593* | 24.94 | 24.48 | 23.95 | 22.96 | 0.7552 | 4 | 7.40 | 1.5 | 2.2 | -61.1 | -2.2 | -16.6 | 1.02 | 0.24 | 1.329 | -19.43 | |
| 1634* | 25.59 | 25.68 | 23.34 | 21.60 | 0.7548 | 4 | 14.62 | 1.0 | 11.0 | -20.58 | |||||||
| 1713 | 25.31 | 25.09 | 24.82 | 23.68 | 9.0000 | 0 | 5.92 | ||||||||||
| 1721* | 24.26 | 23.62 | 22.89 | 21.86 | 0.7536 | 2 | 8.71 | 1.5 | 2.8 | -22.3 | -9.3 | 7.3 | 0.80 | 0.07 | 1.261 | -20.55 | |
| 1792* | 24.44 | 24.02 | 23.74 | 22.99 | 0.7576 | 1 | 5.09 | 3.5 | 1.6 | -19.3 | 0.37 | 0.06 | 0.508 | -19.52 | |||
| 1889 | 25.50 | 24.53 | 22.74 | 21.23 | 9.0000 | 0 | 13.02 | -21.65 | |||||||||
| 1934* | 24.85 | 24.63 | 23.89 | 22.66 | 0.7582 | 4 | 8.58 | 1.5 | 2.6 | -21.1 | -3.2 | -1.6 | 0.99 | 0.16 | 0.525 | -19.64 | |
| 1978 | 22.34 | 21.98 | 21.77 | 21.00 | 0.9418 | 4 | 4.78 | 2.0 | 1.7 | -10.4 | 3.474 | -22.33 | |||||
| 2079* | 23.88 | 23.25 | 22.58 | 21.38 | 0.7569 | 4 | 9.54 | 1.0 | 3.0 | -6.7 | -0.5 | 0.85 | 0.33 | 0.541 | -20.95 | ||
| 2094* | 24.27 | 23.89 | 23.30 | 22.57 | 0.7521 | 4 | 6.26 | 2.0 | 2.0 | -21.4 | -6.3 | 0.97 | 0.30 | 0.800 | -19.98 | ||
| 2170* | 26.90 | 23.92 | 23.07 | 21.46 | 0.7548 | 4 | 13.36 | 0.2 | 7.0 | 0.8 | 0.4 | 4.4 | 1.03 | 0.49 | 0.000 | -20.76 | |
| 2189 | 23.34 | 23.00 | 22.72 | 22.05 | 1.0783 | 2 | 4.50 | 1.2 | 2.2 | -20.4 | 4.579 | -22.00 | |||||
| 2280* | 25.23 | 24.97 | 24.47 | 23.10 | 0.7471 | 4 | 8.38 | 1.5 | 2.6 | -19.09 | |||||||
| 2445 | 24.15 | 23.72 | 23.72 | 22.93 | 0.6377 | 4 | 3.95 | long | 1.1 | -62.9 | -1.3 | -22.6 | 1.20 | 0.41 | 1.151 | -18.98 | |
| 2518* | 23.99 | 22.22 | 21.33 | 19.81 | 0.7536 | 4 | 12.69 | 0.6 | 5.0 | 2.4 | 2.9 | -7.0 | 0.85 | 0.46 | 0.000 | -22.42 | |
| 2542* | 27.03 | 24.61 | 23.94 | 22.79 | 0.7671 | 3 | 10.10 | 1.0 | 3.5 | -8.0 | -2.4 | 1.41 | 0.44 | 0.186 | -19.68 | ||
| 2709 | 22.75 | 22.19 | 21.60 | 20.65 | 0.6514 | 4 | 7.77 | 2.0 | 2.4 | 4.4 | 2.1 | -0.6 | 0.57 | 0.000 | -21.23 | ||
| 2711 | 24.12 | 23.26 | 22.68 | 21.12 | 9.0000 | 0 | 11.98 | ||||||||||
| 2846 | 25.82 | 24.63 | 23.81 | 22.24 | 0.6200 | 2 | 12.96 | 0.2 | 9.0 | -55.8 | 5.6 | -12.8 | 1.32 | 0.54 | 0.678 | -19.13 | |
| 2855 | 24.35 | 23.66 | 23.15 | 22.44 | 0.9376 | 2 | 6.64 | 1.5 | 2.4 | -13.6 | 0.01 | -0.00 | 1.275 | -21.07 | |||
| 2951 | 24.65 | 24.67 | 24.33 | 23.43 | 0.6922 | 4 | 4.13 | 10.0 | 1.3 | -61.1 | -3.0 | -25.5 | 1.15 | 0.22 | 0.787 | -18.64 | |
| 2969 | 24.94 | 23.52 | 22.59 | 9.0000 | 0 | ||||||||||||
| 3072 | 22.98 | 22.42 | 22.30 | 21.46 | 0.5244 | 1 | 5.26 | 5.0 | 1.6 | 0.9 | -3.7 | 0.260 | -19.89 | ||||
| 3086 | 23.61 | 22.19 | 21.15 | 19.73 | 0.6428 | 4 | 12.32 | 0.0 | -1.9 | 3.1 | -1.8 | 0.84 | 14.790 | -22.63 | |||
| 3175 | 26.92 | 24.87 | 24.82 | 22.89 | 9.0000 | 0 | |||||||||||
| 3191 | 24.97 | 25.16 | 9.0000 | 0 | |||||||||||||
| 3309 | 25.05 | 24.91 | 24.11 | 23.32 | 9.0000 | 0 | 6.50 | -17.95 | |||||||||
| 3514 | 25.92 | 24.39 | 23.58 | 22.23 | 0.6438 | 3 | 11.65 | 0.8 | 5.0 | 1.1 | -0.5 | -3.3 | 1.67 | 0.94 | 0.000 | -19.40 | |
| 3539 | 24.06 | 23.64 | 23.46 | 23.08 | 9.0000 | 0 | 3.47 | -13.49 | |||||||||
| 3641 | 9.0000 | 0 | |||||||||||||||
| 3650 | 24.49 | 23.97 | 24.18 | 23.81 | 9.0000 | 0 | 1.90 | -14.02 | |||||||||
| 3705* | 24.49 | 23.84 | 23.85 | 22.55 | 0.7524 | 4 | 7.03 | 1.5 | 2.2 | -67.1 | -7.5 | -13.1 | 1.54 | 0.22 | 1.925 | -19.73 | |
| 3711 | 24.73 | 23.30 | 22.46 | 20.62 | 0.0000 | 4 | 15.09 | 0.1 | |||||||||
| 3833 | 9.0000 | 0 | |||||||||||||||
| 3865* | 26.17 | 24.90 | 23.56 | 22.01 | 0.7522 | 4 | 13.43 | 0.6 | 5.0 | -11.7 | 9.4 | -15.6 | 1.57 | 0.55 | 0.383 | -20.18 | |
| 3922 | 24.49 | 24.25 | 24.07 | 22.81 | 0.9823 | 2 | 6.19 | 1.0 | 2.4 | -20.54 | |||||||
| 4013 | 27.37 | 24.92 | 25.87 | 9.0000 | 0 | ||||||||||||
| 4033 | 24.67 | 24.44 | 23.89 | 22.89 | 9.0000 | 0 | 6.70 | -18.79 | |||||||||
| 4144 | 24.71 | 24.16 | 23.78 | 22.86 | 0.8104 | 4 | 6.68 | 2.0 | 2.2 | -86.8 | -12.6 | 0.91 | 0.08 | 2.815 | -19.89 | ||
| 4162 | 25.86 | 23.92 | 22.83 | 21.40 | 0.7319 | 3 | 12.40 | 0.6 | 5.0 | -7.1 | 1.15 | 0.41 | 0.392 | -20.74 | |||
| 4239 | 9.0000 | 0 | |||||||||||||||
| 4278* | 24.81 | 24.66 | 24.39 | 23.66 | 0.7687 | 1 | 3.74 | 10.0 | 1.3 | -13.4 | 0.06 | -0.03 | 0.206 | -18.87 | |||
| 4324 | 9.0000 | 0 | |||||||||||||||
| 4348 | 23.52 | 23.24 | 23.02 | 22.15 | 0.9809 | 4 | 4.82 | 1.3 | 1.9 | -23.6 | 0.95 | 0.56 | 2.943 | -21.27 | |||
| 4485 | 25.09 | 24.52 | 22.97 | 22.48 | 0.7035 | 4 | 7.17 | 2.0 | 2.4 | -43.7 | 1.0 | 1.0 | 1.16 | 3.00 | 1.712 | -20.07 | |
| 4524 | 25.42 | 24.27 | 24.19 | 23.62 | 9.0000 | 0 | |||||||||||
| 4632 | 22.63 | 22.31 | 22.24 | 22.04 | 9.0000 | 0 | 2.19 |
| ID# | z | Q | b | tau | Sp | Age | [OII] | H | [OIII] | SFR | |||||||
|---|---|---|---|---|---|---|---|---|---|---|---|---|---|---|---|---|---|
| (1) | (2) | (3) | (4) | (5) | (6) | (7) | (8) | (9) | (10) | (11) | (12) | (13) | (14) | (15) | (16) | (17) | (18) |
| 814 | 25.36 | 25.25 | 24.49 | 23.39 | 0.7511 | 3 | 7.58 | 1.6 | 2.4 | -59.4 | 0.80 | -18.93 | |||||
| 849 | 24.90 | 24.82 | 24.19 | 23.38 | 0.7506 | 2 | 5.67 | 2.0 | a | 1.7 | -111.3 | 0.12 | 0.07 | 1.86 | -19.06 | ||
| 1680 | 24.99 | 23.39 | 22.35 | 21.02 | 0.7592 | 4 | 11.63 | 0.9 | k | 4.0 | 3.4 | 5.0 | -9.2 | 0.39 | 0.45 | 0.00 | -21.31 |
| 1733 | 23.73 | 22.75 | 22.27 | 21.31 | 0.7534 | 4 | 8.14 | 1.6 | k+a | 2.4 | -13.2 | -5.9 | -3.6 | 0.62 | 0.20 | 1.31 | -21.11 |
| 1767 | 24.58 | 23.88 | 23.30 | 22.34 | 0.7527 | 4 | 8.04 | 1.4 | a+k | 2.6 | -37.9 | -11.2 | -26.5 | 0.28 | 0.09 | 1.47 | -20.12 |
| 1990 | 26.91 | 24.58 | 23.45 | 21.87 | 0.7576 | 4 | 13.57 | 0.4 | k | 5.0 | 2.1 | -1.5 | -3.4 | 0.46 | 0.44 | 0.00 | -20.37 |
| 2114 | 22.92 | 22.57 | 22.13 | 21.37 | 0.7627 | 4 | 5.62 | 2.0 | a+k | 1.7 | -8.7 | 2.7 | -3.5 | 0.34 | 0.15 | 1.02 | -21.18 |
| 2151 | 23.68 | 22.27 | 21.22 | 19.82 | 0.7528 | 4 | 12.06 | 0.9 | k | 4.0 | -4.9 | 6.3 | 1.5 | 0.52 | 0.53 | 1.35 | -22.43 |
| 2186 | 23.13 | 22.88 | 22.60 | 21.89 | 0.7470 | 4 | 4.30 | 5.0 | a+k | 1.4 | -7.4 | 2.7 | 6.3 | 0.51 | 0.18 | 0.53 | -20.59 |
| 2253 | 22.94 | 22.73 | 22.30 | 21.74 | 0.7490 | 4 | 4.37 | 5.0 | a | 1.4 | -26.5 | -9.1 | -9.4 | 0.47 | 0.11 | 2.42 | -20.84 |
| 2279 | 24.61 | 23.18 | 22.15 | 20.68 | 0.7524 | 4 | 12.52 | 0.7 | k | 5.0 | 1.4 | 7.0 | 6.8 | 0.43 | 0.48 | 0.00 | -21.57 |
| 2310 | 24.95 | 23.94 | 23.03 | 21.79 | 0.7646 | 4 | 10.77 | 1.1 | a+k | 3.5 | -2.3 | 7.6 | -10.8 | 0.70 | 0.32 | 0.12 | -20.59 |
| 2331 | 23.12 | 22.98 | 22.80 | 22.20 | 0.7567 | 1 | 2.91 | long | a | 0.9 | -41.2 | 0.28 | 0.14 | 2.56 | -20.31 | ||
| 2419 | 25.15 | 23.50 | 22.45 | 20.96 | 0.7566 | 4 | 12.82 | 0.7 | k | 5.0 | 3.8 | -12.9 | -13.4 | 0.49 | 0.57 | 0.00 | -21.30 |
| 2452 | 24.25 | 22.49 | 21.46 | 19.96 | 0.7580 | 4 | 12.66 | 0.7 | k | 5.0 | -0.9 | 2.3 | 5.8 | 0.35 | 0.44 | 0.20 | -22.30 |
| 2453 | 25.79 | 23.66 | 22.65 | 21.15 | 0.7522 | 4 | 12.71 | 0.7 | k | 5.0 | 0.2 | 5.0 | 1.3 | 0.33 | 0.45 | 0.00 | -21.07 |
| 2527 | 24.87 | 23.14 | 21.87 | 20.23 | 0.7552 | 4 | 14.03 | 0.2 | k | 8.0 | -2.4 | 7.0 | -0.2 | 0.38 | 0.47 | 0.38 | -21.97 |
| 2611 | 24.47 | 24.30 | 24.07 | 22.39 | 0.7628 | 4 | 8.29 | 1.4 | k | 2.4 | -9.2 | 17.1 | 19.6 | 0.53 | 0.37 | 0.27 | -19.79 |
| 2657 | 23.28 | 22.77 | 22.42 | 21.60 | 0.7663 | 4 | 6.07 | 2.0 | k+a | 1.9 | -28.1 | -6.7 | -10.9 | 0.59 | 0.23 | 2.60 | -20.95 |
| 2684 | 23.43 | 23.01 | 22.72 | 21.85 | 0.7654 | 1 | 5.62 | 2.0 | a | 1.7 | -39.9 | -14.6 | -23.5 | 0.37 | 0.10 | 2.86 | -20.65 |
| 2747 | 26.65 | 23.65 | 22.83 | 21.28 | 0.7486 | 4 | 13.00 | 0.4 | k | 6.0 | -0.8 | 0.9 | 9.4 | 0.61 | 0.51 | 0.05 | -20.92 |
| 2921 | 25.27 | 23.72 | 22.74 | 21.39 | 0.7564 | 4 | 11.66 | 0.9 | k | 4.0 | 1.9 | 11.7 | -7.3 | 0.45 | 0.48 | 0.00 | -20.91 |
| 2932 | 26.38 | 24.66 | 23.76 | 22.80 | 0.7552 | 4 | 9.09 | 1.4 | k+a | 3.0 | -3.5 | 2.7 | -13.7 | 0.34 | 0.32 | 0.09 | -19.68 |
| 3032 | 25.64 | 23.99 | 23.42 | 21.75 | 0.7618 | 4 | 13.30 | 0.7 | k+a | 5.0 | 2.6 | 10.5 | 1.7 | 0.57 | 0.37 | 0.00 | -20.47 |
| 3505 | 23.48 | 22.63 | 21.94 | 20.75 | 0.7494 | 4 | 9.84 | 1.2 | k+a | 3.2 | -18.2 | -4.7 | 0.5 | 0.50 | 0.30 | 2.50 | -21.58 |
| 3632 | 27.61 | 25.78 | 24.96 | 22.87 | 0.7576 | 0 | 16.80 | 2.0 | 4.0 | -34.8 | 0.41 | -19.20 | |||||
| 3651 | 23.33 | 22.26 | 21.40 | 20.00 | 0.7513 | 4 | 11.68 | 0.9 | k+a | 4.0 | -2.5 | 5.7 | -1.7 | 0.66 | 0.34 | 0.59 | -22.25 |
| 3822 | 24.41 | 23.18 | 22.30 | 21.00 | 0.7576 | 4 | 11.20 | 0.9 | k | 3.8 | -0.7 | 2.8 | -1.6 | 0.50 | 0.35 | 0.07 | -21.33 |
| 4061 | 25.21 | 23.24 | 22.42 | 21.07 | 0.7556 | 4 | 11.51 | 0.9 | k | 4.0 | -0.4 | 1.0 | -0.2 | 0.57 | 0.49 | 0.00 | -21.23 |
| 4097 | 24.86 | 23.83 | 23.28 | 22.13 | 0.7524 | 3 | 9.44 | 1.2 | a+k | 3.0 | -22.3 | 12.0 | 0.5 | 0.98 | 0.48 | 0.91 | -20.21 |
| 4439 | 22.12 | 21.77 | 23.40 | 22.81 | 0.7705 | 4 | -1.40 | long | k+a | 0.1 | -58.5 | -2.1 | -62.8 | 0.89 | 0.31 | 6.44 | -20.63 |
| 4469 | 21.70 | 21.73 | 21.65 | 21.31 | 0.7706 | 4 | 0.99 | long | a | 0.3 | -60.7 | -21.9 | -42.4 | 0.44 | 0.13 | 11.02 | -21.30 |
Note. — These data are taken from Table 2 of Paper IV.
| Radius | |||||||
|---|---|---|---|---|---|---|---|
| Cluster | Nz | ( M | ( kpc) | ||||
| Cl 1324+3011 | 20 | 0.7567 | 1086 | 6.98 | 8.23 | 11.51 | 385 |
| Cl 1324+3011 | 33 | 0.7561 | 924 | 8.83 | 8.90 | 13.83 | 770 |
| Cl 1324+3011 | 47 | 0.7564 | 1016 | 15.8 | 29.2 | 28.0 | Unlimited |
| HST ID #aaHST identification number as given in Paper V. | Keck ID #bbKeck identification number as given here and in Paper IV. | XccThe and positions in the final mosaiced HST image of the PC and the three WFC chips. | YccThe and positions in the final mosaiced HST image of the PC and the three WFC chips. | ddOptimal measure of the total magnitude in the F814W band (see Table 1c of Paper V). | SpeeSpectral classification as defined in §5.2 of Paper IV. | SFRNffThe luminosity-normalized star formation rate in units of yr-1 per unit ABB luminosity (see §7.2 of Paper IV). | ClassggThe standard Hubble classification scheme (e.g., E, S0, Sa, Sab etc.). | DhhDisturbance index : 0, normal; 1, moderate asymmetry; 2, strong asymmetry; 3, moderate distortion; 4, strong distortion. | InterpiiInterpretation of disturbance index : M, merger; I, tidal interaction with neighbor; T, tidal feature; C, chaotic. | CommentsjjDescription of galaxy morphology. Here, comp is short for “companion”; @ indicates position relative to the galaxy going clockwise, e.g. @7 = “at 7 o’clock.” |
|---|---|---|---|---|---|---|---|---|---|---|
| 5 | 2151 | 1048.56 | 398.43 | 19.84 | 0.144 | SBb | 1 | – | ||
| 9 | 2518 | 653.98 | 929.79 | 20.22 | 0.000 | E | 1 | – | ||
| 11 | 2452 | 712.57 | 922.66 | 20.44 | 0.024 | E | 0 | – | ||
| 12 | 2279 | 871.28 | 922.87 | 20.48 | 0.000 | S0 | 0 | I | tidal connection w/ #33 | |
| 18 | 1680 | 1405.52 | 942.57 | 20.85 | 0.000 | E/S0 | 0 | – | faint comp @2 | |
| 20 | 2114 | 1002.45 | 1058.73 | 20.96 | 0.344 | Sc | 3 | – | edge-on; bright knot; compact comp @9(#250) | |
| 21 | 2527 | 647.79 | 882.91 | 20.98 | 0.061 | E | 0 | I | tidal connection to compact comp @1(#47) | |
| 23 | 1733 | 1294.20 | 1556.28 | 21.00 | 0.470 | Sc | 3 | T | tidal arm; several small, faint comps | |
| 24 | 2079 | 1073.96 | 729.78 | 21.13 | 0.225 | Sa | 1 | – | possible faint comp @9 | |
| 26 | 2453 | 691.61 | 1071.56 | 21.18 | 0.000 | S0 | 1 | I? | slightly asymm disk; close, compact comp @2; 2 other comps @7,11(#88,113) | |
| 29 | 2419 | 742.99 | 974.83 | 21.31 | 0.000 | E | 0 | – | faint comp @5(#234); compact comp @7(#96) | |
| 30 | 2170 | 890.38 | 1516.37 | 21.31 | 0.000 | E | 0 | – | ||
| 32 | 2657 | 530.93 | 849.10 | 21.42 | 1.086 | P | 4 | – | ring structure; close comp @4(#87) | |
| 33 | 2253 | 894.87 | 905.35 | 21.49 | 1.119 | Sa | 3 | I | one arm; asymm disk; tidal connection w/ #12 | |
| 40 | 3032 | 259.13 | 252.55 | 21.69 | 0.000 | E | 0 | – | ||
| 42 | 2186 | 947.39 | 909.33 | 21.72 | 0.311 | P | 2 | M,I,T? | structure in bulge - possible merger; faint tail or galaxy @3; comps @4,8(#54,617) | |
| 51 | 2094 | 1078.96 | 589.21 | 22.02 | 0.817 | P | 2 | – | structure in nucleus; asymm disk | |
| 59 | 1990 | 1128.08 | 965.50 | 22.12 | 0.000 | E | 1 | – | comps @8,12(#159,298) | |
| 60 | 2310 | 837.45 | 956.88 | 22.12 | 0.071 | Sa | 0 | – | compact comp @11(#190) | |
| 62 | 1767 | 1273.18 | 1479.79 | 22.13 | 1.315 | P | 3 | M | double nucleus in faint disk | |
| 69 | 2611 | 539.87 | 1085.77 | 22.26 | 0.329 | S0 | 1 | – | faint, asymm disk | |
| 101 | 1934 | 1151.76 | 1190.83 | 22.75 | 0.732 | E | 0 | – | comp @5(#77) |