e-mails: sasha, khh, weigelt (@mpifr-bonn.mpg.de)
IRC $$+10 216 in action: present episode of intense mass-loss reconstructed by two-dimensional radiative transfer modeling
We present two-dimensional (2D) radiative transfer modeling of IRC $$+10 216 at selected moments of its evolution in 1995–2001, which correspond to three epochs of our series of 8 near-infrared speckle images (Osterbart et al. 2000; Weigelt et al. 2002). The high-resolution images obtained over the last 5.4 years revealed the dynamic evolution of the subarcsecond dusty environment of IRC $$+10 216 and our recent time-independent 2D radiative transfer modeling reconstructed its physical properties at the single epoch of January 1997 (Men’shchikov et al. 2001). Having documented the complex changes in the innermost bipolar shell of the carbon star, we incorporate the evolutionary constraints into our new modeling to understand the physical reasons for the observed changes. The new calculations show that our previous static model is consistent with the brightness variations seen in the near-infrared images, implying that during the last 50 years, we have been witnessing an episode of a steadily increasing mass loss from the central star, from yr-1 to the rate of yr-1 in 2001. The rapid increase of the mass loss of IRC $$+10 216 and continuing time-dependent dust formation and destruction caused the observed displacement of the initially faint components C and D and of the bright cavity A from the star which has almost disappeared in our images in 2001. Increasing dust optical depths are causing strong backwarming that leads to higher temperatures in the dust formation zone, displacing the latter outward with a velocity km s-1 due to the evaporation of the recently formed dust grains. This self-regulating shift of the dust density peak in the bipolar shell mimics a rapid radial expansion, whereas the actual outflow has probably a lower speed km s-1. The model predicts that the star will remain obscured until starts to drop back to lower values in the dust formation zone; in a few years from that moment, we could be witnessing the star reappearing.
Key Words.:
radiative transfer – circumstellar matter – stars: individual: IRC $$+10 216 – stars: mass-loss – stars: AGB and post-AGB – infrared: stars1 Introduction
The pulsating carbon star IRC $$+10 216 (also known as CW Leo, AFGL 1381), together with its huge circumstellar envelope lost during its long evolution on the asymptotic giant branch (AGB), is the best studied object of its class. Being in a very advanced phase of its life, probably in transition to protoplanetary nebulae (Osterbart et al. 2000, hereafter Paper I), IRC $$+10 216 presently exhibits a very high mass-loss rate yr-1 (Men’shchikov et al. 2001, hereafter Paper II). After three decades of intensive observational and theoretical work (see, e.g., references in Paper II, ), recent near-infrared speckle imaging has revealed an extremely complex evolution of its circumstellar material in the vicinity of the dust condensation zone on a time scale of one year.
Near-infrared images with resolutions better than 100 mas presented by (Weigelt et al. 1997; Osterbart et al. 1997; Weigelt et al. 1998a, b; Haniff & Buscher 1998; Osterbart et al. 2000; Tuthill et al. 2000; Weigelt et al. 2002) have demonstrated that the inner, subarcsecond dust shell of IRC $$+10 216 is non-spherical and clumpy, with four components A, B, C, and D clearly visible. The detailed two-dimensional radiative transfer modeling presented in Paper II has shown that the star is actually located at the position of the second brightest component B. The brightest southern peak A was identified with the radiation emitted and scattered in the optically thinner cavity of the dense circumstellar shell. The model reconstructed physical properties of the star and dusty envelope of IRC $$+10 216 at a single moment corresponding to the epoch of our high-resolution - and -band images on January 23, 1997 (Paper I). As much as it was possible, the model took into account most other observations of dust radiation, although stellar pulsations and non-periodic changes of the shell made many measurements from various epochs fundamentally incomparable in the frame of the static model.
In the present study, we attempt to attack the problem using a simplified approach based on the self-consistent model for a single epoch that we have constructed in Paper II. The idea is to extend this modeling to the first and to the last epochs of the 6-year sequence of high-resolution -band speckle images we have obtained since October 1995 (Weigelt et al. 2002, hereafter Paper III). In the beginning of our monitoring of IRC $$+10 216, component B (the star) was relatively bright. The direct light from the star has been gradually fading since then, whereas the bright lobe A (the southern cavity) has become dominant. The angular distance between components A and B increased from 190 to 350 mas between 1995 and 2001, implying a linear speed km s-1 in the plane of sky and a deprojected radial velocity km s-1 (Appendix A of Paper II, ), for the assumed distance of pc and the viewing angle of ° (Paper II). On the basis of our time-independent model, this well-documented rapid evolution has been qualitatively interpreted in terms of dust formation in a bipolar stellar wind, the increasing mass-loss rate, and the sublimation of the recently formed grains in a progressively hotter region just outside the dust formation radius (Paper III).
The goal of the present study is to determine, whether the observed changes in the high-resolution speckle images are consistent with our previous model of IRC $$+10 216, and to derive more accurate physical parameters of the wind at several moments in time. In Sect. 2, we describe our approach and model parameters. In Sect. 3, we discuss the results of our new modeling, comparing them with the high-resolution images, intensity profiles, and spectral energy distribution (SED) of IRC $$+10 216. In Sect. 4, we summarize the model parameters and our conclusions.
2 Radiative transfer model
2.1 General formulation
Our new 2D radiative transfer modeling is based on the structure and physical properties of IRC $$+10 216 derived in Paper II. We refer to the latter for a detailed description of the model geometry and discussion of all assumptions. The parameters of the envelope were kept unchanged, except for the density distribution within 100 AU from the star and the cavity’s opening angle (see Sects. 2.2 and 3.1). The density profile of the circumstellar shell on subarcsecond scales was allowed to vary due to expansion, increased mass-loss rate, and condensation of new dust in the wind (Sects. 3.1, 3.3, and 3.4).
The new models were computed for selected epochs (1995, 1997, and 2001) spanning the entire sequence of our speckle images in the band (Paper III). Slightly adjusting the density distribution of the time-independent model of Paper II, we found the models which would produce the images and intensity profiles consistent with the observed ones. We limited ourselves to the constraints from the high-resolution near-infrared images and did not attempt to perform a new global search of the entire parameter space for each epoch in order to fit all observations. This approach is justified by the fact that the latter have already been explained self-consistently by our previous model. Moreover, it is highly problematic to use a mixture of old observational constraints in a meaningful way for the rapidly evolving inner shell of IRC $$+10 216.
2.2 Model parameters
To facilitate the presentation and understanding of the new modeling, we briefly describe the parameters of our previous, time-independent model of IRC $$+10 216. At the end of this section, we summarize the time-dependent parameters of the new models.
The study reported in Paper II reconstructed the following physical picture. For the adopted distance = 130 pc, the luminosity of the pulsating star varies from 13000 to 5200 between the maximum and minimum brightness, with a period of 649 days. The effective temperature of the star is changing from 2800 to 2500 K between the two phases, whereas the stellar radius varies in a relatively narrow range, from 500 to 390 . During the last 1000 years, the star has experienced at least two episodes of very high mass loss with rates reaching yr-1. The broken-power-law density profile of our model (see Fig. 5; also Table 6 in Paper II, ) results most likely from a complex interplay between stellar pulsations, changing mass-loss rate, and radiative acceleration of dust and gas in the innermost parts of the envelope. The latter has bipolar cavities with a full opening angle °, tilted toward us by ° from the sky plane. The huge envelope of a radius pc has a total mass , which corresponds to a dust-to-gas mass ratio = 0.0039. The mass is consistent with an initial mass of the central star and a present-day core mass . Different dust components exist in the envelope of IRC $$+10 216 everywhere from the stellar photosphere to the outer boundary, producing the total visual optical depth toward the star, whereas in the polar regions it is .
Both the radial distribution and composition of dust in the model of IRC $$+10 216 were strongly inhomogeneous. The innermost dust formation zone of the envelope was located very close to the stellar photosphere, where the newly formed SiC grains had temperatures K. Most of the carbonaceous dust nucleated further away from the star (at AU at that epoch), whereas the most volatile components condensed at even larger distances (at AU). The abundances and size distribution of dust grains in our model depend on the distance from the star. The modeling identified the carrier of the 11.3 m feature with [SiC, C] particles, i.e. unorganized aggregates made of incompletely amorphous carbon grains with significant graphitic content and silicon carbide grains. The 27 m emission band, also known as the 30 m feature, was well reproduced by the core-mantle [SiC, C]+[Mg, Fe]S grains.
The new models of IRC $$+10 216 presented in this paper correspond to the epochs of October 8, 1995, January 23, 1997, and March 9, 2001 (below, we refer to the epochs only by the years). We fixed the model parameters at the values derived in our previous model except for only the star’s properties and the envelope’s density distribution (Paper II). The latter resulted from the most recent episode of increased mass loss (within a radius of AU, Sect. 3.3). Thus, our model assumes that at the first epoch of our imaging series, in October 1995, the star had 1 = 12200 , 1 = 2760 K, and 1 = 483 (17.3 mas); at the third epoch, in January 1997, 3 = 6140 , 3 = 2530 K, and 3 = 408 (14.6 mas); and at the eighth epoch, in March 2001, 8 = 12900 , 8 = 2790 K, and 8 = 486 (17.4 mas). The cavities’ opening angle changed from ° to ° to ° between the epochs (Sect. 3.1.3). The latter correspond to the luminosity phases , , and , respectively. The intervals between the epochs amount to days and days.
3 Results and discussion
3.1 Model images and intensity profiles
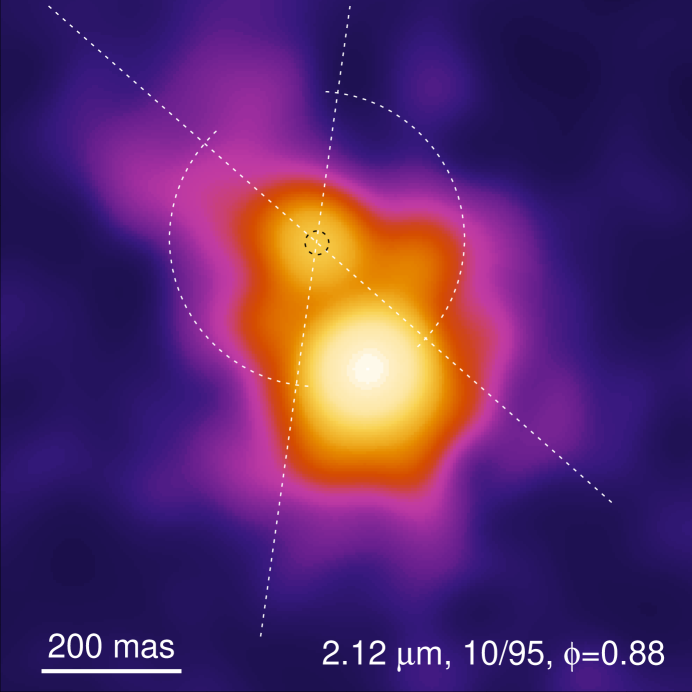
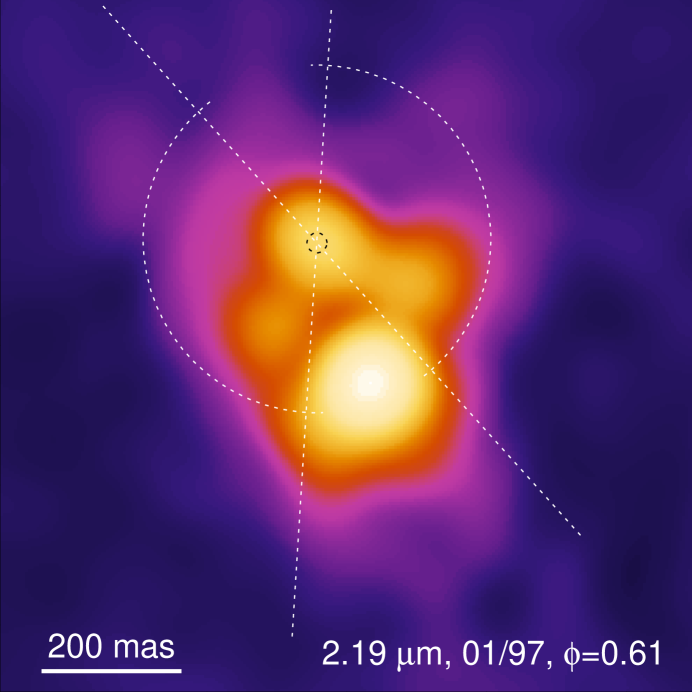
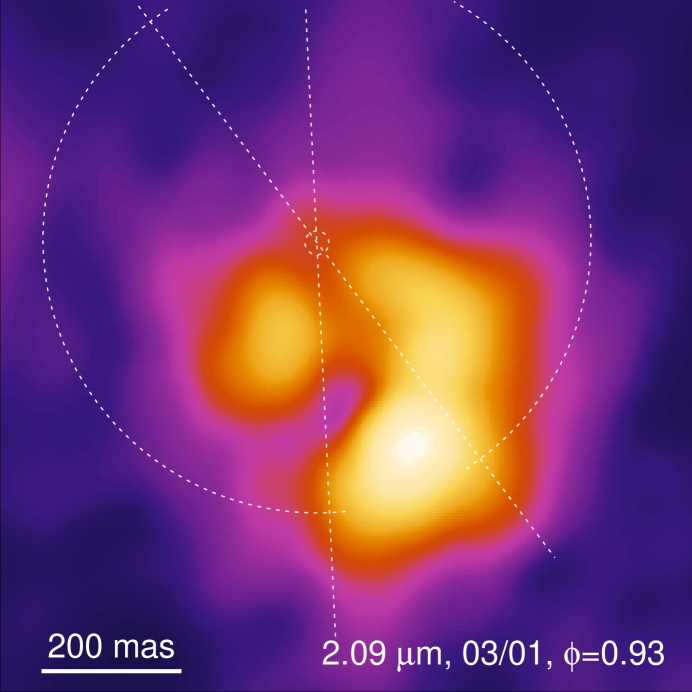
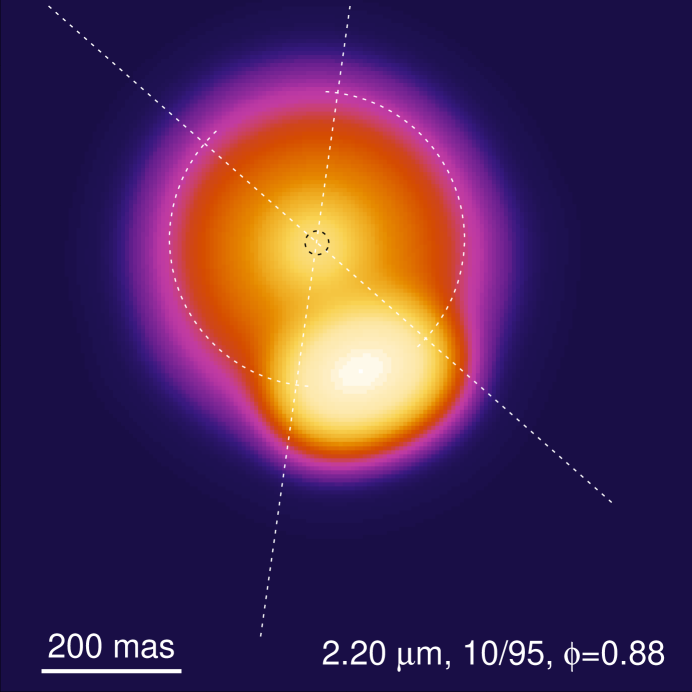
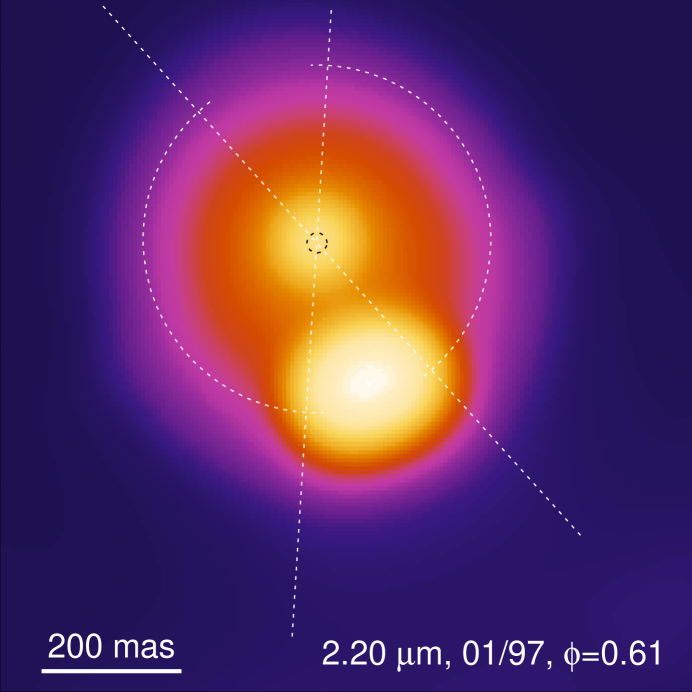
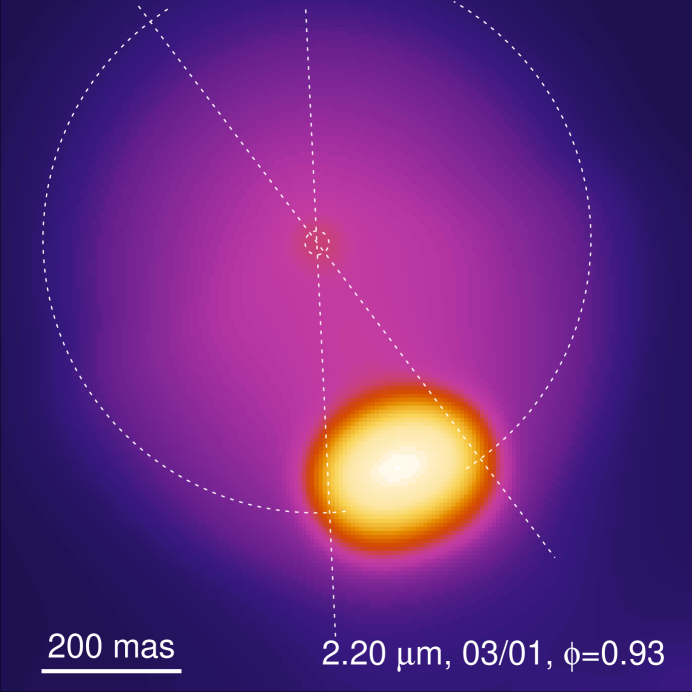
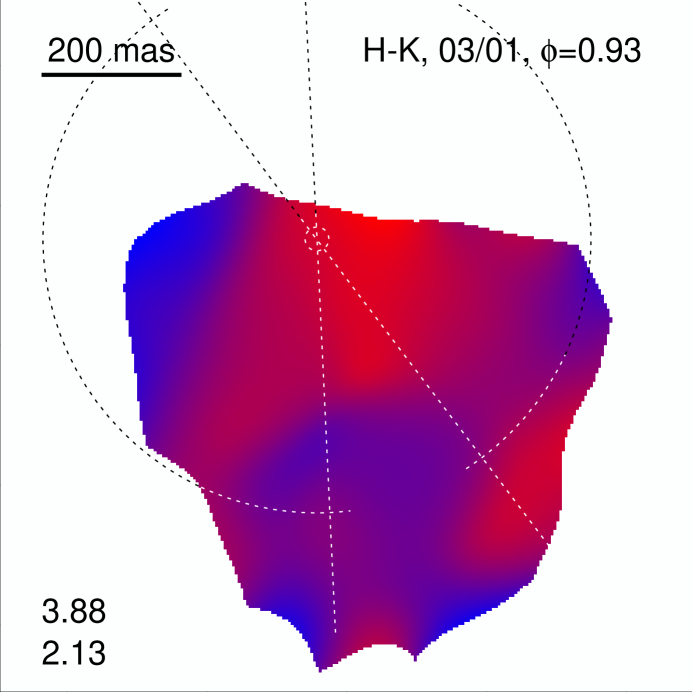
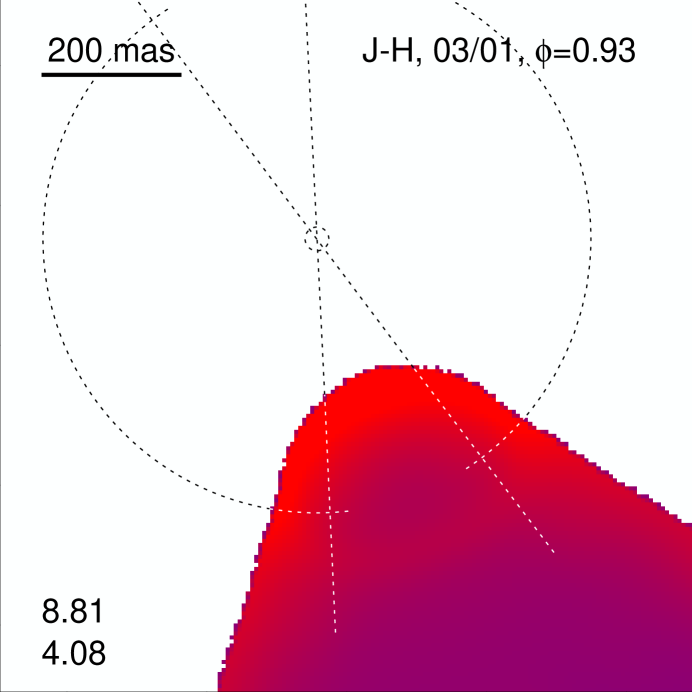
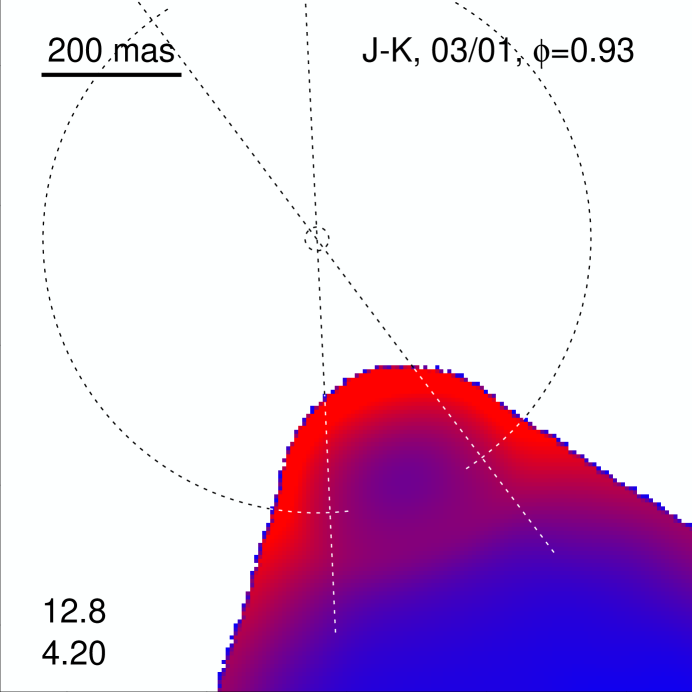
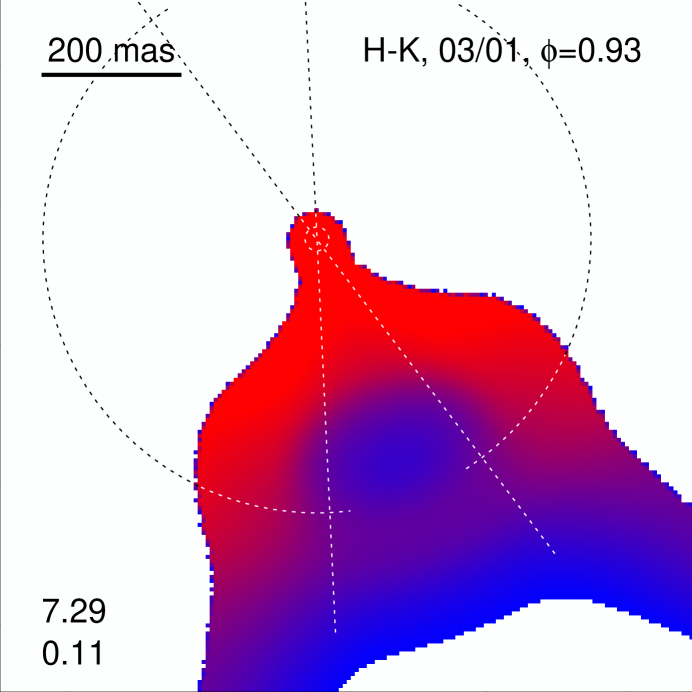
Figure 1 compares our new -band model images with the high-resolution speckle images of IRC $$+10 216 obtained in 1995, 1997, and 2001. Figure 2 displays the , , and model color maps and the observed color distributions derived from the , , and speckle images of 2001. Figure 3 shows a more quantitative comparison of the model and observed intensity distributions in terms of the normalized intensity profiles. The latter were derived from the images in two directions, parallel (PA °) and perpendicular (PA °) to the projected symmetry axis of the bipolar structure. We define the axis as a straight line through the peaks A and B in the image of 1995, where the peaks are best visible. Before extracting the profiles, we convolved the model intensity distributions with the point-spread functions (PSF) of 93, 87, and 73 mas full width at half-maximum (FWHM) corresponding to the resolutions of the observed images.
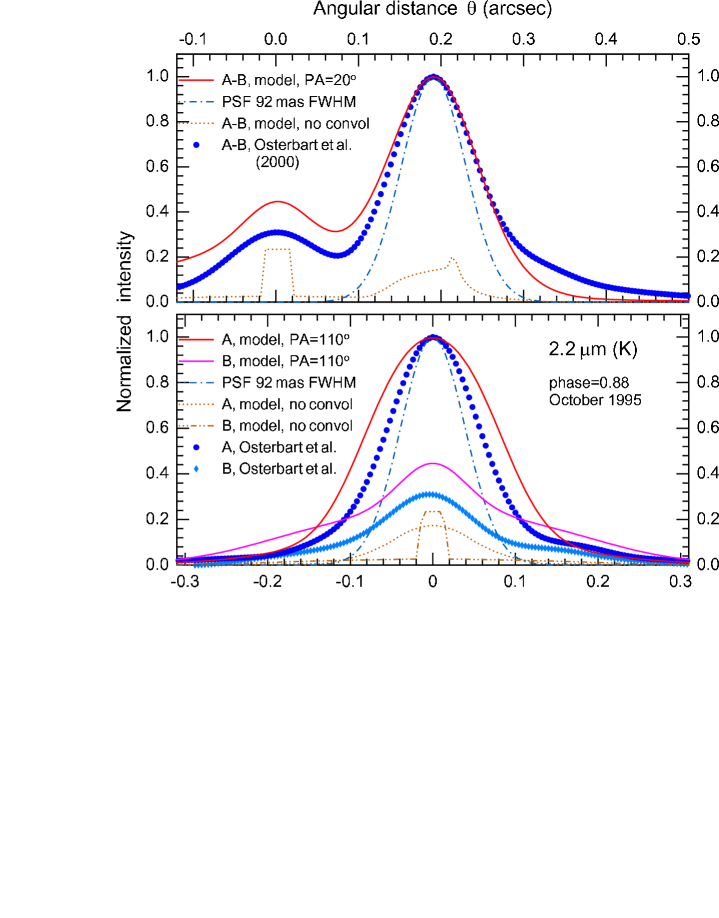
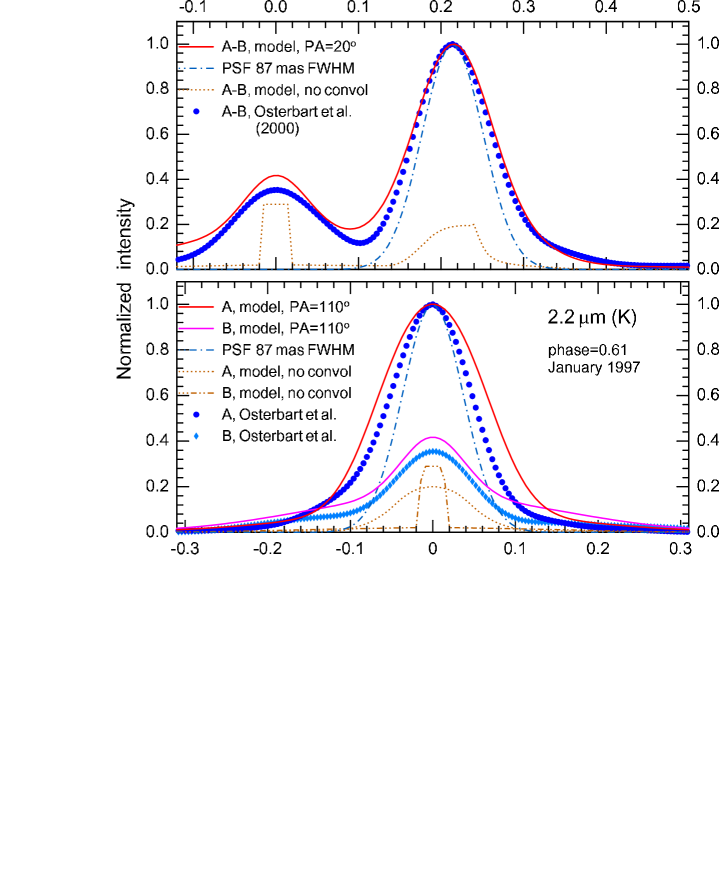
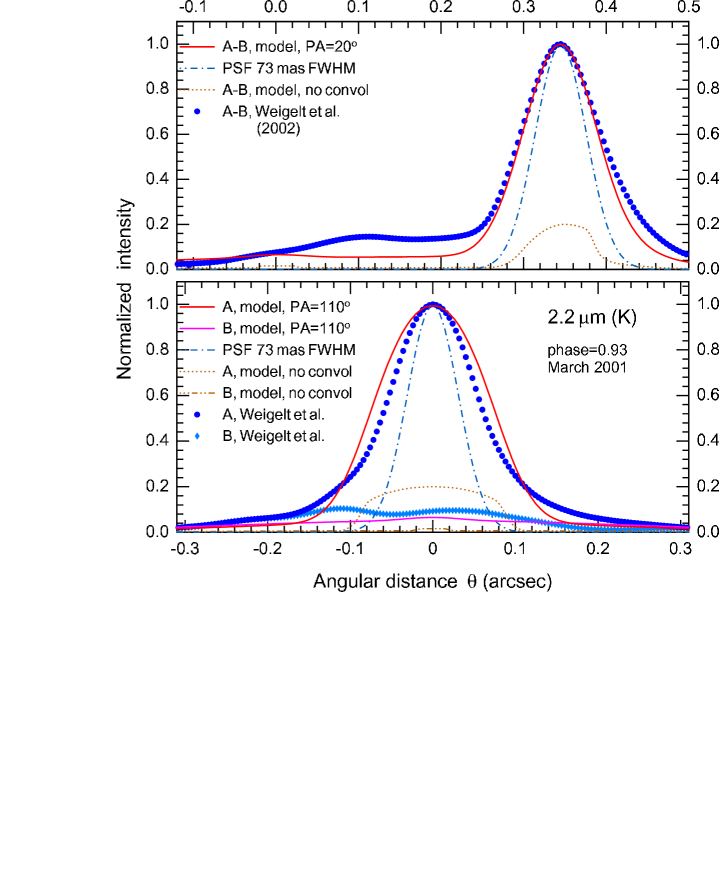
To facilitate direct comparisons with observations, an outline of the model geometry is displayed in Figs. 1 and 2 by dashed lines. The central star is shown by a small dashed circle whose diameter corresponds to the actual angular size of the star at the epochs (Sect. 2.2). The straight lines intersecting at the star’s center indicate the biconical geometry of the cavities with a projected opening angle . The cones’ axis is tilted by ° with its southern side toward the observer, causing the apparently increased cavities’ opening from to . Two circular segments extended over the angle are placed in each image at the density peak position in the main dust formation zone of the model. The segments’ radii increased with time from AU to AU to AU (Sect. 3.3), reflecting the observed displacement of component A from the star.
3.1.1 Motion of the components
If the bright peaks in our near-IR images of IRC $$+10 216 were clumps of gas and dust, their increasing distance from the star could be interpreted as real motion of the local density enhancements. Our radiative transfer modeling in Paper II has shown, however, that the brightest peak A seen in all images is not the direct light from the central star. The star is actually located at the position of the fainter peak B, whereas component A is the radiation emitted and scattered in the optically thinner polar cavity of the optically thick dust shell. The even fainter components C and D were identified with smaller-scale deviations of the density distribution of the circumstellar environment from axial symmetry. Along the directions to these peaks from the central star, circumstellar material is less opaque than in other regions of the dense shell. We interpreted a difference in the apparent velocities of the components ( km s-1 vs. km s-1) as a pure projection effect and deprojected their common radial velocity of km s-1 for 1995–1997. New speckle images presented in Paper III revealed a significantly faster motion of component A in 1997–2001, with km s-1.
The apparent outward motion can be interpreted either as a real radial expansion of the opaque, dense (spherical) layer with several optically thinner cavities or as a displacement of the dust formation radius due to the evaporation of recently formed dust in a hotter environment. Increasing temperatures would evaporate grains and thus affect the location of the inner dust boundary of the envelope, causing its displacement with a velocity .
Expansion of a dense layer with time-independent parameters of dust grains would be inconsistent with the star clearly fading since 1997. In fact, any formation and expansion of the detached shell would mean that a high mass-loss rate has eventually dropped and that the dense layer leaves behind lower-density material, as it moves outward. Since densities and optical depths of such a shell would continuously decrease in the process of expansion, the latter can only be associated with brightening, not fading of the star, unless dust grains are still forming in the expanding layer, increasing its optical depth. This does not seem plausible, because dust formation would quickly become inefficient with decreasing gas densities.
A much better explanation for the decreasing brightness of the star is to assume a monotonically rising mass-loss rate and, hence, higher densities and optical depths of the wind in the vicinity of the dust formation radius. Note, however, that the increasing would not form a detached dense shell and it is only possible to displace the dust boundary if the recently formed dust grains are destroyed. This would also lead to decreasing optical depths of the envelope and brightening of the star, unless dust grains continue to form in the wind, making it increasingly opaque. This scenario is, however, much more likely, since the gas density would peak in the dust formation zone and it would be increasing with time.
To distinguish between the real motion of a dense layer and the temperature shift of the dust formation zone, we need an accurate estimate of the apparent velocities of components A, C, and D relative to the star. In fact, one can expect an acceleration of the circumstellar material by the radiation pressure on dust grains in the neighborhood of the dust formation zone, not its deceleration. If the deprojected radial velocities were not higher than the terminal outflow speed km s-1 observed in IRC $$+10 216, the apparent motion could reflect largely an expansion of the detached dense layer in which grains are forming. The observed velocities are, however, significantly higher than .
For the assumed distance pc, a linear fit to the separations of component A (Paper III) gives km s-1 in the plane of sky, whereas a parabolic fit yields km s-1 in 1996 and suggests 26 km s-1 in 2001 ( 3 km s-1 yr-1). Components C and D moved with an average apparent velocity km s-1 during the years of our observations. Interpreting the differences of the components’ velocities in our model as pure projection effects (cf. Appendix A in Paper II, ) and assuming that the acceleration of A is real, we can expect for C and D an acceleration term km s-1 yr-1 ( km s-1 in 1996 and 8 km s-1 in 2001). Within uncertainties of the measured separations, the data presented in Paper III are consistent with this picture. For component A, one can deproject a radial velocity km s-1 (or km s-1 in 1996 and 28 km s-1 in 2001, for accelerated motion). For components C and D, the velocity is km s-1 (or km s-1 in 1996 and 27 km s-1 in 2001, if there is acceleration).
Since the acceleration is most likely real, the expansion velocity km s-1 is now twice higher than the terminal wind speed. Taken in context with the increasing optical depths in the model shell ( in 1995, in 1997, and in 2001), this strongly suggests that the observed motions are indeed caused by the rapid dust evaporation () due to backwarming and higher temperatures in the denser environment formed by the increased mass loss (see Sect. 3.3).
Furthermore, our new calculations demonstrate that it may not always be possible to accurately deproject the observed velocities without a self-consistent radiative transfer modeling. A reason for this complication is that time-dependent optical depth effects arising from the time-dependent density distribution (Sect. 3.3) play a major role in the apparent separations of the observed peaks. This is illustrated by the fact that our models, while in agreement with the observed distances of component A from the star (Figs. 1, 3), imply significantly higher radial velocities of the density peak, km s-1, km s-1, and km s-1 than simple geometrical deprojection would indicate (12 km s-1, 24 km s-1, and 20 km s-1, respectively). Possible uncertainties in the distance to IRC $$+10 216 cannot decrease the velocities below even for the lower limit of 100 pc (Becklin et al. 1969).
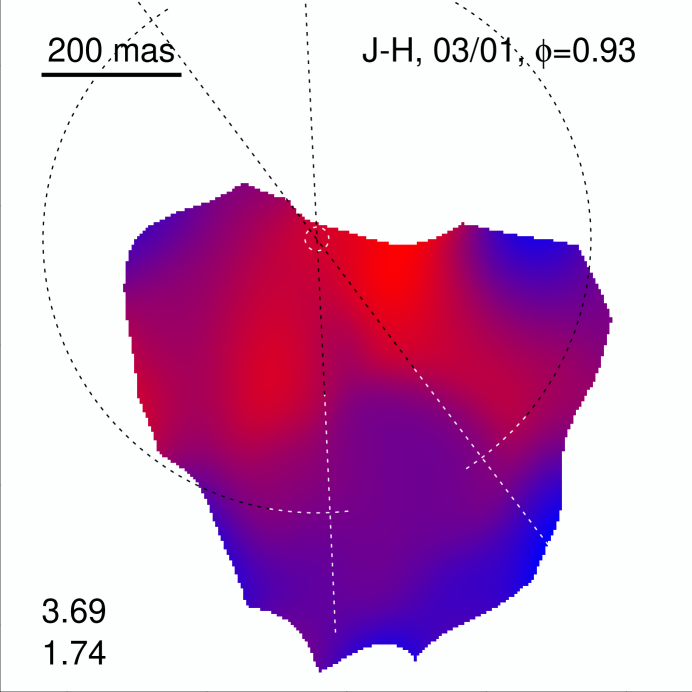
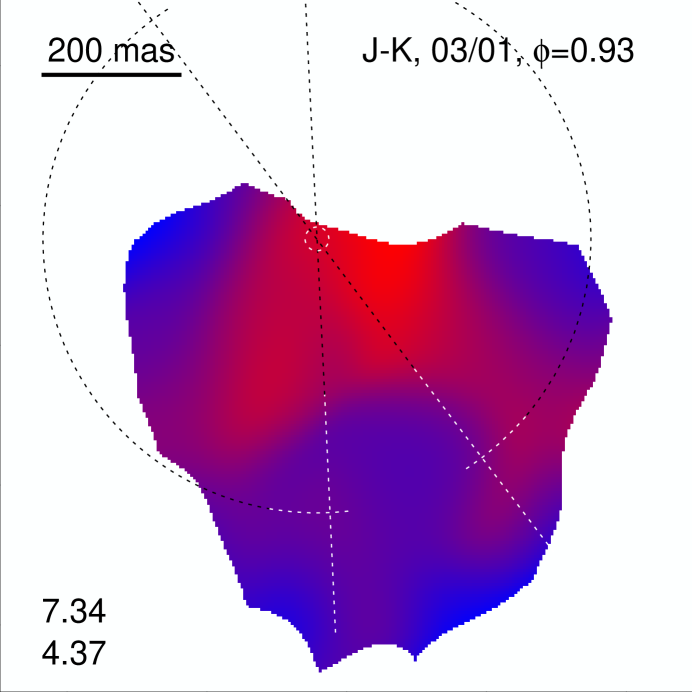
3.1.2 Near-IR color maps
Figure 2 compares the model and observations in terms of the high-resolution , , and color images for the most recent epoch of 2001. The speckle color images were computed for only those areas of the , , and images, where intensities are greater than 2% of the peak in the respective bands, whereas the limit for model color images was 1%, to display slightly larger areas. The obvious difference between the general appearance of the model and speckle images is mainly due to the inhomogeneities of the intensity distributions in the latter and a large contribution of components C and D that are very prominent at the last epochs, but not included in our model. As a consequence, the observed images have higher intensity levels over larger areas. One can meaningfully compare only the regions around the bright southern cavity at the latest epochs, in contrast to the image of 1997 ( Paper II, ).
The color images corroborate the conclusion of Paper II that the bright components A, C, and D are respectively the cavity and smaller-scale inhomogeneities in the dense shell, not dense clumps of dust as it might appear from the images alone (Fig. 1). All the bright components are situated in the blue areas in both the model and the observed color images. The cavity A coincides with the bluest spot, which is a natural consequence of lower optical depths along those directions from the star. The bluest, optically thinnest spot is located precisely inside the conical cavity, at the surface of the dense dusty shell close to the dust formation radius. Naturally, the star is in the red area of the color images, as it was also in the previous epochs (Fig. 16 in Paper II, ). The distribution of red and blue color in the observed images would be impossible to reproduce in any reasonable and accurate model, if the star were at the position of the bright southern lobe.
3.1.3 Shapes of the cavities
The star is clearly visible in the -band model images at the center of the faint circular halo of dust emission from the hottest and densest inner region of the dusty envelope (in 1995 and 1997, Fig. 1). The brightest lobe of the southern cavity appeares near the edge of the circular halo, just at the dust formation zone indicated by two dashed circular segments. The intensity level of the halo is somewhat higher in the models than in the observed images (cf. Fig. 3), causing its prominent appearance. The halo is present also in the 1997 image, where one can see the incompletely circular halo east of the star. As discussed in Paper II, the halo is distorted in this image, most likely due to density inhomogeneities and patchy circumstellar extinction north and north-west of the star. The 2001 image is qualitatively similar to the older image obtained in 1997 but strongly distorted by the merging of the bright lobe A with component C. Direct stellar light has been absorbed in the denser dust shell having much larger optical depth ( vs. ).
The shape of the cavity has changed between 1995 and 2001 primarily because of the brightening of component C and its merging with A. The latter is somewhat more elongated in the model images in the direction orthogonal to the symmetry axis (A-B) of the object, which may indicate that the density distribution or dust properties in the cavities in the model differ from the actual parameters in IRC $$+10 216. Despite somewhat different resolutions of the images, the size (opening angle) of the outfow cavity seems to be larger in 1995 than at later epochs, although for 2001 the comparison is complicated by the merger of A and C. Our modeling suggests that the cross-section of the cavity has indeed decreased with time, when compared to the cross-section of a cone with fixed opening angle. Constrained by the observed -band speckle images, the present models have the opening angle of the conical cavity decreasing from 46° in 1995 to 36° in 1997 and to 26° in 2001. We have been unable to find models for the first and the last epochs with the same, unchanged °, that would reproduce intensity ratios of the peaks A and B in the observed images.
This decrease of may be interpreted as a kind of “collimation” of the bipolar cavities, although one must bear in mind that the “cavities” in reality are not necessarily conical, as the model assumes for simplicity. Moreover, the details of the intensity distribution in the model images are not completely similar to what is shown by observations (Fig. 3). The model predicts component A to have wider profiles than those of our speckle images, suggesting that the density distribution inside the cavities, in contrast to the model assumptions, may depend on the polar angle or be even more complex.
3.2 Spectral energy distribution
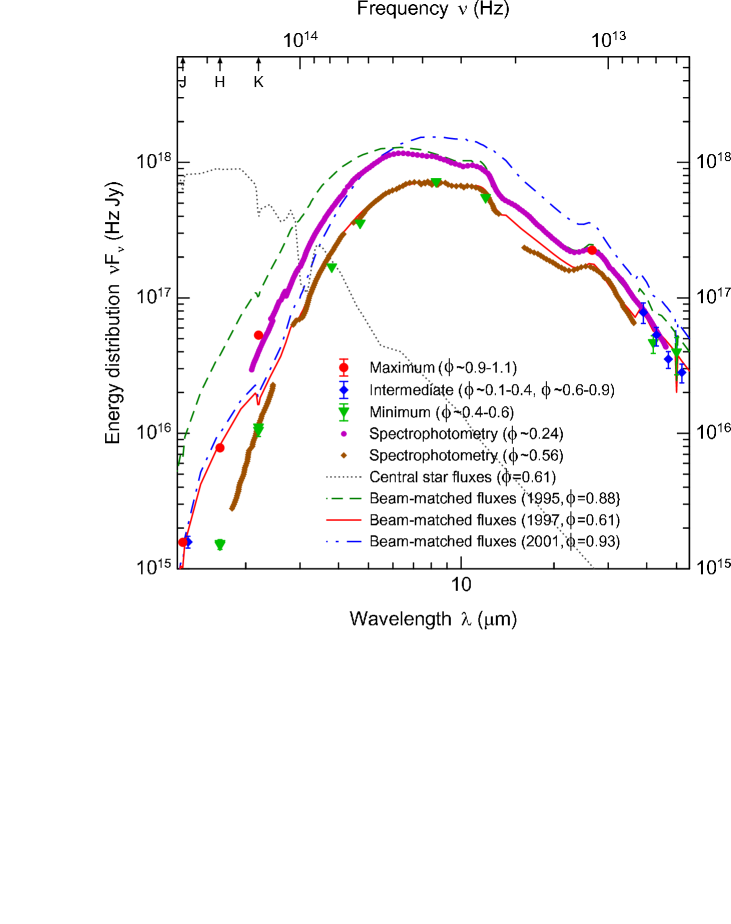
Figure 4 compares the model SED with available continuum fluxes of IRC $$+10 216 (described in Paper II, ). Since the central energy source is a pulsating star, its luminosity, effective temperature, and radius are also changing with a period of 649 days (Sect. 2.2). Our images documented the envelope’s dynamic evolution over 5.4 years, when the material had only time to move by no more than 16 AU with the wind velocity of 15 km s-1. Thus, the observed changes have affected only the innermost hot regions of the envelope ( AU, K) and not influenced the SED at m. For this reason, we display in Fig. 4 only the spectral region 1–50 m around the continuum peak. The entire SED and the prominent dust features at 11.3 m and 27 m are discussed in detail in Paper II.
The resulting SED displays large phase variations and significant non-periodic evolution of the star and the inner dense envelope of IRC $$+10 216. Our model shows that, despite the rapid expansion of the dust formation zone, the visual optical depth of the dense shell has increased from to to in 1995–2001, which implies a significant dust density enhancement in the innermost dust formation region (see Sect. 3.3). The model predicts that the continuum fluxes at m are now lower than in 1995 by a factor of and that at m they are now higher by approximately the same factor. The model continuum peak shifted toward longer wavelengths from 6.4 m to 8.6 m as the increasingly dense and opaque dust formation zone expanded radially by a factor of 2 (Fig. 1, Sect. 3.3). The dust emission features at 11.3 m and 27 m have now become noticeably shallower than several years ago. These model predictions can, in principle, be tested by spectrophotometric measurements.
3.3 Densities and temperatures
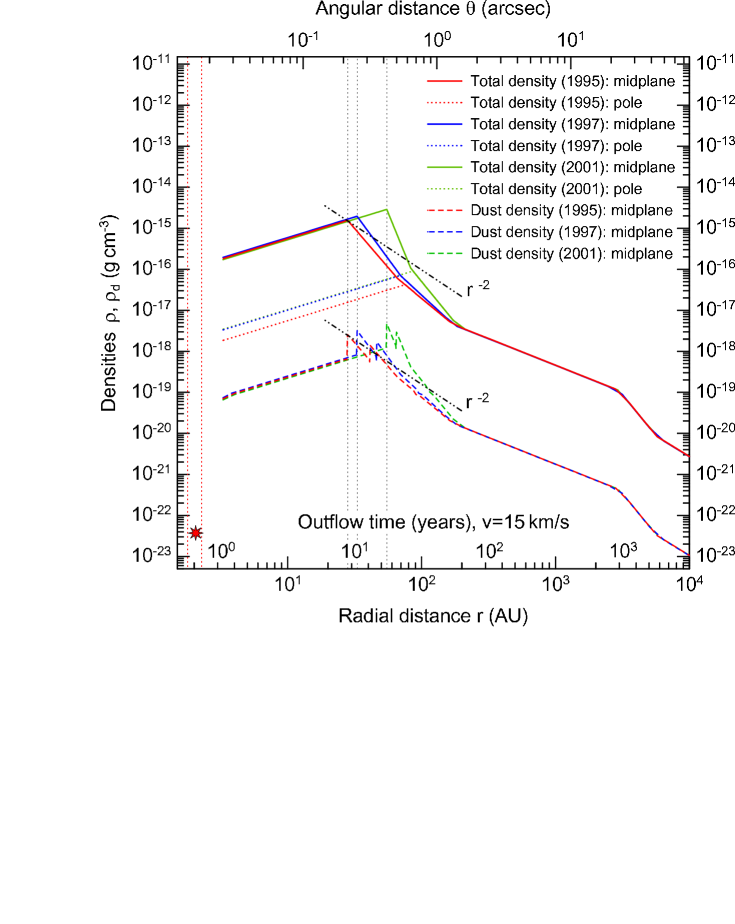
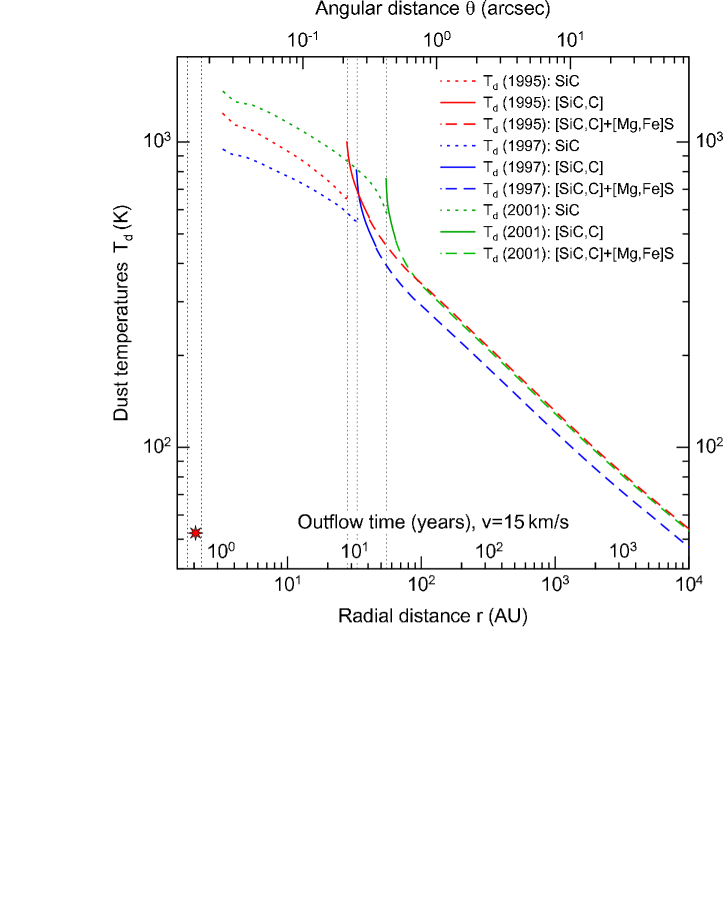
Figure 5 displays density and temperature distributions in our models of IRC $$+10 216 for 1995, 1997, and 2001. The plots show only the inner regions ( AU) of its huge envelope having an outer radius of AU; for a discussion of the density and temperature structure of the entire envelope, we refer to Paper II. The dust temperatures in Fig. 5 are plotted for only the smallest dust grains of the components considered in our dust model. The latter consists of SiC, aggregates composed of silicon carbide and amorphous carbon [SiC,C], and the same aggregates covered with the mantles of magnesium-iron sulfides [SiC,C]+[Mg,Fe]S (Paper II).
The density profile of our previous model was adjusted so as to produce the -band images consistent with the observed speckle images of IRC $$+10 216 (Figs. 1, 3). The resulting density distribution shown in Fig. 5 changes with time due to the increasing mass-loss rate and forming dust in the dense shell expanding away from the central star. Between the epochs, the main dust formation zone displaced from 28 AU to AU to AU. Its linear expansion velocity in our model, km s-1, is almost twice larger than the general outflow speed of the envelope (Sect. 3.1.1).
The total density distributions shown in Fig. 5 assume that the dust-to-gas mass ratios of different dust components in IRC $$+10 216 do not change in time and that they are equal to the values adopted in our previous time-independent model (see Table 2 in Paper II, ). An inspection of Fig. 5 shows that the densities in the dust formation zones of different dust materials became higher with time, implying that the mass-loss rate increased, too. For an illustration, we plotted density profiles through the dust and total density peaks of 1995. These lines would trace the displacement of the peaks with time, if , , and remained constant. Contrasting with the expected density distribution of such an outflow, the model densities rise significantly above the pure expansion line. This can be interpreted in terms of the increasing mass-loss rate or of the increasing degree of dust condensation or both.
In the standard picture of mass-losing AGB stars, the radiation pressure acceleration of dust and gas takes place in the dust formation zone. In reality, different dust components form within a considerable range of radial distances from the star (cf. Paper II, ), although the general picture of the acceleration of the newly-formed dust grains due to the radiation pressure remains valid. The velocity km s-1 of the wind material close to the dust formation zone, which is higher than the generally accepted value of km s-1, does not fit readily into this context, as it would imply significant deceleration of the wind material. Although such a deceleration may well be possible in a complex, time-dependent outflow hydrodynamics, in Sect. 3.1.1 we have interpreted this fast expansion as not the real outflow motion, but rather a displacement of the dust formation radius due to the backwarming effect in the optically thicker environment.
In fact, the radial dust temperature distributions of our model (Fig. 5) demonstrate a very significant heating of the grains within the dense shell. The model density profile just outside the carbon nucleation zone steepens with time from to to between the three epochs, causing higher values and much steeper distributions of dust temperatures in that region. When they jump over the condensation temperature of the dust material, evaporation of the dust grains is a natural and inevitable consequence. Dust sublimation can quickly shift the dust formation zone outward, thus bringing the increased densities in balance with the condensation temperatures of carbon dust, K, however, at a larger radius. Such displacement of the dust density peak due to the self-regulating processes of dust formation, heating, and destruction can easily be mistakenly interpreted as a radial expansion of the wind material.
3.4 Mass-loss rate and dust formation
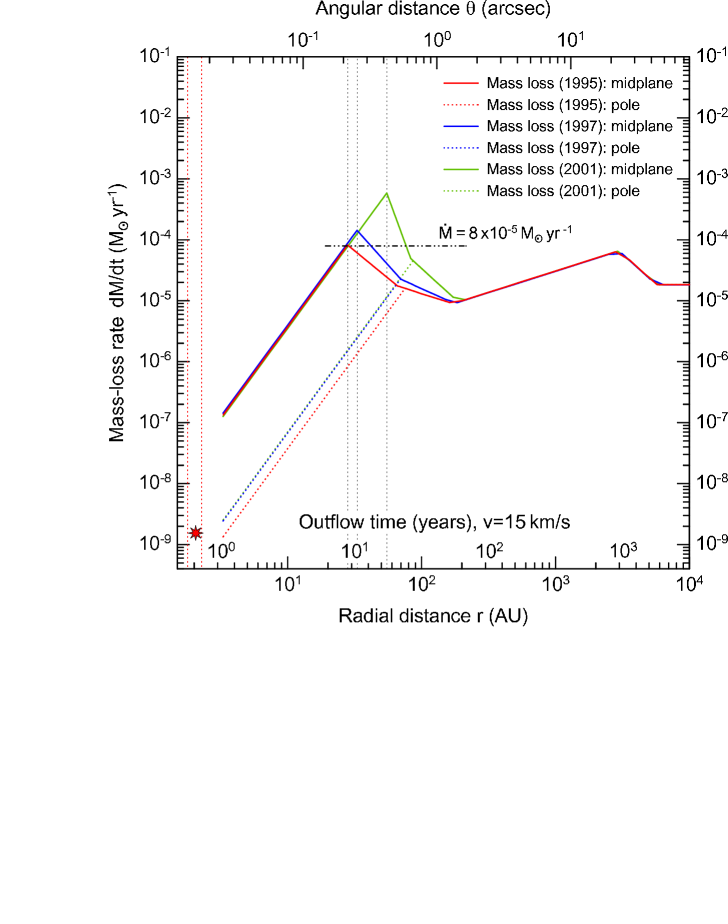
The time-dependent mass-loss rate of IRC $$+10 216 can readily be derived from the density distribution of our models, assuming that the outflow velocity = 15 km s-1 is constant across the envelope and that in the envelope does not change with time (Fig. 6). Note that the radiative transfer models like this predict only dust densities and convert them into gas densities by adopting a specific value (usually arbitrary) of the dust-to-gas mass ratio. However, is not a free parameter in our model of IRC $$+10 216 (see Paper II, ).
If we assume that remained constant during the envelope’s expansion, then the rising densities displayed in Fig. 5 would imply monotonically increasing mass-loss rates illustrated in Fig. 6. In this case, our model predicts that the mass-loss rate has increased by a factor of 7 during the 5.4 years of our imaging, from yr-1 in 1995 to yr-1 in 1997 to yr-1 in 2001. Such changes would amount to a rate of yr-2. Assuming that the latter is constant and that it takes 20 years for the material leaving the star to reach the zone of carbon dust formation (at 55 AU, Fig. 5), we would conclude that the mass-loss rate from the stellar surface may have been recently as high as yr-1.
If we assume instead that remained constant during the envelope’s expansion, then the total density profiles must differ from those plotted in Fig. 5. The total density peak of 1995 should evolve then along the track. This would imply that has increased by the same factor of 7, from in 1995 to in 1997 to in 2001, i.e. that the new dust formation continues as the dense gas flows outward. This seems to be natural, since the dust formation process takes considerable time (see, e.g., Paper III, ). In this case, the mass-loss rate would remain at a lower value of yr-1 but would be rather high at present, approaching 0.7%.
It seems very likely, however, that in IRC $$+10 216 both and are increasing with time. If this indeed is the case, their values can be not as high as in the above two scenarios. For example, if their contributions were equal, then we would derive yr-1 and .
4 Conclusions
We presented results of two-dimensional radiative transfer modeling of IRC $$+10 216 at selected moments of its recent evolution, which correspond to three epochs of our series of high-resolution speckle images of the object recorded over the last 5.4 years (\al@Osterbart_etal2000,Weigelt_etal2002; \al@Osterbart_etal2000,Weigelt_etal2002). The imaging revealed dynamic evolution of the subarcsecond dusty environment of IRC $$+10 216 on a very short time scale, of the order of one year. The goal of the present study was to test predictions of our recent time-independent modeling (Paper II) which derived the structure and physical properties of IRC $$+10 216 at a single epoch (January 1997). Now that the entire sequence of 8 high-resolution near-IR images has documented complex changes in the inner bipolar dusty shell of the carbon star, we took these temporal constraints into account to see, whether the static model is consistent with the fast evolution seen in our images. The new modeling allowed us to make a quantitative physical interpretation of what goes on in IRC $$+10 216.
Our previous static model of IRC $$+10 216 (Paper II) is consistent with the new constraints, provided that small modifications are made to its density profile in the dust formation zone and to the opening angle of the bipolar cavity. The new modeling has shown that the cavity has been shrinking from ° to ° and the density distribution across it has been changing during the 5.4 years of our imaging. We are witnessing a dynamic episode of rising mass loss from the central star, from yr-1 to the present value of yr-1, which probably started 50 years ago. If the current rate of the increase of is constant, the mass-loss rate from the stellar surface may be now as high as yr-1.
A compact dense shell with bipolar cavities has formed around the star as a result of the rapid increase of the mass loss by IRC $$+10 216, causing the observed rapid evolution documented in our images. The higher mass loss produces favorable conditions for dust formation in the increasingly dense inner envelope expanding outward with the outflow velocity km s-1. Larger amounts of dust increased the optical depths, obscuring the central star, whereas the optically thinner cavity remained relatively unaffected. Due to backwarming, temperatures in the dust formation zone became higher, shifting the latter to larger radii at the velocity km s-1 and mimicking the real outflow motion of the circumstellar shell material with that speed. One can predict that the star will remain obscured until starts to drop back to lower values in the dust formation zone. Within a few years from that moment, we could be witnessing the star reappearing, whereas the cavities becoming relatively fainter.
References
- Becklin et al. (1969) Becklin, E. E., Frogel, J. A., Hyland, A. R., Kristian, J., & Neugebauer, G. 1969, ApJ, 158, L133
- Haniff & Buscher (1998) Haniff, C. A. & Buscher, D. F. 1998, A&A, 334, L5
- Men’shchikov et al. (2001) Men’shchikov, A. B., Balega, Y., Blöcker, T., Osterbart, R., & Weigelt, G. 2001, A&A, 368, 497 (Paper II)
- Osterbart et al. (1997) Osterbart, R., Balega, Y., Weigelt, G., & Langer, N. 1997, in Planetary Nebulae, ed. H. J. Habing & H. J. G. L. M. Lamers, Proc. IAU Symp. 180 (Dordrecht: Kluwer), 362
- Osterbart et al. (2000) Osterbart, R., Balega, Y. Y., Blöcker, T., Men’shchikov, A. B., & Weigelt, G. 2000, A&A, 357, 169 (Paper I)
- Tuthill et al. (2000) Tuthill, P. G., Monnier, J. D., Danchi, W. C., & Lopez, B. 2000, ApJ, 543, 284
- Weigelt et al. (1998a) Weigelt, G., Balega, Y., Blöcker, T., et al. 1998a, A&A, 333, L51
- Weigelt et al. (2002) —. 2002, A&A, in press (Paper III)
- Weigelt et al. (1997) Weigelt, G., Balega, Y., Hofmann, K.-H., Langer, N., & Osterbart, R. 1997, in Science with the VLT Interferometer, ESO Astrophysics Symposia (Berlin: Springer), 206
- Weigelt et al. (1998b) Weigelt, G., Blöcker, T., Hofmann, K.-H., et al. 1998b, in Asymptotic Giant Branch Stars, ed. T. Le Bertre, A. Lèbre, & C. Waelkens, Proc. IAU Symp. 191 (Astronomical Society of the Pacific), 273