COSMOLOGICAL EFFECTS OF THE FIRST STARS: EVOLVING SPECTRA OF POPULATION III
Abstract
The first stars hold intrinsic interest for their uniqueness and for their potentially important contributions to galaxy formation, chemical enrichment, and feedback on the intergalactic medium (IGM). Although the sources of cosmological reionization are unknown at present, the declining population of large bright quasars at redshifts implies that stars are the leading candidates for the sources that reionized the hydrogen in the IGM by . The metal-free composition of the first stars restricts the stellar energy source to proton-proton burning rather than the more efficient CNO cycle. Consequently they are hotter, smaller, and have harder spectra than their present-day counterparts of finite metallicity. We present new results from a continuing study of metal-free stars from a cosmological point of view. We have calculated evolving spectra of Pop III clusters, derived from a grid of zero-metallicity stellar evolutionary tracks. We find that H-ionizing photon production from metal-free stellar clusters takes twice as long as that of Pop II to decline to 1/10 its peak value. In addition, metal-free stars produce substantially more photons than Pop II in the He II ( Ryd) continuum. We suggest that large Ly equivalent widths ( Å) may provide a means of detecting metal-free stellar populations at high redshift, and that He II recombination lines (, ) may confirm identifications of Population III. While Pop III clusters are intrinsically bluer than their Pop II counterparts, nebular continuum emission makes up this difference and may confuse attempts to discern Pop III stars with broadband colors. In a companion paper, we explore the consequences of evolving spectra of Pop III for the reionization of the IGM in both H and He.
1. Introduction
The first stars and their role in galaxy formation and the evolution of the intergalactic medium (IGM) define one of the frontiers of modern cosmology. Yet we do not know when the first stars formed, where they now reside, what happened to them over time, or even where to look for them. The Big Bang paradigm requires that the first stars were composed of H and He with only trace light elements and negligible carbon (Schramm & Turner 1998). Metal-free stars have unique properties owing to this primordial composition: they are hotter and smaller than their metal-enriched counterparts (Tumlinson & Shull 2000, hereafter TS). These features have interesting implications for their formation, their environment, and particularly for their spectra. Some key open issues are the formation epoch of the first stars (Ricotti, Gnedin, & Shull 2002), the mass distribution for stars formed from primeval gas (Bromm, Coppi, & Larson 2001), and their contribution to the reionization of H and He in the IGM. The recent suggestions by Lanzetta et al. (2002) that star formation may become more widespread in the distant past, the discovery of a gravitationally-lensed galaxy at (Hu et al. 2002), and the apparent completion of H reionization by (Becker et al. 2001; Djorgovski et al. 2001) and He at (Kriss et al. 2001) make detailed examination of the first stars particularly timely.
With our present tools we can see back to , roughly 1 Gyr after the Big Bang (a universe with = 0.3, = 0.7, and = 70 km s-1 Mpc-1 is assumed here). Imaging and spectroscopic surveys that sample wide swaths of sky for telltale emission lines (Ly emitters; Hu et al. 1999; Rhoads et al. 2000) or peculiar broadband colors (Lyman-break galaxies, Steidel et al. 1999) have discovered more than 1000 galaxies at . Searches such as the Sloan Digital Sky Survey (SDSS) are expanding the list of known QSOs at and enabling high-redshift probes of the IGM (Fan et al. 2001; Schneider et al. 2002). Ground-based spectra can determine the star formation rate, metallicity, and mass of galaxies at (Pettini et al. 2002). The first stars are believed to have formed between (Gnedin & Ostriker 1997; Ricotti et al. 2002), while galaxies have been discovered up to . The next observational frontier is the direct observation of the first stellar generation.
This work is part of an ongoing effort to examine the first stars from a unified stellar and cosmological point of view. We began with zero-age models (TS) of metal-free stars that revealed their potential importance to H and He reionization in the IGM. We followed that with a detailed calculation of the He II recombination line fluxes from Population III clusters, assessing the prospects for discovering this emission as a distinctive signature of the first stars (Tumlinson, Giroux, & Shull 2001, hereafter TGS). We are concerned here with the properties of the first stars that affect their observational signatures and feedback on the IGM. These effects depend on the answer to a fundamental question about the first stars: what is the time evolution of their structure and radiation? We update the work of TS to compute new evolving spectra of metal-free stars and to assess the effects of evolution on the emergent spectra of Population III clusters.
In this paper, we use the terms “Population III” and “metal-free” interchangeably. We also note that there are two distinct usages of the term “Pop III” that have appeared in the literature. One usage connotes small protogalactic clusters that have and that must cool with molecular hydrogen lines in the absence of metals. We adhere to the stellar definition, in which “Pop III” and metal-free stars are identical regardless of location.
In § 2 we discuss the major components of our stellar evolution calculations. In § 3 we present the stellar evolution tracks that enable our evolving spectra and observational predictions. In § 4 we describe the modeling of the stellar atmospheres and construct evolving spectra for synthetic Pop III clusters. In § 5 we make detailed predictions of the observational signatures of metal-free stars and describe the realistic prospects for their discovery. In § 6 we draw some general conclusions. Paper II (Venkatesan, Tumlinson, & Shull 2002) presents the results of a cosmological reionization model that incorporates Pop III spectra as ionizing sources.
2. Stellar Evolution at Zero Metallicity
2.1. Method
To study the evolution of Population III stars, we must construct realistic numerical models that account for the physical processes that are thought to be relevant in real stars. The basic theory of stellar structure is quite well developed and has been tested against observations for decades. Occasional conflicts with detailed observations lead to refinements of the theory, usually in the form of additional input physics (convective overshoot, mass loss, and rotation, for example). Of course, no such fine calibration of models for Pop III stars is yet possible, since we have not discovered any of these stars or anything believed to be their remnants. We must make the basic assumption that the framework of stellar evolution theory applies equally well to the unusual regime of zero metallicity. Under this assumption, our Population III models incorporate the same paradigmatic assumptions and physical ingredients that underlie all modern stellar evolution codes. We must note here, however, that since our ultimate goal is a calculation of the evolving spectra, we are not concerned with internal processes, particularly late in the stellar lifetime, that do not affect the spectral evolution. Those readers who are interested in the details of the later stages of Pop III evolution are referred to the tracks by Marigo et al. (2000) and Siess, Livio, & Lattanzio (2002). Schaerer (2002) has compiled tracks from a variety of sources (El Eid et al. 1983; Marigo et al. 2000; Klapp 1983) in an investigation into the properties of metal-free stars that parallels some of our own results. Finally, we note that the following exposition of our method is included for readers interested in the details. The basic results of our study can be found by skipping to § 3.
In our code we solve the fundamental stellar structure equations:
| (1) | |||||
| (2) | |||||
| (3) | |||||
| (4) |
where radius , luminosity , pressure , and temperature are the “primary variables” and the subscript implies that the variable represents a cumulative quantity up to radius . These equations are transformed to a Lagrangian mass grid that does not change with total stellar mass. The mass density , opacity , energy generation rate , thermodynamic derivatives and , and the specific entropy are “secondary variables” which are themselves functions of , , , , and the chemical abundances by number, denoted by . For radiative energy transport, we use: and in convective regions we use . The adiabatic derivative is calculated for each mass point during the evaluation of the equation of state.
We solve these coupled equations with a variant of the relaxation method described definitively by Kippenhahn, Weigert, & Hofmeister (1967) and still in extensive use today. This method transforms the main differential equations into difference equations by expanding them in a Taylor series about small corrections to the initial guesses for the primary variables. The corrections are derived iteratively by a routine adapted from Press et al. (1987; Chapter 16.3).
2.2. Physical Ingredients of the Models
2.2.1 Equation of State
The equation of state (EOS) is a numerical function that relates the primary variables pressure , temperature , and the secondary variable density . The EOS is that of an ideal monatomic gas with radiation pressure. Partial ionization of the metallic species is included but is generally unimportant at K in the stellar core.
2.2.2 Opacity
Our code computes the Rosseland mean opacity from the OPAL tables produced at the Lawrence Livermore National Laboratory (Iglesias & Rogers 1992). The code calls a subroutine provided publicly by the OPAL project to interpolate in the tables and derive for a specific combination of parameters . The tables are provided at fixed grid points in T and (, not to be confused with the radius) and there are multiple tables corresponding to different metallicities.
2.2.3 Energy Generation
Energy generation rates (, in erg s-1 g-1) are computed by a custom nuclear reaction network. The network stores the relative populations of the relevant nuclear species and derives from these and the reaction rates the energy generation rates from proton-proton, CNO, and He burning at supplied values of the primary and secondary variables. The 24 isotopic abundances appearing in Table 1 are followed individually in a fully implicit, time-dependent network modeled after the formalism in Hix & Thielemann (1999). Table 1 also lists the included reactions, for which the reaction rates are drawn from the canonical Caughlan & Fowler (1988) compilation.
The nuclear reaction network is coupled to the stellar structure equations through the secondary variable and the abundances of the chemical species. These are stored in a separate array and the hydrogen, helium, and metal mass fractions, , , and , respectively, are computed from this array, with scaling to the total density for use in the EOS and opacity routines.
2.2.4 Convection and Mixing
Where the temperature gradient is too steep for radiative energy transport, convective motions must carry the energy produced in the stellar core. We assume that the isotopic abundances are fully mixed in convective regions and that convective regions overshoot their formally defined boundaries. We follow the common practice (Maeder & Meynet 1987; Schaller et al. 1992) that assumes an overshooting distance of 0.20, where is the pressure scale height evaluated at the convective boundary:
| (5) |
Different assumptions for the overshooting distance may contribute modestly to the systematic uncertainty in the behavior of the stars in the HR diagram and their emergent spectra.
2.2.5 Boundary Conditions
Four boundary conditions are required to complete the system of four equations (Eq. 1 – 4). The outer boundary conditions constrain the temperature and pressure at the photosphere of the star. We assume that the temperature at the photosphere is the effective temperature given by the relation .
To calculate the atmospheric pressure, we call a function that derives for the stellar photosphere. Near the stellar surface, we neglect changes in mass, radius, and luminosity and assume that , , and . This region obeys a simple relationship common to all stratified atmospheres: . Using this relation and combining equations 1 and 3, we derive a differential equation relating optical depth and pressure :
| (6) |
Then, using the Eddington approximation to radiative transport, we write the relation:
| (7) |
The boundary condition for the differential equation (8) is that the gas pressure vanishes at , leaving . At the photosphere, and solving for in equation (7) gives . We then integrate equation (6) from to , and find the value of corresponding to at the photosphere. This calculation is done at each iteration in the approach to convergence.
At the inner boundary we use the so-called “central expansions” (Kippenhahn et al. 1967), which fix the luminosity and radius at the inner mass zone.
2.2.6 Initial Conditions
The starting model for an evolutionary sequence is calculated at the zero-age main sequence (ZAMS). A mass and chemical composition are specified, and a static structure model is calculated at . In this case, the starting models were the ZAMS models presented by TS. We use the initial composition = 0.76, = 0.24 to represent the primordial composition. For illustration, we note that a decrease in leads to systematically higher core temperatures for stars powered by pp and CNO burning ( and ).
For , ZAMS Pop III stars are not strictly metal-free except perhaps in the early stages of their formation (El Eid et al. 1983; Castellani et al. 1983; Marigo et al. 2000). The stellar cores are hot enough to accumulate a small abundance of 12C via the triple- process before and during main-sequence H-burning. Thus, the idea of a high-mass, metal-free, main-sequence star powered solely by pp burning is misleading. In fact, these stars derive most of their energy from CNO-burning of H (see § 3.2 below). We must carefully follow the production of 12C in the core to derive the initial conditions for a main-sequence (MS) Pop III model. In contrast, TS used ad hoc assumptions for the pre-MS synthesis of carbon, based on the earlier calculations of El Eid, Fricke, & Ober (1983).
We start with the strictly metal-free ZAMS model from TS and let it produce 12C in the core until CNO burning dominates the energy production. Starting from the model, the star will evolve to slightly lower luminosity and until energy production from CNO burning exceeds that of the pp chains. At this point, the star begins to evolve to higher luminosity but still declines in . The 12C mass fraction at this transition is (where ) and increases slightly with mass. We take the first point where to be the starting point of the evolutionary tracks. For , luminosity increases immediately, starting at .
3. Results for Stellar Evolution at Zero Metallicity
3.1. Evolutionary Tracks
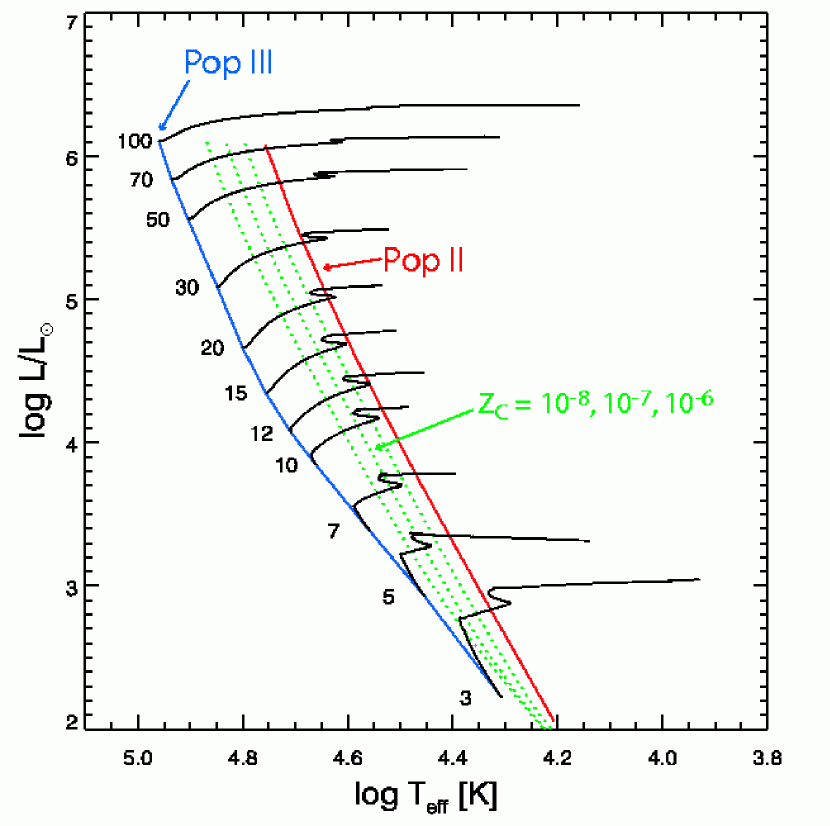
We have calculated evolving stellar models for from the ZAMS past the onset of helium burning. These tracks appear in Figure 1, which shows the tracks compared with a similar Pop II () zero-age main sequence for = 1 – 100 from Schaller et al. (1992). The large gain in effective temperature at is readily apparent in this figure.
We have done a simple comparison of our tracks to the similar work of Marigo et al. (2000) and Siess et al. (2002). Our tracks match theirs on the H-burning main-sequence, and for He-burning at . We find effective temperatures that are 3 - 5% lower and H-burning lifetimes that are 1 - 12 % shorter (Table 2). These differences illustrate that individual choices for parameters, numerical techniques, and the specific implementation of physical processes (e.g., convection) or boundary conditions can create small differences in the final results. Our models diverge from Marigo et al. (2000) in the details of evolution in the HR diagram during the He-burning phases for , perhaps owing to differences in our treatment of convection. Since we are concerned with the spectral evolution for the first 10 Myr, which is dominated by the H-burning MS of massive stars, we have not attempted to resolve these differences here. Simple testing indicates that the time evolution of ionizing photons and broadband spectra are similar between the two sets of tracks, except for a roughly 30% smaller He II ionizing photon production from our models, due to the slightly cooler effective temperatures and the sensitivity of 4 Ryd radiation to . We note also the studies of Pop III stars over a broad mass range by Schaerer (2002), and Bromm et al. (2001), who published static models of zero-age Pop III stars from 100 - 1000 .
Our tracks do not complete core He burning because of a peculiar evolutionary feature noted also by Marigo et al. (2000). During core He burning, the core begins to expand and at some point reaches the boundary of the H-depleted region. At this point, the core H abundance rises from 0 to from one discrete timestep to the next, owing to the assumption of instantaneous complete mixing in the convective core. This assumption is clearly inadequate here, since the added H is probably burned quickly at the edge of the convective region in a continuously evolving star. An ad hoc treatment of this phenomenon that forbids expansion of the convective core past this boundary is unlikely to represent accurately the true behavior of the stellar interior in this stage. Since this evolutionary phase represents a small fraction of He burning, which is itself 10% of the stellar lifetime, we terminate our tracks when the boundary of the convective core reaches the H-rich region.
Figure 1 shows that, for , the stars evolve uniformly towards lower and higher luminosity. These stars are powered by core CNO burning, catalyzed by the small C fraction built up there by 3 burning. For , the stars start on the ZAMS with and first evolve to higher via pp burning while the core C abundance rises. When the 12C mass fraction reaches , the star is powered primarily by CNO burning and begins to evolve to lower .
To assess the differences in ionizing photon emission and some observational characteristics between Pop III and Pop II, we have constructed zero-age main sequences for initial carbon abundances of 10-8, 10-7, and 10-6. These appear in Figure 1. These unevolved populations may represent the intermediate stellar generations between Pop III and Pop II. We construct model spectra for these populations as for the Pop III evolving cluster (see § 4).
We have neglected mass loss in calculating our stellar evolution models and spectra. Mass loss is believed to be driven in massive stars by radiation pressure on blanketed metal lines in the outer reaches of the stellar atmospheres. In the metal-free case, this pressure is likely to be minimal (Kudritzki 2000), and the constant-mass assumption is a good approximation. Marigo et al. (2000) used a simple test of Eddington luminosity to argue that massive Pop III stars may experience modest mass loss late in their He-burning phases. Even if this occurs, it is unlikely to affect the composite spectra we produce here and can be safely ignored. The uncertain role of mass loss can be viewed as one of the major systematic uncertainties remaining in the study of metal-free stars. If it is strong, main-sequence mass loss drives the star to hotter on the main sequence - these effects can be seen in the tracks of El Eid et al. (1983) and Klapp (1983).
3.2. Why Pop III Stars are Hot
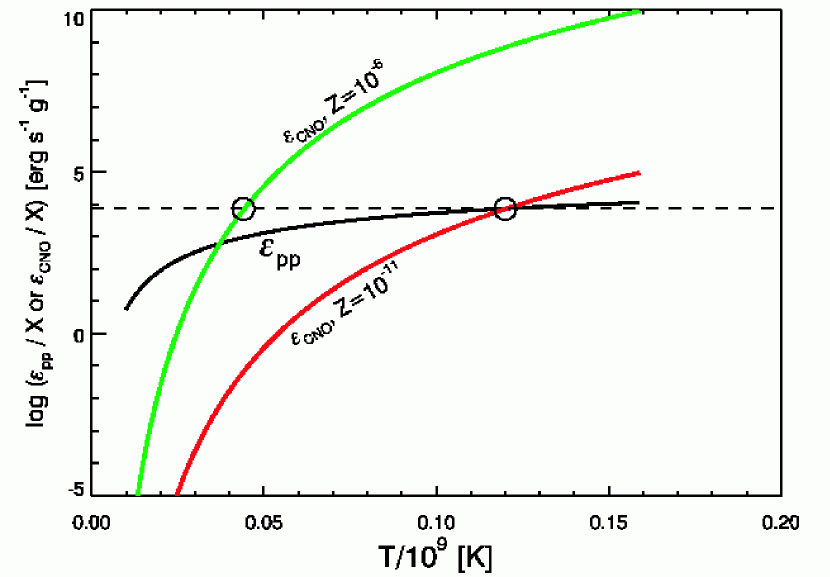
The distinctive spectral appearance of Pop III stars is due directly to their unusually hot surfaces (TS). These stars are roughly two times hotter and five times smaller than their Pop II counterparts of the same mass. There are two main reasons for these differences, both related directly to the chemical composition. First, nuclear burning in a metal-poor isotopic mix must occur at higher temperatures to derive the same energy per unit mass as at higher metallicity. The change in nuclear energy production rates () is illustrated in Figure 2, with some characteristic parameters. The highest curve (green) is for a metallicity of . At this metallicity, CNO burning at a typical core temperature of K can achieve the typical for a particular location in the stellar interior. If this star is restricted to pp burning (black curve) or to CNO burning at a very low C abundance (red curve), it must do so at temperatures above K. These latter two cases illustrate Pop III nuclear burning. This effect accounts for most of the large changes in stellar structure as metallicity approaches . Second, and less important to the structure of Pop III stars, the opacity of stellar material is reduced at low metallicity, permitting steeper temperature gradients and more compact configurations at the same mass (see Figure 3).
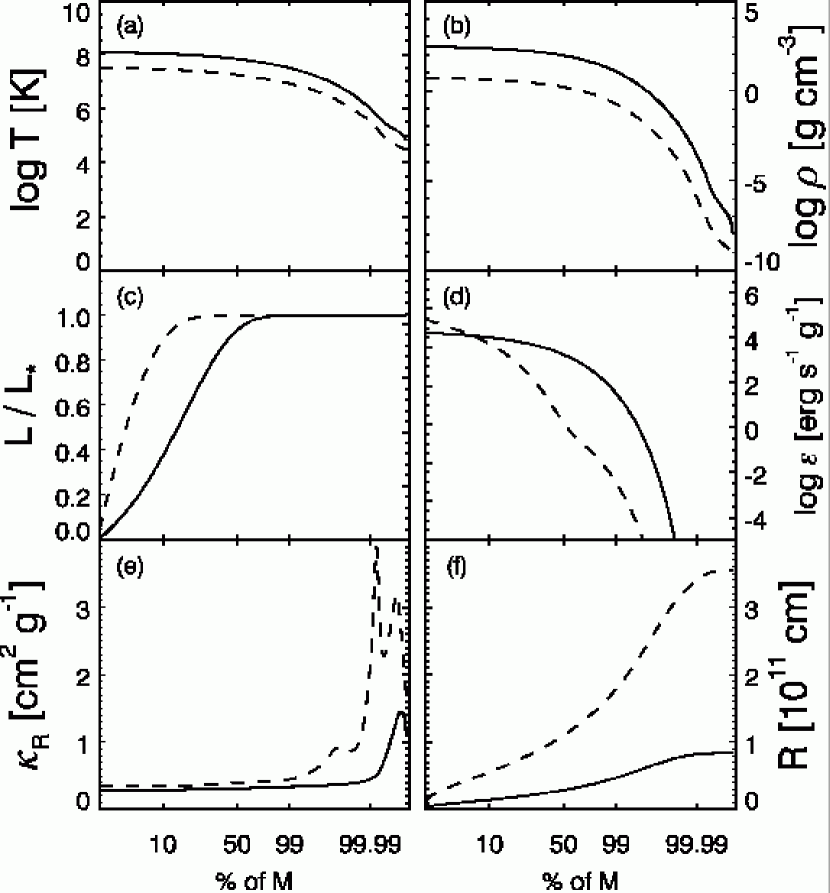
The effects of reduced opacity can be seen in Figure 3, which shows the run of six important physical quantities in Pop II (dashed) and Pop III stars (solid) of 15 . Pop III stars are more centrally condensed, with hotter, denser cores, and hotter surfaces. Throughout 99% of the stellar material, the opacity (lower left) has a weak dependence on metallicity because it is dominated by scattering off electrons donated primarily by H. In the outer envelope, which comprises 1% of the stellar mass, the opacity is provided by the bound-free and bound-bound transitions of H I, He I, and He II. Here the opacity differs substantially between Pop II and Pop III, but it has little effect on the overall stellar structure.
4. Model Atmospheres and Synthetic Spectra
4.1. Model Atmospheres
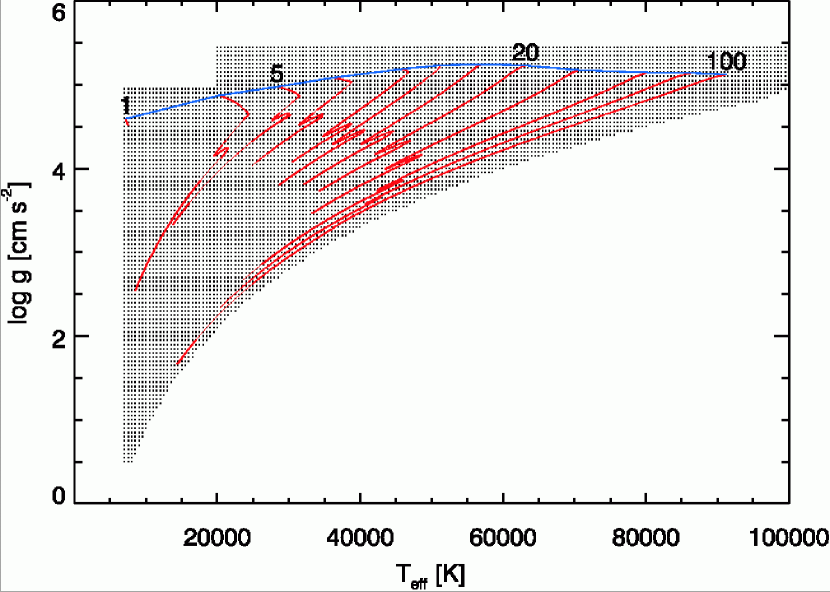
The model atmosphere grid was calculated using the publicly available TLUSTY code (Hubeny & Lanz 1995). These models are parameterized by the effective temperature at the stellar photosphere () and the surface gravity (). Model spectra at the grid points are calculated for Å by the companion program SYNPLOT. For high accuracy and coverage we chose K and . Figure 4 shows the range of the model grid with the evolutionary tracks overlaid. At low temperatures ( K) the model atmospheres are allowed to have small convective regions to promote convergence. This modification has little effect on their emergent spectra. Some stars develop convective envelopes during late H burning, but these regions lie far from the nuclear burning core and thus always maintain their metal-free composition.
4.2. Population Synthesis
To produce model spectra and calculate the cosmological effects of Pop III stars we must create synthetic clusters from the discrete set of tracks presented above. We desire smoothly varying quantities such as ionizing photon flux and broadband colors, so we must convert the tracks at discrete masses into more continuous variables.
Constructing a complete synthetic population from evolutionary tracks requires careful calculation of the tracks for masses that are not explicitly computed. For example, if one has tracks at 100, 80, and 60 , extrapolating the behavior of the 90 track from 60 and 80 leads to large errors, and interpolation of the 100 and 80 tracks is not accurate after the last timestep on the more massive track. We cannot simply use the explicitly calculated tracks to represent broad mass bins (20 ), because this leads to sharp discontinuities in the calculated spectra and derived quantities. We use small mass bins of 1 , which are preferred for adequate accuracy and smooth behavior of the results. To resolve these issues we use a “lifetime-proportional” interpolation scheme to create synthetic evolutionary tracks for the intermediate masses between the explicitly calculated tracks.
The evolutionary tracks at the explicitly calculated masses are followed beyond the onset of helium burning, a phenomenon that occurs at all masses and occupies % of the stellar lifetime. Since later stages (C-burning, Si burning) are even shorter and contribute little to the spectral evolution of a cluster, we assume that He burning is the last evolutionary phase and that its end terminates the star’s life. We also rely on the fact that the changes in shape and time-dependence of the tracks vary smoothly with mass. We can use these important features to construct interpolated tracks at intermediate masses.
Taking the run of and to be a track, we first remap the explicit tracks to a new time coordinate - the fraction of the stellar lifetime achieved to that point, ranging from 0 to 1. Then, a vector of lifetimes for each mass bin is interpolated from the lifetimes of explicit tracks. Finally, we interpolate intermediate tracks between the explicit tracks at the same fraction of their lifetimes. For instance, to find (, ) for a 90 star at 70% of its interpolated lifetime, we interpolate in mass between the 80 and 100 explicit tracks at 70% of their lifetimes. This scheme minimizes interpolation errors and generates smoothly varying model spectra and derived quantities.
Using the interpolated tracks and model atmospheres, we construct synthetic stellar populations by specifying a stellar initial mass function (IMF) and adding stellar spectra together. Because we lack detailed knowledge of the IMF for star formation, we assume that the IMF is a power law, , with the Salpeter slope, . To populate the IMF, we construct 99 mass bins and populate them with the number of stars of that mass, normalized to a total mass of 106 , which is standard practice. The mass bins are 1 wide and range from 1 - 100 . Model spectra from the atmosphere grid are assigned to the bins and summed over all masses. The product of this process is a composite spectrum for the whole cluster. Schaerer (2002) and Bromm et al. (2001) performed similar calculations for top-heavy IMFs ranging up to 1000 .
We adopt a model of Pop II starburst clusters as a reference spectrum for comparison with our evolving Pop III models. In the present paper, this reference model represents a baseline spectrum for comparison to the models. In Paper II, we use this spectrum as a proxy for the “second generation” of stars incorporating the metals produced by the first. For the reference population, we use a model with , in stars, and a Salpeter IMF, that was custom-generated by the Starburst99 population synthesis code (version 3.1, Leitherer et al. 1999). Because this suite of models is widely used in the community, we compare all our model spectra and observational predictions to a Pop II model generated by their code. We note further that we do not include Wolf-Rayet (WR) stars in these comparison models to make our comparisons as direct as possible. WR stars are known to produce large amounts of He II ionizing photons in the local universe (Schaerer & Vacca 1998), but their at high redshift () and low metallicity is regarded as unlikely since the WR phenomenon requires metal-line opacity to drive strong stellar mass loss. Recent studies of stellar mass loss at low metallicity (Kudritzki 2002) have shown that its importance is minimized at extremely low metallicity, with a factor of 10 drop in mass-loss rate from to 10-4. Nonetheless, we include in our comparisons below some results for Pop II with WR stars.
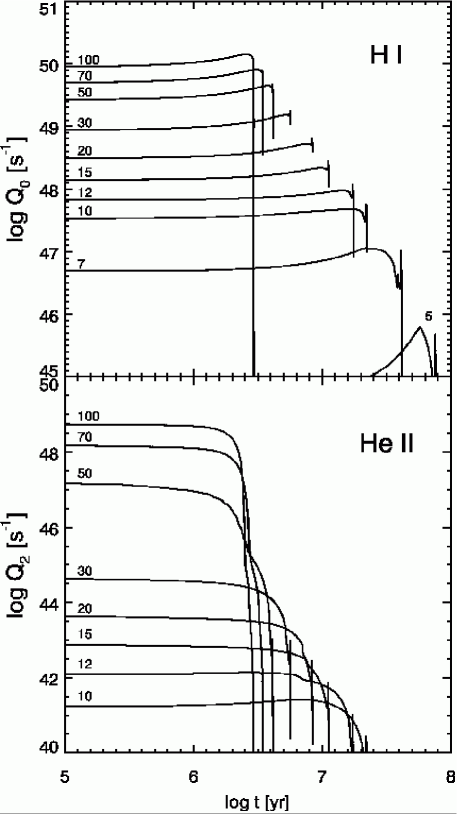
For modeling cosmological reionization, radiative feedback, and the observational signatures of metal-free stars, we make use of the important quantities , which express the ionizing photon output per second in the H I, He I, and He II continua ( = 0, 1, 2, and = 13.6, 24.6, 54.4 eV, respectively):
| (8) |
where is the spectrum of the star in units of erg cm-2 s-1 Hz-1. The time-dependent values of and are displayed for the individual stars in Figure 5 to show the behavior with mass.
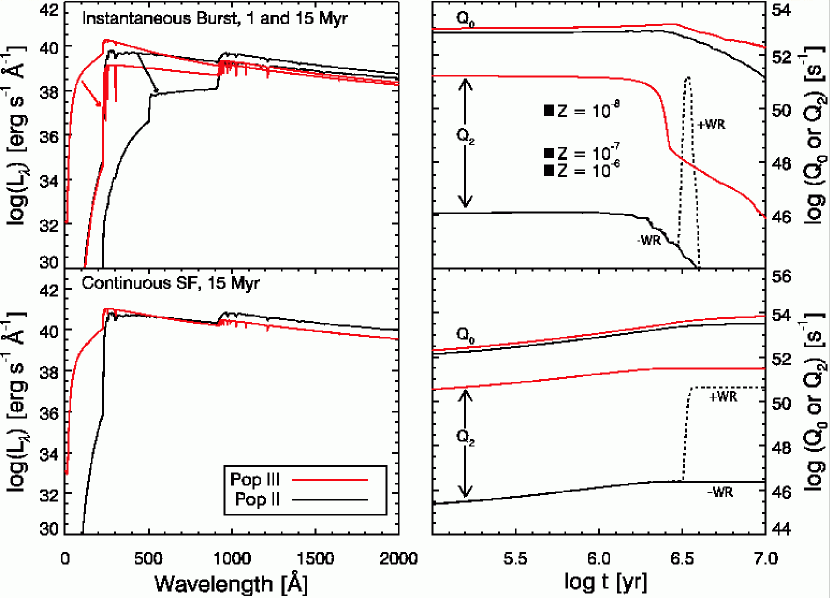
Once the individual have been weighted by the IMF, we arrive at the cluster seen in Figure 6. There are several features of this figure that deserve comment. First, note the starting (ZAMS) values of and for the Pop III and comparison Pop II clusters. The Pop III cluster has that is 60% larger than the Pop II cluster. Second, the ionization of the Pop III cluster persists at a high level far longer than the Pop II cluster, owing to the strong gain in ionization for stars. The Pop III cluster takes 10 Myr to decline to 1/10 its ZAMS value in , twice as long as Pop II. Finally, note the strong ionization above the He II edge at 4 Ryd. At the Pop III ZAMS, we find that / = 0.02, with a lifetime of 2.5 Myr, characteristic of stars (see Figure 5). This form of the output from our models can be placed directly into cosmological calculations of IGM reionization that incorporate realistic models of evolving spectra from Pop III stars (see Paper II).
For the ZAMS spectra at 10-8, 10-7, and 10-6, we find s-1, respectively, intermediate between the Pop II and Pop III values. There is a sharp decrease in their , however, with , , and s-1, respectively. These quantities are compared with the evolving for Pop III and Pop II in Figure 6.
In Paper II, we examine the effects of Pop III clusters on the reionization of the IGM. These tests use a quantity , which expresses the ratio of He II to H I column densities in an ionized IGM (Fardal, Giroux, & Shull 1998). This ratio can be predicted for a specific distribution of IGM clouds, given an input source spectrum, which is assigned an intrinsic (prior to IGM filtering) based on the shape of its spectrum above 1 Ryd. A composite QSO (Zheng et al. 1997; Telfer et al. 2002) with a power law spectrum, , and has an intrinsic . At the ZAMS, the Pop III cluster has , harder than the mean QSO and similar to a power-law spectrum with . For the low-metallicity ZAMS at , and 10-6, we find intrinsic = 33, 80, and 180, respectively. We make use of this ratio in Paper II to explore the fate of IGM regions ionized by Pop III stars.
5. Observational Signatures
5.1. General Approach
Observational searches for high-redshift galaxies work best when equipped with diagnostic tools that provide detailed relationships between observable signatures and underlying physical phenomena. To this end, we use our models of Pop III clusters to derive predictions for the observed spectral energy distributions (SED) of the first stars. We consider two classes of observation; the first seeks the nebular emission line signatures of Pop III stars, and the second exploits their broadband SED and colors. We take up the nebular emission first because its presence affects the broadband signatures as well.
5.2. Emission-line Diagnostics
Emission-line signatures are proving to be the primary means of finding galaxies at redshifts beyond . Deep, blind searches for Ly emitters have turned up large populations of galaxies at these epochs. These surveys use either blind multi-slit spectrographic exposures to detect single emission lines over a broad redshift range (Hu et al. 1999), or they take narrowband images to probe deeply at selected redshifts (Rhoads et al. 2000).
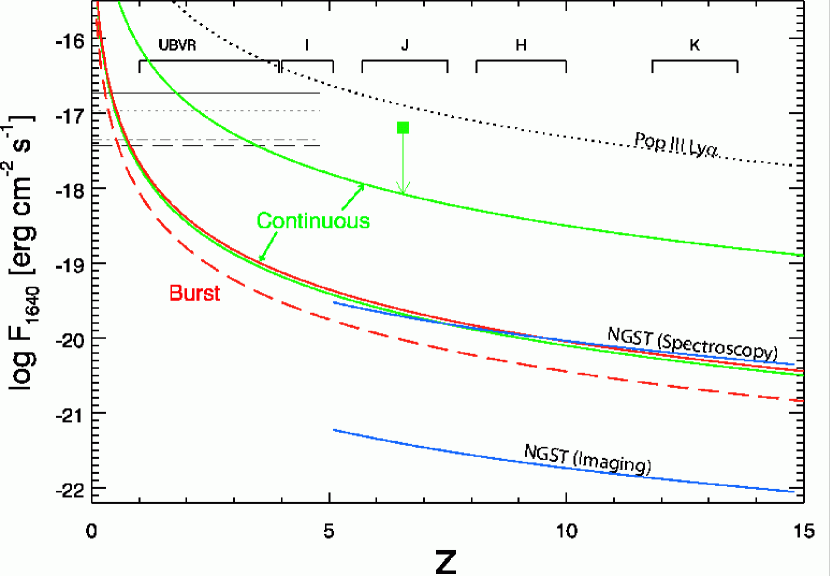
TGS derived a relationship for the observed He II emission-line flux from metal-free stars as a function of star formation rate (SFR). With the evolved spectra of metal-free stars we can update these earlier calculations. We assume that few He II ionizing photons escape the galaxies where they are produced ( = 0.025; see Paper II) and that the sources themselves contain no dust. We assume Case B recombination at 20,000 K, corresponding to a higher nebular temperature in low-metallicity gas. As in TGS, we adopt = 0.66, = 4.6, and = 0.28 (Seaton 1978). TGS used an ad hoc scale factor, , to account for stellar evolution effects, which reduce the He II ionizing flux over time as high-mass stars evolve off the main sequence. We need not make this approximation here, since we have directly calculated evolving spectra of metal-free stars. For both continuous and instantaneous star formation, we assume that erg s-1 (i.e., there are 0.424 H photons emitted for each H-ionizing photon). Similar coefficients are derived for the other H I lines from Case B recombination theory (Osterbrock 1989). Note that Leitherer et al. (1999) use a coefficient of , corresponding to nebular gas at 104 K. We then multiply the H luminosity by the emissivity ratio to derive in a He II line. In Figure 7 we plot the predicted line fluxes for Ly and He II 1640 as a function of redshift.
For clusters with significant ionizing photon production, we must also account for continuous nebular emission from the H I two-photon process and direct recombinations to upper levels of H I, He I, and He II. We construct a wavelength-dependent emission spectrum, in units erg s-1 Å-1:
| (9) |
where the term , in units erg cm3 s-1 Hz-1, incorporates contributions from H I, He I, He II, and the H I two-photon continuum and is the Case B recombination rate coefficient for hydrogen. The emission coefficients for an electron temperature of 20,000 K are taken from Aller (1984, Table 4.9). This additional emission has a large effect on the broadband spectral energy distribution of the synthetic clusters, shifting energy from the Lyman continuum to the rest-frame optical bands. This effect is included in the broadband color and equivalent width predictions presented below.
In general, we can parameterize the escape of radiation with the quantity , the fraction of ionizing photons that escape from the host halo into the IGM. To be consistent with the typical reionization models presented in Paper II, we uniformly assume for 1 – 4 Ryd and for Ryd (Dove, Shull, & Ferrara 2000; Tumlinson et al. 1999), leaving most ionizing photons at all wavelengths to excite observable nebular emission. We return to the issue of the escape fraction in Paper II, where we discuss justifications for different escape fractions at 1 and 4 Ryd.
In Figure 7 we show the flux of the and Ly lines from the Pop III cluster. The green curves represent continuous star formation at 1 and 40 yr-1. The higher rate corresponds to the star formation rate (SFR) inferred by Hu et al. (2002) for a Ly emitter discovered at (Ly flux marked with the green square). The red curves represent the He II 1640 Å flux from an instantaneous burst of at (solid) and 1 Myr after the burst (dashed). Figure 7 also shows the imaging and spectroscopic sensitivity requirements for the planned 6 m aperture Next Generation Space Telescope (NGST). These assumed limits are from the NGST design specifications and are 2 nJy for low-resolution (R = 5) imaging and 100 nJy for spectroscopy (R = 1000), and both assume S/N = 10 and a 100,000 s exposure time. These comparisons show that the planned NGST will easily discover this signature of the first stars.
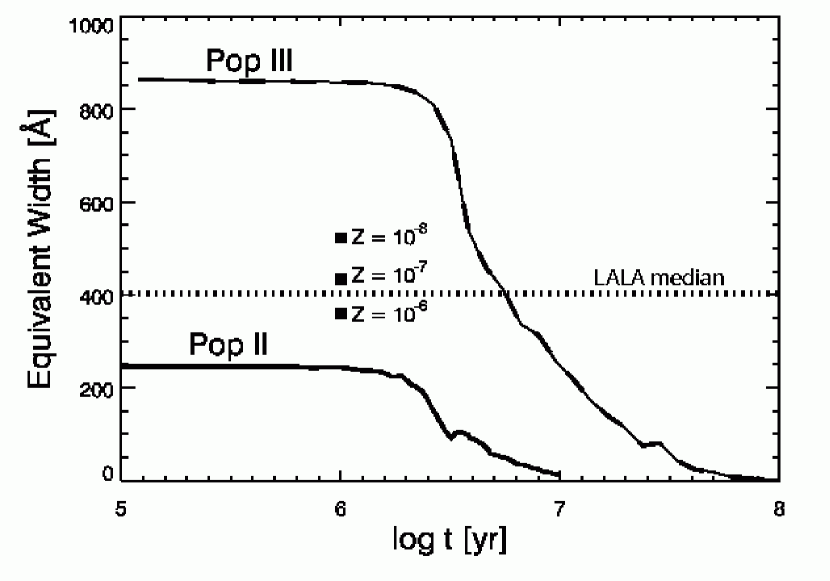
In Case B recombination theory, roughly two thirds of all H recombinations result in the emission of a Ly photon (Spitzer 1978), and these are known to escape from galaxies and serve as a strong signature of high-redshift star formation (Hu et al. 1999; Rhoads et al. 2000). For the Pop III cluster presented here, the Ly line is intrinsically stronger than in Pop II. Figure 8 shows the predictions for the time-dependent Ly equivalent width, , for Pop II and Pop III assuming Case B recombination theory and K. These curves are technically upper limits since the Pop II cluster may suffer dust attenuation and the Pop III Ly line may be absorbed by neutral H in the pre-reionization IGM (cf. Loeb & Rybicki 1999). Equivalent width has the additional benefit of being independent of the total cluster mass for an instantaneous burst. Thus, we confirm the suggestion of other studies (TS, Bromm et al. 2001; Schaerer 2002) that the Ly signatures of the first stars will be unusually strong111We note here that our Ly predictions lie well below those of Schaerer (2002) for similar conditions. We use an average flux in the 1200 - 1250 Å range to represent the continuum flux. This method approximates the observed quantities in surveys such as LALA. If intrinsic Ly absorption is present, our prediction is an overestimate. We can reproduce Schaerer’s prediction only by assuming the continuum flux is represented by the core of the model Ly absorption line.. The Large Area Ly Survey (LALA; Malhotra & Rhoads 2002) found a median of 400 Å in a sample of 157 galaxies with . More than 60% of their detections have Å, the approximate maximum attainable by Pop II clusters (Charlot & Fall 1993).
We also plot in Figure 8 the instantaneous equivalent widths 520, 430, and 360 Å, for the ZAMS spectra, respectively. The points for and straddle the median LALA equivalent width, indicating that this sample of Ly emitters may have a low metallicity. These results suggest that populations of metal-free stars, or perhaps stars of the first metal-enriched generation, have already been found. In future ground- and space-based searches beyond the optical bands, Ly emission will probably serve as the “signpost” of metal-free galaxies. This result could then be confirmed through follow-up detection of the He II lines, which are weaker than Ly and unique to the metal-free regime.
The sensitive dependence of the Ly equivalent width on metallicity (and IMF; see Bromm et al. 2001) suggests that the metallicity evolution of star formation may appear in the observed Ly lines at high redshift. If there is a well-defined Pop III epoch, characterized by a rapid transition to or higher as the second stellar generation forms from gas enriched by the first, there could be a bimodal distribution of Ly equivalent widths with redshift. The peak may appear near the 1000 Å prediction here, nearer the 3000 Å predicted for the high-mass IMF adopted by Bromm et al. (2001), or somewhere in between. Thus, Ly itself may serve as a diagnostic of the evolution of metals in galaxies, up to at least the redshift of H reionization, where the damping wing of Gunn-Peterson absorption in the IGM may play an uncertain role in obscuring (Miralda-Escudé 1998) or transmitting (Loeb & Rybicki 1999; Haiman 2002) the galactic Ly line.
5.3. Broadband Spectra and Colors
Broadband filter search techniques have proven successful in finding high-redshift galaxies. In particular, the “Lyman-break” technique exploits the fact that the IGM absorbs the spectrum of a galaxy shortward of 1216(1+) Å. This powerful technique has uncovered thousands of galaxies at (Steidel et al. 1999).
The high effective temperatures of Pop III stars make their integrated cluster spectra intrinsically bluer than their Pop II counterparts. However, the most distinctive feature of the Pop III spectrum is the large gain in H I and He II ionizing photons, which unfortunately are emitted in the spectral region that is heavily absorbed by the IGM. To account for this obscuration, we adopt a stochastic model of the IGM based on the work of Fardal, Giroux, & Shull (1998), who used Monte Carlo techniques to construct model sightlines containing realistic distributions of H I Ly forest, Lyman limit, and damped Ly clouds. From a sample of 1000 sightlines we construct a mean transmission function for three redshifts, = 4, 5, 6. This realistic treatment of the IGM leaves approximately 30% of the emergent flux between 912(1+) and 1216(1+) Å. This mean transmission function is included in the broadband signatures derived here.
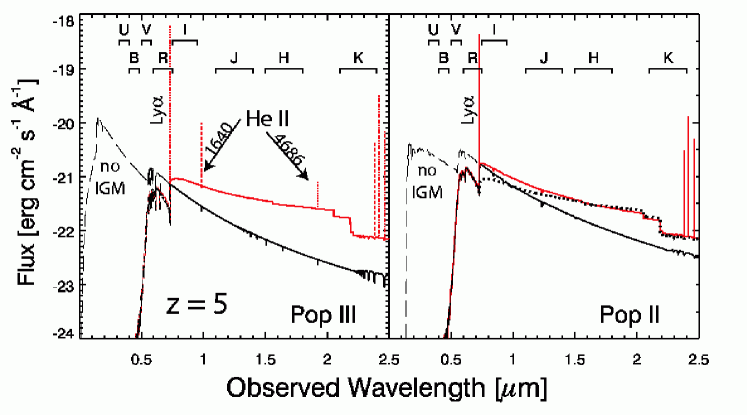
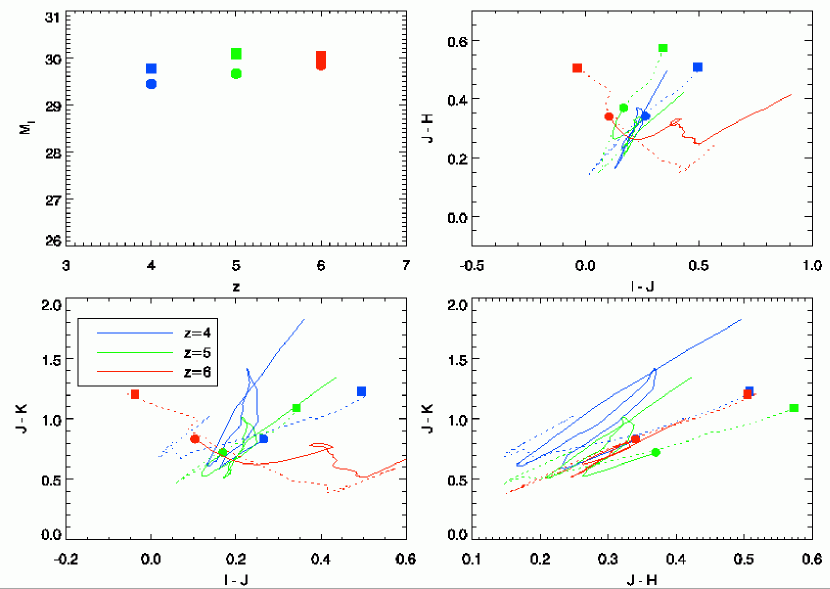
In Figure 9, we illustrate Pop II and Pop III spectra at high redshift. We also plot the ranges of the standard photometric bandpasses. Emission lines are included in these colors and make a modest contribution. Although the Pop III spectrum is intrinsically bluer in the accessible spectral regions, the reprocessing of ionizing photons into nebular emission makes up for this difference. Figure 10 illustrates this similarity between Pop III and Pop II over a range of redshifts and cluster ages ( = 0 – 10 Myr). This substantial degeneracy in the broadband colors may make distinguishing Pop III more challenging for current and planned optical and IR instruments than was previously appreciated. Confusing color signatures may leave the unusual Pop III emission-line signatures as the only means of identifying the first stars.
6. Conclusions
We have presented evolving spectra of metal-free stellar populations, based on newly calculated evolutionary tracks. We find that the evolution of Pop III stars follows the general patterns obeyed at higher metallicity, but with an overall shift to higher temperature. This gain in core and surface temperatures is primarily a result of the restricted abundance of 12C in primordial stars. We have used a grid of non-LTE model atmospheres to produce evolving spectra of synthetic Pop III clusters. These models have been used to compute the broadband colors and emission-line signatures from metal-free stellar clusters at high redshift.
Our specific conclusions fall into two categories. First, the unique composition of the first stars has the following important effects on their spectra:
-
•
They produce 60% more H I ionizing photons than their Pop II counterparts.
-
•
They can produce up to times more He II ionizing photons than Pop II, which may lead to unusual radiative feedback effects on the IGM.
We wish to reemphasize here the uncertainty associated with stellar mass loss in evaluating the latter conclusion. If the “second generation” of stars has and perhaps significant populations of WR stars, the gain in He II ionizing photon production for a continuous star formation model including WR stars is reduced to about a factor of 10 (see Figure 6). However, since the importance of WR stars at extremely low metallicities is in doubt, we conclude that Pop III stars will be far more efficient than their Pop II counterparts at ionizing He II. The consequences of our models for reionization are explored more fully in Paper II, which uses these model spectra and a semi-analytic reionization model to assess the importance of the first stars for full or partial reionization of H I and He II in the IGM.
The peculiar properties of metal-free stars entail unusual observational signatures:
-
•
They are expected to have unusually high equivalent widths of Ly and the He II recombination lines, the most distinctive signature of Pop III stars and their nebular emission. These lines will probably be the primary means of detecting and identifying the first stars.
-
•
While their intrinsic spectra are significantly bluer than their Pop II counterparts, their broadband colors are similar, owing to the reprocessing of Lyman-continuum photons into continuous nebular emission.
Recent Ly surveys suggest that metal-free stars may have already been found. In future ground- and space-based searches beyond the optical bands, Ly emission will probably serve as the “signpost” of metal-free galaxies. Follow-up detections of the He II lines could confirm this result. The substantial degeneracy in the broadband colors will probably leave emission line techniques as the best way of distinguishing the first stars.
References
- (1)
- (2) Aller, L. H., 1984, Physics of Thermal Gaseous Nebulae (Dordrecht: Kluwer)
- (3)
- (4) Becker, R. H., et al. 2001, AJ, 122, 2850
- (5)
- (6) Bromm, V., Coppi, P. S., & Larson R. B. 2000, ApJ, 527, 5
- (7)
- (8) Bromm, V., Kudritzki, R.-P., & Loeb, A. 2001, ApJ, 552, 464
- (9)
- (10) Castellani, V., Chieffi, A., & Tornambe, A. 1983, ApJ, 272, 249
- (11)
- (12) Caughlan, G. R., & Fowler, W. A. 1988, Atomic Data and Nuclear Data Tables, 40, 283
- (13)
- (14) Charlot, S., & Fall, S. M. 1993, ApJ, 415, 580
- (15)
- (16) Djorgovski, S. G., Castro, S. M., Stern, D., & Mahabal, A. 2001, ApJL, 560, L5
- (17)
- (18) Dove, J. B., Shull, J. M., & Ferrara, A. 2000, ApJ, 531, 846
- (19)
- (20) El Eid, M. F., Fricke, K. J., & Ober, W. W. 1983, A&A, 119, 54
- (21)
- (22) Fan, X., et al. 2001, AJ, 123, 1247
- (23)
- (24) Fardal, M., Giroux, M. L., & Shull, J. M. 1998, AJ, 115, 2206
- (25)
- (26) Gnedin, N. Y., & Ostriker, J. P. 1997, ApJ, 486, 581
- (27)
- (28) Haiman, Z. 2002, ApJ, 576, L1
- (29)
- (30) Hix, W. R., & Thielemann, F.-K. 1999, Journal of Computational and Applied Mathematics, 99, 321
- (31)
- (32) Hu, E. M., McMahon, R. G., & Cowie, L. L. 1999, ApJ, 522, L9
- (33)
- (34) Hu, E. M., et al. 2002, ApJ, in press (astro-ph/0203091)
- (35)
- (36) Hubeny, I., & Lanz, T. 1995, ApJ, 439, 875
- (37)
- (38) Iglesias, C. A., & Rogers, F. J., 1996, ApJ, 464, 943
- (39)
- (40) Kippenhahn, R., Weigert, A., & Hofmeister, E. 1967, Methods of Computational Physics, 7, 129
- (41)
- (42) Klapp, J. 1983, A&SS, 93, 313
- (43)
- (44) Kriss, G., Shull, J. M., Oegerle, W. R., Zheng, W., Davidsen, A. F., Songaila, A., Tumlinson, J., et al. 2001, Science, 293, 1112
- (45)
- (46) Kudritzki, R.-P. 2000, in The First Stars, ESO Astrophys. Symp., ed. A. Weiss, T. Abel, & V. Hill (Berlin: Springer), 127
- (47)
- (48) Kudritzki, R.-P. 2002, ApJ, 577, 389
- (49)
- (50) Lanzetta, K. M., et al. 2002, ApJ, in press (astro-ph/0111129)
- (51)
- (52) Loeb, A., & Rybicki, G. B. 1999, ApJ, 524, 527
- (53)
- (54) Maeder, A., & Meynet, G. 1987, A&A, 182, 243
- (55)
- (56) Malhotra, S., & Rhoads, J. E. 2002, ApJ, 565, L71
- (57)
- (58) Marigo, P., Girardi, L., Chiosi, C., & Wood, P. R. 2000, A&A, 371, 152
- (59)
- (60) Miralda-Escudé, J. 1998, ApJ, 501, 15
- (61)
- (62) Osterbrock, D. E., 1989, Astrophysics of Gaseous Nebulae and Active Galactic Nuclei (Mill Valley: University Science Books)
- (63)
- (64) Pettini, M., Rix, S. A., Steidel, C. C., Adelberger, K. L., Hunt, M. P., & Shapley, A. E. 2002 ApJ, submitted, astro-ph/0110637
- (65)
- (66) Press, W. H., Flannery, B. P., Teukolsky, S. A., & Vetterling, W. T. 1986, Numerical Recipes: The Art of Scientific Computing (Cambridge: Cambridge University Press)
- (67)
- (68) Rhoads, J. E., Malhotra, S., Dey, A., Stern, D., Spinrad, H., & Jannuzi, B. T. 2000, ApJ, 545, 85
- (69)
- (70) Ricotti, M., Gnedin, N. Y., & Shull, J. M. 2002, ApJ, 575, in press
- (71)
- (72) Schaerer, D., 2002, A&A, in press
- (73)
- (74) Schaerer, D., & Vacca, W. D. 1998, ApJ, 497, 618
- (75)
- (76) Schaller, G., Schaerer, D., Meynet, G., & Maeder, A., 1992, A&AS, 96, 269
- (77)
- (78) Schneider, D. P., et al. 2002, AJ, 123, 567
- (79)
- (80) Schramm, D. N., & Turner, M. S. 1998, Rev Mod Phys, 70, 303
- (81)
- (82) Seaton, M. J. 1978, MNRAS, 185, 5
- (83)
- (84) Shull, J. M., Tumlinson, J., et al. 2002, ApJ, in preparation
- (85)
- (86) Siess, L., Livio, M., & Lattanzio, J. 2002, ApJ, in press
- (87)
- (88) Spitzer, L. 1978, Physical Processes in the Interstellar Medium (New York: Wiley)
- (89)
- (90) Steidel, C. C., et al. 1999, ApJ, 519, 1
- (91)
- (92) Telfer, R. C., Zheng, W., Kriss, G. A., & Davidsen, A. F. 2002, ApJ, 465, 773
- (93)
- (94) Tumlinson, J., Giroux, M. L., Shull, J. M., & Stocke, J. T. 1999, AJ, 118, 2148
- (95)
- (96) Tumlinson, J., & Shull, J. M. 2000, ApJ, 528, L65 (TS)
- (97)
- (98) Tumlinson, J., Giroux, M. L., & Shull J. M. 2001, ApJ, 550, L1 (TGS)
- (99)
- (100) Venkatesan, A., Tumlinson, J., & Shull, J. M. 2002, submitted (Paper II)
- (101)
- (102) Zheng, W., Kriss, G. A., Telfer, R. C., Grimes, J. P., & Davidsen, A. F. 1997, ApJ, 475, 469
- (103)
Class Reaction PPI 1H + 1H 2H + 2H + 1H 3He + 3He + 3He 4He + 21H PPII 3He + 4He 7Be + 7Be + e- 7Li + 7Li + 1H 24He PPIIII 7Be + 1H 8B + 8B 8Be∗ + + 8Be∗ 24He CNO 12C + 1H 13N + 13N 13C + e+ + 13C + 1H 14N + 14N + 1H 15O + 15O 15N + e+ + 15N + 1H 12C + 4He 15N + 1H 16O + 16O + 1H 17F + 17F 17O + e+ + 17O + 1H 14N + 4He 17O + 1H 18O + e+ + 3 4He + 4He 8Be∗ 8Be∗ 24He 8Be∗ + 4He 12C + capture 12C + 4He 16O + 16O + 4He 20Ne + 20Ne + 4He 24Mg + 14N + 4He 18F + 18O + 4He 22Ne + 22Ne + 4He 25Mg + n
Mass () (yr) 1 5.87109 3 2.01108 5 6.03107 7 3.11107 10 1.76107 12 1.40107 15 1.11107 20 8.47106 30 5.86106 50 4.09106 70 3.42106 100 2.93106