A survey of molecular hydrogen in the central galaxies of cooling flows
Abstract
We present a large sample of H- and K-band spectra of 32 optically line-luminous central cluster galaxies. We find significant rovibrational H2 emission in 23 of these galaxies as well as H recombination and/or [FeII] emission in another 5. This represents a fourfold increase in the number of molecular line detections known. A number of the detections are of extended emission (5–20 kpc). In several objects we find significant [SiVI] emission that appears to correlate with the strength of high ionization lines in the optical (e.g. [OIII]). This comprehensive sample builds on previous work and confirms that warm (1000–2500 K) molecular hydrogen is present wherever there is ionized material in the cores of cooling flows and in most cases it also coincides with CO molecular line emission.
keywords:
galaxies: active — galaxies: starburst — galaxies: cooling flow — galaxies: individual: A11, A85, A646, A795, A1068, A1664, A1795, A1835, A1885, A2029, A2052, A2199, A2204, A2390, A2597, Her-A, Hydra-A, NGC 1275, RXJ0338+09, RXJ0352+19, RXJ0439+05, RXJ0747-19, Zw235, Zw3146, Zw3916, Zw7160, Zw8193, Zw8197, Zw8276, 4C+55.16 — X-ray: cooling flow1 INTRODUCTION
The cooling time of hot X-ray-emitting gas in the central regions of massive, relaxed clusters of galaxies can be substantially less than the Hubble time. The gas in these regions can thus cool and recombine, initiating a cooling flow (Fabian & Nulsen 1977; Cowie & Binney 1977). The ultimate fate of this cooling gas has been the subject of an extensive and strongly contested debate (see Fabian 1994). The cold gas has not been detected in molecular form and so is inferred to reside in a phase with k. Calculations of the gas properties are consistent with current observed limits (Ferland, Fabian & Johnstone 1994).
Until recently, the only cooling flow known to contain molecular gas was that around NGC 1275 in Perseus (see Bridges & Irwin 1998), although the interpretation of this source is complicated by the strongly varying nuclear component. Moreover, the presence of the molecular gas may be related to the apparently on-going merger in this system, which has been the subject of a long-running debate (Van den Bergh 1977; Hu et al. 1983; Pedlar et al. 1990; Holtzman et al. 1992; Norgaard-Nielsen et al. 1993). Another observational window on molecular hydrogen lies in the near-infrared where a number of strong rovibrational lines fall in the K-band. These lines have been detected in 8 different cooling flow central cluster galaxies (Jaffe & Bremer 1997; Falcke et al. 1998; Krabbe et al. 2000; Wilman et al. 2000; and Jaffe, Bremer & van der Werf 2001). The detection of molecular gas at 1000-2500 K implies excitation is required and that only a very small amount of ‘hot’ molecular gas is present. So there is evidence for some molecular gas in the cores of cooling flows but its relation to the deposited gas predicted from the X-ray observations is far from clear.
This situation has been radically altered with the detection of CO line emission in 16 central cluster galaxies by Edge (2001). The molecular gas masses of 109-11.5 M⊙ imply that around 2–10% of the total deposited gas predicted from previous X-ray observations can be accounted for directly. However, with the dramatically reduced mass deposition rates found in Chandra and XMM-Newton observations (Allen, Ettori & Fabian 2001, Schmidt, Allen & Fabian 2001, Peterson et al. 2001), the molecular gas masses derived from CO observations are within a factor of three of that now expected. The mass of molecular gas appears to correlate best with the optical emission line luminosity indicating that the molecular gas observed is warmed from a lower temperature. The rapid progress in this field has been possible due to the selection of massive cooling flows from the ROSAT All-Sky Survey (see Crawford et al. 1999), few of which were known before 1990. To provide a direct comparison of the ‘hot’ (1000–2500 K) and ‘cool’ (30 K) molecular gas components requires near-infrared spectra of the systems that have been searched for CO.
In this paper we present the spectra and analysis for a systematic search for near-infrared hydrogen molecular lines in a complete sample of strong optical emission line emitting central galaxies drawn from Crawford et al. (1999). An flux limit of erg cm-2s-1 was adopted to ensure moderately bright lines and a redshift range of 0.03 to 0.3 to cover at least one H2 line in the K-band. This selection produces a sample of 18 objects reachable with UKIRT (one, A2146, is above the declination limit of 60∘). Of this sample, only one object, A478, has not been observed in this study but it has a published spectrum (Jaffe, Bremer & van def Werf 2001). We also include seven weaker line emitting or lower redshift objects from Crawford et al. (1999) to fully sample any potential range in recombination lines to molecular line ratios, seven non-BCS central cluster galaxies with strong optical emission lines drawn from the literature (e.g. NGC 1275, A2597 and PKS 0745191), and one control object with no lines (A2029) giving a total sample of 32 spectra. We also extend our spectral coverage to [FeII] in the majority of our targets making this the first comprehensive study of this line in central cluster galaxies.
Throughout we assume and km s-1 Mpc-1.
2 OBSERVATIONS
The observations presented in this paper were taken with the CGS4 spectrograph on the United Kingdom Infrared Telescope (UKIRT) in September 1999 and March 2000, as shown in the observing log in Table 1. The 256256 InSb array, 40 l/mm grating and 300 mm focal length camera were used giving a spatial scale of 0.61 arcsec per pixel. With a 2-pixel (1.22′′) wide slit this set-up achieves spectral resolutions of 880 and 570 km s-1 FWHM in the H- and K-bands respectively. In all but two observations, the slit was oriented at a position angle of 0 degrees (north-south). The NDSTARE mode was used along with the conventional object-sky-sky-object nodding pattern. Atmospheric absorption features were removed by ratioing with main sequence F stars and the spectra were calibrated against photometric standards. We add in one short, archival observation (A262, a CO detection made after our March 2000 run) which used the 75 l/mm grating with a 1-pixel (0.61′′) slit at a position angle of 2.9∘. The spectra were reduced using version V1.3-0 of the Portable CGS4 Data Reduction package available through Starlink.
| Cluster | Redshift | Date | wavelength | exposure |
|---|---|---|---|---|
| (m) | time (min) | |||
| Zw8276 | 0.075 | 02/09/99 | 1.87–2.49 | 64 |
| A2390 | 0.2328 | 02/09/99 | 1.87–2.49 | 80 |
| Zw235 | 0.083 | 02/09/99 | 1.87–2.49 | 64 |
| RXJ0352+19 | 0.109 | 02/09/99 | 1.87–2.49 | 48 |
| RXJ0338+09 | 0.0338 | 02/09/99 | 1.87–2.49 | 80 |
| Zw8193 | 0.1754 | 03/09/99 | 1.87–2.49 | 64 |
| Zw8197 | 0.1140 | 03/09/99 | 1.87–2.49 | 40 |
| A2597 | 0.0852 | 03/09/99 | 1.87–2.49 | 64 |
| A11 | 0.151 | 03/09/99 | 1.87–2.49 | 40 |
| A85 | 0.0555 | 03/09/99 | 1.87–2.49 | 40 |
| RXJ0439+05 | 0.208 | 03/09/99 | 1.87–2.49 | 32 |
| NGC1275 | 0.0176 | 03/09/99 | 1.87–2.49 | 24 |
| RXJ0821+07 | 0.110 | 21/03/00 | 1.87–2.49 | 84 |
| A795 | 0.1355 | 21/03/00 | 1.87–2.49 | 60 |
| A1068 | 0.1386 | 21/03/00 | 1.87–2.49 | 80 |
| A1664 | 0.1276 | 21/03/00 | 1.87–2.49 | 48 |
| A1835 | 0.2523 | 21/03/00 | 1.87–2.49 | 60 |
| A2204 | 0.1514 | 21/03/00 | 1.87–2.49 | 52 |
| A646 | 0.1268 | 22/03/00 | 1.87–2.49 | 80 |
| 4C+55.16 | 0.242 | 22/03/00 | 1.87–2.49 | 40 |
| A1795 | 0.062 | 22/03/00 | 1.87–2.49 | 40 |
| Her-A | 0.154 | 22/03/00 | 1.87–2.49 | 41 |
| RX0747-19 | 0.1028 | 23/03/00 | 1.87–2.49 | 80 |
| Zw3146 | 0.2906 | 23/03/00 | 1.87–2.49 | 60 |
| Zw3916 | 0.204 | 23/03/00 | 1.87–2.49 | 30 |
| A1885 | 0.090 | 23/03/00 | 1.87–2.49 | 44 |
| A2029 | 0.0786 | 23/03/00 | 1.87–2.49 | 52 |
| A2199 | 0.031 | 23/03/00 | 1.87–2.49 | 52 |
| RX0821+07 | 0.110 | 24/03/00 | 1.87–2.49 | 16 (PA=77 deg) |
| RX0821+07-off | 0.110 | 24/03/00 | 1.87–2.49 | 44 (PA=77 deg) |
| Hydra-A | 0.0538 | 24/03/00 | 1.87–2.49 | 40 |
| Zw7160 | 0.2578 | 24/03/00 | 1.87–2.49 | 48 |
| A2052 | 0.0351 | 24/03/00 | 1.87–2.49 | 52 |
| RX0747-19 | 0.1028 | 25/03/00 | 1.35–1.96 | 32 |
| RX0821+07 | 0.110 | 25/03/00 | 1.35–1.96 | 12 (PA=77 deg) |
| RX0821+07-off | 0.110 | 25/03/00 | 1.35–1.96 | 28 (PA=77 deg) |
| A1068 | 0.1386 | 25/03/00 | 1.35–1.96 | 28 |
| Hydra-A | 0.0538 | 25/03/00 | 1.35–1.96 | 24 |
| Zw3146 | 0.2906 | 25/03/00 | 1.35–1.96 | 42 |
| A1664 | 0.1276 | 25/03/00 | 1.35–1.96 | 32 |
| A1795 | 0.062 | 25/03/00 | 1.35–1.96 | 40 |
| A2052 | 0.0351 | 25/03/00 | 1.35–1.96 | 40 |
| A2204 | 0.1514 | 25/03/00 | 1.35–1.96 | 60 |
| A262 | 0.0166 | 12/08/97 | 1.82-2.48 | 2 |
3 RESULTS
The individual K- and H- band spectra are presented in Figures 1 and 2 respectively in the order they appear in Table 1. The line fluxes are summarised in Table 2 in RA order.
Several of the observations show significant extent or velocity structure or were selected from the literature, so we discuss these individually here:
A11 Selected as X-ray luminous radio galaxy by Perlman et al. (1998) but it is a central cluster galaxy. This galaxy was included in this study on the basis of a published spectrum and not on X-ray flux (which is below 3 erg cm-2 s-1 0.1–2.4 keV).
RXJ0747-19 aka PKS 0745-191 This system has HST narrow band imaging with NICMOS (Donahue et al. 2000) that shows extended emission. Our CGS4 spectrum does not sample the E-W extension highlighted by Donahue et al. (2000) but shows significant extent in both Pa and 1-0 S(1) and S(3) over 5 pixels (3.0′′) or 8 kpc to the North, consistent with the HST data. See section 4.4 for further discussion.
RXJ0821+07 This system is highly anomalous in virtually every waveband so far observed and the NIR is no exception. A strong, velocity-offset CO detection is made in this cluster (Edge 2001) and the optical morphology of the central galaxy is very peculiar in a recent HST snapshot with an infalling galaxy apparently being disrupted (Bayer-Kim et al. 2002). We made an additional CGS4 observation to cover the region of this infalling galaxy but made no significant detection of any H2 lines although Pa was extended over 4 pixels (2.4′′) or 6 kpc to the North. The lack of NIR H2 emission is surprising given the strength of the CO line. This could be an indication that the mechanism exciting the molecular gas in RXJ0821+07 is different from that behind the majority of the other detections presented here.
4C+55.16 The central galaxy in this cluster contains a very strong flat spectrum radio source so it is possible that the S(3) line is blended with [SiVI]. At the resolution used in this work it is not possible to determine the contribution of each line. This cluster was included in this study on the basis of its known cooling flow (Iwasawa et al. 1999) and does not fall above the X-ray flux limit of the BCS and hence not in the Crawford et al. (1999) sample.
A1068 This system is one of the strongest optical line emitters in the sample. Both the Pa and H2 lines are extended to the south by 4 pixels (2.4′′) or 8 kpc (see section 4.4).
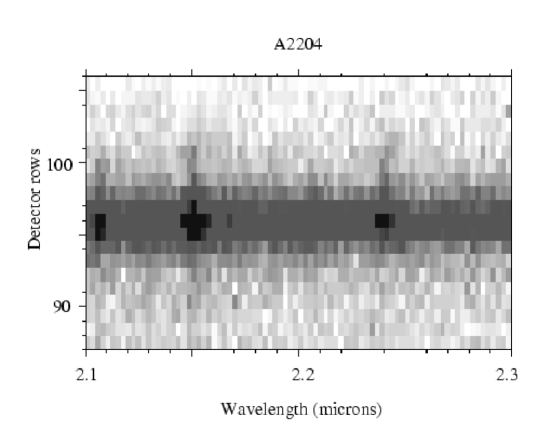
A2204 The Pa and H2 lines are also extended to the south by 5 pixels (3.0′′) in this system but show also a velocity shift of 200–300 km s-1. The [FeII] for this source is particularly strong (see Section 4.2).
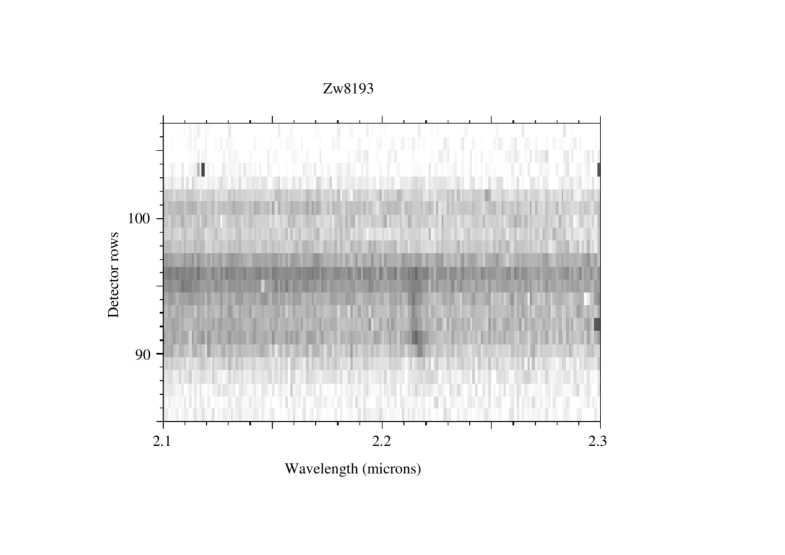
Zw8193 This system is the most complex spatially and in velocity. From the original discovery spectrum in Allen et al. (1992) it was noted that the absorption and emission lines were not coincident in velocity. The reasons behind this are evident from our CGS4 spectra which showed two distinct components 3′′ or 12 kpc apart (but both contained in the INT FOS aperture) that each show lines but with a velocity difference of 400–500 km s-1. There is extended line emission between the two components (see section 4.4). This cluster is a prime candidate for observation with the next generation of infrared integral field units.
A2597 This galaxy has HST narrow band imaging with NICMOS (Donahue et al. 2000) and, as in the case of RXJ0747-19, the extended emission over 7 pixels (4.2′′ or 9 kpc) we find to the North is consistent with these higher spatial resolution HST data.
NGC1275 This galaxy has been studied in detail in the NIR by a number of previous workers most recently Krabbe et al. (2000). Our CGS4 spectrum adds the detection of the 1-0 Q series to the literature as previous spectra did not cover wavelength redward of 2.35m. The majority of the lines are detected as extended with the 1-0 S(1) line found in 8 pixels (4.9′′) or 2.3 kpc.
| Cluster | line | flux |
|---|---|---|
| (10-15 ) | ||
| A11 | Pa | 2.16 0.15 |
| 1-0 S(1) | 1.14 0.16 | |
| 1-0 S(2) | 0.26 0.09 | |
| 1-0 S(3) | 0.49 0.15 | |
| 1-0 S(5) | 0.53 0.14 | |
| 1-0 S(7) | 0.71 0.19 | |
| [FeII]1.644 | 1.18 0.16 | |
| A85 | Pa | 0.4 0.1 |
| 1-0 S(1) | ||
| Zw235 | no lines detected | |
| A262 | 1-0 S(1) | 1.14 0.28 |
| 1-0 S(3) | 1.95 0.67 | |
| RXJ0338+09 | Pa | 2.30 0.14 |
| 1-0 S(1) | 1.21 0.10 | |
| 1-0 S(2) | 0.62 0.06 | |
| 1-0 S(3) | 1.81 0.06 | |
| NGC1275 | Pa | 65.7 0.7 |
| Br | 4.4 0.35 | |
| Br | 4.1 0.25 | |
| 1-0 S(0) | 8.44 0.30 | |
| 1-0 S(1) | 29.1 0.36 | |
| 1-0 S(2) | 7.59 0.26 | |
| 1-0 S(3) | 26.6 0.34 | |
| 1-0 S(4) | 7.0 0.40 | |
| 2-1 S(1) | 2.98 0.30 | |
| 2-1 S(3) | 2.37 0.33 | |
| 1-0 Q(1) | 24.2 0.53 | |
| 1-0 Q(2) | 7.86 0.43 | |
| 1-0 Q(3) | 23.7 0.60 | |
| 1-0 Q(4) | 8.14 0.46 | |
| 1-0 Q(5) | 15.3 0.85 | |
| [SXI]1.92 | 5.2 0.44 | |
| RXJ0352+19 | Pa | 1.58 0.13 |
| 1-0 S(1) | 1.29 0.13 | |
| 1-0 S(2) | 0.57 0.097 | |
| 1-0 S(3) | 1.85 0.11 | |
| 1-0 S(4) | 0.29 0.15 | |
| 1-0 S(5) | 0.62 0.13 | |
| RXJ0439+05 | Pa | 0.86 0.16 |
| 1-0 S(3) | 0.45 0.16 | |
| [FeII]1.644 | 0.38 0.09 | |
| RXJ0747-19 | Pa | 2.98 0.10 |
| Br | 0.25 0.07 | |
| 1-0 S(0) | 0.36 0.10 | |
| 1-0 S(1) | 1.29 0.09 | |
| 1-0 S(2) | 0.46 0.07 | |
| 1-0 S(3) | 1.24 0.085 | |
| 1-0 S(4) | 0.43 0.08 | |
| 1-0 S(5) | 0.92 0.09 | |
| 1-0 S(7) | 0.50 0.10 | |
| [Si VI] | 0.50 0.06 | |
| [FeII]1.644 | 3.0 0.4 | |
| RXJ0821+07 | Pa | 2.60 0.08 |
| (PA=0 deg) Br | 0.27 0.08 | |
| 1-0 S(3) | 0.27 0.10 |
| Table 2 continued | ||
|---|---|---|
| Cluster | line | flux |
| (10-15 ) | ||
| RXJ0821+07 | Pa | 0.80 0.08 |
| (PA=77 deg) | 1-0 S(5) | 0.28 0.17 |
| [FeII]1.644 | 1.2 | |
| RXJ0821+07-offset | Pa | 2.37 0.13 |
| (PA=77 deg) | [FeII]1.644 | 0.56 |
| A646 | Pa | 0.52 0.08 |
| 1-0 S(3) | 0.22 0.08 | |
| 1-0 S(5) | 0.27 0.09 | |
| 4C+55.16 | Pa | 1.62 0.16 |
| 1-0 S(3) | 0.85 0.16 | |
| 1-0 S(4) | 0.27 0.13 | |
| 1-0 S(5) | 0.29 0.08 | |
| 1-0 S(7) | 0.43 0.08 | |
| [FeII]1.644 | 0.86 0.16 | |
| A795 | Pa | 0.52 0.16 |
| Hydra-A | Pa | 1.37 0.14 |
| 1-0 S(1) | 0.36 0.07 | |
| 1-0 S(2) | 0.30 0.08 | |
| 1-0 S(3) | 0.79 0.12 | |
| [FeII]1.644 | 1.7 0.7 | |
| Zw3146 | Pa | 2.32 0.10 |
| Pa | 1.2 0.2 | |
| 1-0 S(4) | 0.35 0.11 | |
| 1-0 S(5) | 0.49 0.09 | |
| 1-0 S(7) | 0.25 0.07 | |
| [FeII]1.644 | 0.64 0.08 | |
| [FeII]1.258 | 1.1 0.2 | |
| A1068 | Pa | 6.57 0.09 |
| Br | 0.66 0.11 | |
| 1-0 S(1) | 2.54 0.09 | |
| 1-0 S(2) | 0.84 0.08 | |
| 1-0 S(3) | 2.38 0.10 | |
| 1-0 S(4) | 0.48 0.10 | |
| 1-0 S(5) | 1.38 0.10 | |
| 1-0 S(6) | 0.37 0.15 | |
| 1-0 S(7) | 1.33 0.09 | |
| 2-1 S(3) | 0.34 0.16 | |
| [Si VI] | 0.47 0.10 | |
| [FeII]1.644 | 2.5 0.4 | |
| Zw3916 | 1-0 S(7) | 0.25 0.12 |
| A1664 | Pa | 2.34 0.18 |
| 1-0 S(1) | 0.79 0.12 | |
| 1-0 S(2) | 0.21 0.07 | |
| 1-0 S(3) | 0.60 0.10 | |
| 1-0 S(5) | 0.42 0.16 | |
| 1-0 S(7) | 0.41 0.15 | |
| [FeII]1.644 | 1.06 0.36 | |
| A1795 | Pa | 1.07 0.13 |
| 1-0 S(1) | 0.59 0.21 | |
| 1-0 S(3) | 1.04 0.09 | |
| 1-0 S(5) | 1.19 0.16 | |
| [FeII]1.644 | 0.5 0.3 |
| Table 2 continued | ||
|---|---|---|
| Cluster | line | flux |
| (10-15 ) | ||
| A1835 | Pa | 3.03 0.09 |
| 1-0 S(3) | 0.94 0.11 | |
| 1-0 S(5) | 0.55 0.06 | |
| [FeII]1.644 | 0.34 0.10 | |
| A1885 | no lines detected | |
| Zw7160 | [FeII]1.644 | 0.18 0.07 |
| A2029 | lineless control | |
| A2052 | Pa | 0.75 0.24 |
| [FeII]1.644 | 0.55 | |
| A2199 | Pa | 0.89 0.35 |
| A2204 | Pa | 2.17 0.10 |
| Pa | 0.6 0.4 | |
| 1-0 S(1) | 1.18 0.12 | |
| 1-0 S(2) | 0.48 0.09 | |
| 1-0 S(3) | 1.21 0.08 | |
| 1-0 S(4) | 0.36 0.08 | |
| 1-0 S(5) | 0.78 0.08 | |
| 1-0 S(7) | 0.43 0.10 | |
| 2-1 S(3) | 0.17 0.07 | |
| [FeII]1.644 | 2.0 0.4 | |
| [FeII]1.258 | 2.1 0.3 | |
| Her-A | Pa | 0.37 0.08 |
| 1-0 S(1) | 0.28 0.10 | |
| 1-0 S(3) | 0.35 0.08 | |
| 1-0 S(5) | 0.21 0.06 | |
| Zw8193 | Pa | 1.42 0.08 |
| (Component A) | 1-0 S(3) | 0.79 0.10 |
| [FeII]1.644 | 1.12 0.13 | |
| Zw8193 | Pa | 1.07 0.09 |
| (Component B) | [FeII]1.644 | 0.69 0.19 |
| Zw8197 | no lines detected | |
| Zw8276 | Pa | 0.43 0.09 |
| 1-0 S(1) | 0.82 0.09 | |
| 1-0 S(3) | 1.02 0.09 | |
| 1-0 S(5) | 0.47 0.1 | |
| A2390 | Pa | 0.43 0.09 |
| 1-0 S(3) | 0.45 0.13 | |
| [FeII] | 0.38 0.16 | |
| A2597 | Pa | 2.43 0.20 |
| 1-0 S(0) | 1.08 0.18 | |
| 1-0 S(1) | 3.38 0.10 | |
| 1-0 S(2) | 1.20 0.19 | |
| 1-0 S(3) | 3.34 0.15 | |
| 1-0 S(4) | 0.82 0.17 | |
| 1-0 S(5) | 2.00 0.14 | |
| 1-0 S(7) | 1.05 0.21 | |
| 2-1 S(1) | 0.77 0.30 |


4 DISCUSSION
The observations presented here are the largest near-IR spectroscopic study of central cluster galaxies in cooling flows by a factor of four. Seven of the objects presented have previously published IR spectra. Hydra-A, RXJ0338+09, RXJ0747-19, NGC1275, A1795, A2029 and A2597 are included in Falcke et al. (1998), Jaffe & Bremer (1997), Krabbe et al. (2000) and Jaffe, Bremer & van der Werf (2001). The line fluxes are all within 30% of those presented elsewhere when the different slit widths are taken into account (e.g. Jaffe et al. 2001 use a slit width of 2′′ to 1.2′′ used in the paper). In addition, this study includes, for the first time, coverage of the [FeII] line.
In this section we discuss the limits this dataset can place on reddening, trends in the [FeII] line, detection of high ionization lines and column density constraints.
4.1 Reddening
One of the most important results from the optical spectroscopy of central cluster galaxies is the significant reddening of the lines (Allen et al. 1995; Crawford et al. 1999). The values of E(B-V) derived imply column densities of 1–5 cm-2.
There are several combinations of optical and NIR lines that can be used to gauge the reddening. The most straightforward is H/Pa. Figure 3 shows the ratio of H/Pa with redshift for our joint detections with Crawford et al. (1999). The majority of the points agree with the ratio expected from Case B recombination (Osterbrock 1989) but several outliers are obvious. The majority of the objects have ratios consistent with E(B-V) and are consistent with the values derived from H/H ratios by Crawford et al. (1999). The objects with the three lowest ratios (A1068, A1835 and RXJ0821+07) have high E(B-V) values in Crawford et al. (1999) (0.39, 0.40 and 1.16 respectively) which are consistent with those implied from this analysis (0.540.02, 0.540.03 and 0.710.04). However, there are several objects with similar values of E(B-V) in Crawford et al. (1999) where our estimate is substantially lower (e.g. A1664, 0.46 vs. 0.120.05). This variation may be due in part to the extent of the emission lines and the fact that the optical and CGS4 spectra, while using the same slit width (1.2′′), were not performed at the same position angle. Therefore there are several points (e.g. Zw8276) where the optical line is brighter by a factor of two and others (e.g. RXJ0821+07) where the line is fainter by a factor of three.
The only other reddening diagnostic line combination available within our CGS4 data are the [FeII] lines at 1.258 and 1.644m. We have data for two objects, Zw3146 and A2204, and the equivalent E(B-V) values, given the expected ratio of 1.258m to 1.644m of 1.3, are 0.1 and 0.50.3 (as opposed to 0.2 and 0.0 in Crawford et al. 1999).
Given the restrictions on the current datasets it is not possible to make any quantitative statements about reddening from our data. Future narrow-band imaging in the optical and NIR will allow direct comparison of the H, H and Pa lines and enable us to derive more reliable reddening maps.

4.2 [FeII] emission
For the majority of our sample we have obtained data for [FeII]1.644m through the redshifting of the line into the K-band or an H-band spectrum. Time limitations during our first run prevented all low redshift objects being observed in the H-band but we have [FeII] significant detections for 12 of a total of 18 objects that we have covered at the equivalent of rest 1.644m (and an additional two marginal detections, A1795 and A2390). Most of the non-detections for [FeII] are for clusters without any molecular line detection in the K-band.
From the [FeII] data we have it appears that the strength of this feature correlates with the other near-infrared and optical lines but most significantly with [OI] 6300Å(Mouri et al. 1990). There are several objects where the [FeII] is particularly strong (e.g. A2204 and A1068) and these objects show the strongest [OI]. Therefore, these two lines are probably closely related in these systems. Figure 4 shows a comparison of the fluxes of [OI] and [FeII] lines for this sample.
There is a substantial literature on the potential origin of [FeII] emission in Seyfert galaxies and starbursts (Kawara, Nishida & Taniguchi 1988, Mouri et al. 1990, Simpson et al. 1996, Mouri, Kawara, & Taniguchi 2000) but no firm conclusions have yet been drawn on the exact excitation mechanism in these systems. The [FeII] and [OI] are of particular diagnostic importance as they have ionization potentials of 16.2 and 13.6eV respectively so trace regions where hydrogen is partially ionized as it has a very similar ionization potential. Shocks or X-ray heating are favoured in cases where [FeII] is strong compared to Br and both these mechanisms may play a role in the cooling flow systems presented here (see Wilman et al. 2002).

4.3 [SiVI] and other high ionization lines
One of the most striking results from this study is the presence of [SiVI] and several other high ionization lines (e.g. [SIX], 2-1 S(3) and HeI in the wing of Pa) in a few objects (Cyg-A; Wilman et al. (2000), A1068 and PKS0745-191). These objects are the ones with the strongest [OIII] lines (e.g. all central cluster galaxies known with [OIII] brighter than 10-14 erg cm-2 s-1) and most (but not all) have strong radio sources. The ionization potential of [SiVI] (167 eV) implies the presence of a strong non-thermal source and is consistent with the optical and radio observations.
One prediction from these observations is that high resolution X-ray imaging may detect the unresolved X-ray emission from the nucleus (as found in Hydra-A - McNamara et al. 2000). All the objects in this study with detected [SiVI] have Chandra observations and the brightest (NGC 1275) has a well-established nuclear detection.
Our data are at too low a spectral resolution to determine if the high ionization lines have a significantly different line width to the Paschen or molecular hydrogen lines. In addition, we can determine no spatial differences in these lines. Clearly higher spectral and spatial resolution data will help determine the relative importance of nuclear excitation in different objects. The orientation of any radio jets and dust lanes in HST images are additional factors in determining what is illuminated and how much of it we observe.
As noted above, the presence of higher ionization lines is not necessarily related to the radio power of the central galaxy. A1068 is a relatively weak radio source but has strong [OIII] and significant Br- and [Si VI]. Therefore, the active nuclei in central cluster galaxies are not exclusively radio-loud.
4.4 Spatial and velocity structure
A number of galaxies in this study show extended line emission (as discussed in section 3). The four systems with the most significant extents are presented in Figure 5, which shows the line strength of 1-0 S(1) and Pa with position on the slit. Three of these four show stronger Pa in the centre compared to 1-0 S(1), with only A2597 showing a constant line ratio. This spatial variation implies that the excitation of hydrogen is strongest near the nucleus of the galaxy, probably due to the action of an active nucleus as discussed above. Variations in 1-0 S(1) to H+[NII] of a similar magnitude are observed by Donahue et al. (2000) for A2597 and RXJ0747-19. Although the effects of dust could significantly affect the Donahue et al. (2000) ratios, it is encouraging to note that spatial variations can be extracted from HST imaging of such systems and hence the relative importance of different excitation mechanisms with radius from the centre of the galaxy.
Two of the galaxies in this study also show significant velocity structure (A2204 and Zw8193). Figure 6 shows the reduced 2-D frames of these objects. The velocity shear is present in both the ionized and molecular gas lines in A2204 but is most pronounced in the 1-0 S(3) line. In Zw8193 the molecular lines are weak compared to Pa so a direct comparison of the two phases is not possible.
The amplitudes of these velocity shifts (300 km s-1) are at the limit of the resolution provided by CGS4 and higher resolution integral field spectroscopy has the potential to reveal more about the properties of these systems. Determining the velocity structure of the ionized and molecular gas components can set stringent limits on the importance of galaxy-galaxy or ICM/radio-jet interactions in these dense cooling flow core regions.


4.5 Correlation with CO-deduced molecular gas mass
The recent detection of CO in many of the targets in this survey by Edge (2001) allows us to compare the amount of ‘hot’ (1000 K) to ‘cool’ (30 K) molecular hydrogen. Figure 7 shows the luminosity of the 1-0 S(1) line (or its equivalent) against molecular hydrogen mass using data from this paper, Cygnus-A from Wilman et al. (2000) and A478 from Jaffe et al. (2001). The luminosity is determined for the slit flux only so the overall normalisation of the correlation may vary for the more extended emission. There is an apparent correlation similar to that found in Edge (2001) for the luminosity of H. To confirm the validity of these luminosity-luminosity correlations we calculated the Spearmans rho statistic (as recommended by Feigelson & Berg 1983) using the ASURV package for both the 1-0 S(1) and H luminosities correlated against the molecular hydrogen mass estimated from CO. The correlation is significant for CO vs. 1-0 S(1) (=0.59, implying a probability of correlation of per cent). The result for CO vs. H is even more significant (=0.63, so P per cent). This result improves if Cygnus-A is removed from the analysis (=0.72). As pointed out by Feigelson & Berg (1983), flux-flux correlations are not as reliable at determining whether an underlying correlation is present particularly for samples where most detections are close to the detection limit (as is the case in this study). We did perform flux-flux correlations and get significant correlations for both optical and infrared line correlations but only if Perseus is included. The correlations presented in Figure 7 and Figure 9 of Edge (2001) are significant and are not an artifact.
It is interesting to note the relatively low fluxes of 1-0 S(1) and/or S(3) in the most radio luminous objects. The comparison with H shows the objects with powerful radio sources which have firm CO upper limits (e.g. Cygnus-A and RXJ0747-19) lie much further from the correlation between CO and optical line luminosity than for the luminosity of 1-0 S(1) as a result of the much higher ratios of H/1-0 S(1) found for these objects. Figure 7 demonstrates that the interelation between CO and the 1-0 S(1) line may be closer than that with ionized hydrogen but as yet the observational datasets are not large enough or accurate enough to confirm this.
As with the high ionization lines, the spectral resolution of our CGS4 data is not sufficient to obtain line widths for the H2 lines so we cannot draw a direct comparison between these two phases in velocity. The CO lines have widths between 150 and 500 km s-1 so higher resolution near-infrared spectroscopy would allow the line profiles to be compared to establish if cool and warm components of molecular hydrogen are bound in clouds with the same velocity structure.
Irrespective of the excitation mechanism (which are dealt with in more detail in Wilman et al. 2002), the results clearly demonstrate that in the central cluster galaxies within strong cooling flows we are observing clouds of dense molecular gas being warmed to produce ionized, atomic hydrogen (H, Pa), warm molecular hydrogen in the near-IR and cool molecular hydrogen via CO. The exact ratios of these three phases will undoubtedly vary with viewing angle, star-formation rate and strength of any nuclear source but our observations show that any deviations are not larger than an order of magnitude. Therefore the scaling apparent in Figure 7 holds in the majority of cases with the most deviant points offering the possibility to constrain the excitation mechanisms at work. Our relative sensitivities to these three phases mean that it is the H emission that is most easily detected and the CO the hardest. There is also a possibility that a fourth phase, neutral, atomic hydrogen visible through the 21cm line, should also be present as photo-dissociation region models predict a ‘skin’ of atomic hydrogen (Kaufman et al. 1999). This phase will be the most challenging to detect but would strongly support the view that all the ‘peculiar’ features of cooling flow central cluster galaxies stem from the presence of cold molecular clouds.

| cluster | H luminosity | 1-0 S(1) luminosity | molecular gas mass |
|---|---|---|---|
| from C99 (erg s-1) | (erg s-1) | from Edge (2001) | |
| A11 | (1) | 1.2 | 2.6 |
| A85 | – | – | |
| Zw235 | 4.1 | – | |
| A262 | 5.5 | 1.3 | 9.0 |
| RXJ0338+09 | 1.8 | 5.9 | 3.9 |
| NGC1275 | (5) | 4.2 | () |
| RXJ0352+19 | 5.9 | 6.9 | 1.2 |
| A478 | 1.1 | 4.6 | 4.5 |
| RXJ0439+05 | 1.1 | 9.2 | |
| RXJ0747-19 | (1.4) | 6.2 | |
| RXJ0821+07 | 3.0 | 1.5 | 3.9 |
| A646 | 2.6 | 1.6 | |
| 4C+55.16 | (1) | 2.3 | |
| A795 | 1.9 | – | |
| Hydra-A | (1.6) | 4.3 | |
| Zw3146 | 7.1 | 2.0 | 1.6 |
| A1068 | 1.7 | 2.2 | 8.5 |
| Zw3916 | 1.5 | ||
| A1664 | 1.1 | 5.9 | 4.4 |
| A1795 | 1.2 | 1.0 | |
| A1835 | 2.7 | 2.9 | |
| A1885 | 5.4 | – | |
| Zw7160 | 5.0 | ||
| A2029 | () | ||
| A2052 | 3.0 | () | |
| A2199 | 2.8 | () | |
| A2204 | 1.9 | 1.3 | |
| Hercules-A | – | 3.1 | – |
| Zw8193 | 1.5 | 1.1 | |
| Zw8197 | 2.1 | ||
| Zw8276 | 1.7 | 2.0 | |
| Cygnus-A | (6.5) | 5.8 | () |
| A2390 | 9.8 | 1.2 | |
| A2597 | (5.2) | 1.0 |
4.6 Comparison to starbursts and LINERS
The most comparable objects to the peculiar central cluster galaxies studied here are starbursts as they are both known to harbour young stars, cold molecular gas and dust. The infra-red spectroscopy of Ultraluminous Infra-red Galaxies by Murphy et al. (1999) shows much stronger Pa and Br and weaker H2 lines compared to this study. In addition the relatively strong [FeII] emission found in this study is not observed in starbursts. The excitation temperature of the H2 lines is similar to that found in this study and others (see Wilman et al. 2002) but the properties of these two classes of objects are significantly different in the near-infrared.
From the properties of the optical emission lines, central cluster galaxies share many properites with LINERs. Infra-red spectroscopy of LINERs by Larkin et al. (1998) finds strong molecular lines and a small fraction with high ionization lines so the resemblance follows into the infra-red as noted by Jaffe et al. (2001). This comparison also applies to the [FeII] strength as LINERs (unlike starbursts) strong in [FeII] and [OI] and weak in Br (Larkin et al. 1998). The question of whether the underlying excitation mechanism behind both classes of object is the same is an open one. The bulk of the literature on LINERs favours X-ray heating and/or shocks and this is discussed further in Wilman et al. (2002).
4.7 CO absorption lines
In a few of the lower redshift galaxies our spectra cover the CO stellar absorption bandhead at 2.3m. The strength of this feature should provide constraints of the relative mass distribution on the underlying population of stars in the galaxies. Using the definition of the CO equivalent width of James & Mobasher (2000), we calculate values of 3.57, 3.27, 3.96, 3.21, 3.33, 3.45 and 2.89nm, with errors of 0.30nm, for RXJ0338+096, Hydra-A, A85, A1795, A2029, A2052 and A2199 respectively (only the latter object is in the James & Mobasher (2000) sample at 3.230.25nm so consistent within the errors). The mean equivalent width of CO of our seven values is 3.38nm compared to 3.35nm for the brightest cluster galaxies in James & Mobasher (2000) so our results are consistent despite the redshift distribution and resolution of our spectra not being well suited to studying these lines.
4.8 Spectral slope at 2m
The K-band spectra obtained in ths study are dominated by the old stellar population. However, in the case of NGC1275 there is a strong contribution from the active nucleus which shows a significant upturn at 2m. This is in part due to the presence of hot dust (Krabbe et al. 2000). To test for any possible non-stellar contribution to our spectra we have determined the spectral slope from 1.9 to 2.1m (rest) for all spectra (excluding emission lines). The results are presented in Figure 8 plotted against redshift. Only one other system (A1068) appears to be significantly different from the overall distribution (mean of 2.59 and an rms of 0.30 excluding NGC1275, A1068 and all the objects which have weak continuum). Unlike NGC1275, A1068 does not show any broad emission lines but does show evidence for a strongly ionizing source ([OIII], [SiVI] and Br ) so this source may host a highly obscured, radio-quiet Seyfert nucleus. Therefore, while the contribution from non-stellar sources (nuclear continuum and hot (T K) dust) is small in the vast majority of our spectra, the spectral slope around 2m is a useful diagnostic to a possible nuclear contribution.

5 CONCLUSIONS
The study presented in this paper confirms that there is a remarkably good correspondance between the warm and cool molecular gas and ionized hydrogen in intensity for central galaxies in cooling flows. These components appear to be common to this class of objects and indicate that substantial masses of irradiated molecular gas lie in the centres of clusters. What is required now is to establish the spatial correspondance between the observed components to these systems through narrow-band imaging and intergral field spectroscopy.
In the companion paper (Wilman et al. 2002) we present an analysis of the likely excitation mechanisms for the molecular lines observed.
The ultimate question of whether the total mass of cold molecular clouds deposited by the cooling flow is comparable to that predicted from X-ray observations cannot be addressed until observations of the far-infrared lines that should be emitted by the coolest clouds as they themselves cool. These lines are within reach of SOFIA, SIRTF and FIRST so this issue may be resolved in the next 2–4 years.
ACKNOWLEDGEMENTS
UKIRT is operated by the Joint Astronomy Centre on behalf of the United Kingdom Particle Physics and Astronomy Research Council. RJW acknowledges support from the EU Marie Curie Fellowship Scheme, RJW and RMJ acknowledge support from PPARC, and ACE, CSC, ACF and SWA thank the Royal Society for support. The analysis in this paper uses the ASURV Rev 1.2 package (LaValley, Isobe & Feigelson 1992).
References
- [] Allen S.W., et al., 1992, MNRAS, 257, 67
- [] Allen S.W., Fabian A.C., Edge A.C., Bohringer H., White D.A, 1995, MNRAS, 275, 741
- [] Allen S.W., Ettori S., Fabian A.C., 2001, MNRAS, 324, 877
- [] Bayer-Kim C.M., Crawford C.S., Allen S.W., Edge A.C., Fabian A.C., 2002, in preparation
- [] Bridges, T.J., Irwin, J.A. 1998. MNRAS, 300, 967
- [] Cowie L.L., Binney J., 1977, ApJ, 215, 723
- [] Crawford C.S., Allen S.W., Ebeling H., Edge A.C., Fabian A.C., 1999, MNRAS, 306, 857
- [] Donahue M., Mack J., Voit G.M., Sparks W., Elston R., Maloney P.R., 2000, ApJ, 545, 670
- [] Edge A.C., 2001, MNRAS, 328, 762
- [] Fabian A.C., Nulsen P.E.J., 1977, MNRAS, 180, 479
- [] Fabian A.C., 1994, ARAA, 32, 277
- [] Falcke H., Rieke M.J., Rieke G.H., Simpson C., Wilson A.S., 1998, ApJ, 494, L155
- [] Feigelson E.D., Berg C.J., 1983, Ap J, 299,400
- [] Ferland G.J., Fabian A.C., Johnstone R.M., 1994, MNRAS, 266, 399
- [] Holtzman J.A. et al., 1992, AJ 103, 691
- [] Hu E.M., Cowie L.L., Kaaret P., Jenkins E.B., York D.G., Roesler F.L., 1983, ApJ 275, L27
- [] Iwasawa K., Allen S.W., Fabian A.C., Edge A.C., Ettori S., 1999, MNRAS 306, 467
- [] Jaffe W., Bremer M.N., 1997, MNRAS, 284, L1
- [] Jaffe W., Bremer M.N., van der Werf P.P., 2001, MNRAS, 324, 443
- [] James P.A., Mobasher B., 2000, MNRAS, 317, 259
- [] Kaufman M.J., Wolfire M.G., Hollenbach D.J., Luhman M.L. 1999, ApJ, 527, 795
- [] Kawara K.,Nishida M., Taniguchi Y. 1988, ApJ 328, L41
- [] Krabbe A., Sams B.J., Genzel R., Thatte N., Prada F., 2000, A&A, 354, 439
- [] Larkin J.E., Armus L., Knop R.A., Soifer B.T., Matthews K., 1999, ApJS, 114, 59
- [] LaValley M., Isobe T., Feigelson E., 1992, In “Astronomical Data Analysis Software and Systems I”, A.S.P. Conference Series, ed. D.M. Worrall, C. Biemesderfer & J. Barnes, Vol. 25, p. 245.
- [] McNamara B.R., et al., 2000, ApJ, 534, L135
- [] Mouri H., Nishida, M., Taniguchi, Y. 1990, ApJ, 360, 55
- [] Mouri H., Kawara K., Taniguchi Y. 2000, ApJ, 528, 186
- [] Murphy T.W., Soifer B.T., Matthews K., Kiger J.R., Armus, L., 1999, ApJ, 525, L85
- [] Norgarrd-Nielsen H.U., Goudfrooij P., Jorgensen H.E., Hansen L., 1993, A&A 279, 61
- [] Osterbrock D.E., 1989, “Astrophysics of gaseous nebulae and active galactic nuclei”, University Science Books, Mill Valley, Ca
- [] Pedlar A., Ghataure H.S., Davies R.D., Harrison B.A., Perley R., Crane P.C., Unger S.W., 1990, MNRAS 246, 477
- [] Perlman E.S., Padovani P., Giommi P., Sambruna R., Jones L.R., Tzioumis A., Reynolds J. 1998, AJ 115, 1253
- [] Peterson B.M., et al., 2001, A&A, 365, L104
- [] Schmidt R., Allen S.W., Fabian A.C., 2001, MNRAS, 327, 1057
- [] Simpson C., Forbes D.A., Baker A.C., Ward M.J., 1996, MNRAS, 283, 777
- [] Van den Bergh S., 1977, AN 298, 285
- [] Wilman R.J., Edge A.C., Johnstone R.M., Crawford C.S., Fabian A.C., 2000, MNRAS, 318, 1232
- [] Wilman R.J., Edge A.C., Fabian A.C., Allen S.W., Johnstone R.M., Crawford C.S., 2002, to appear in MNRAS