A Chandra High-Resolution Camera Observation of X-Ray Point Sources in M31
Abstract
We present results from a 47 ks observation of the Andromeda galaxy, M31, using the High-Resolution Camera of the Chandra X-Ray Observatory. We detect 142 point sources spanning three orders of magnitude in luminosity, from to in the 0.1-10 keV band. The X-ray source location accuracy is better than in the central regions of the galaxy. One source lies within of SN 1885 but does not coincide with the UV absorption feature identified as the supernova remnant. However, there is an optical transient, which is likely an optical nova, at the location of the X-ray source. There is a weak source, , coincident with the nucleus of M31, and 14 sources coincident with globular clusters.
Our observation has very high efficiency down to luminosities of for sources within of the nucleus. Comparing with a ROSAT observation made 11 years earlier, we find that of the sources with are variable. We find no evidence for X-ray pulsars in this region, indicating that the population is likely dominated by low-mass X-ray binaries. The source density radial profile follows a powerlaw distribution with an exponent of and is inconsistent with the optical surface brightness profile. The x-ray point source luminosity function is well fitted by a differential broken powerlaw with a break at a luminosity of . The luminosity function is consistent with a model of an aging population of X-ray binaries.
1 Introduction
Study of X-ray sources in external galaxies is important for understanding the formation history and population statistics of X-ray binaries and other X-ray sources both in external galaxies and in our own. Such studies will help us understand the evolutionary history of X-ray binaries, should provide information on the star formation history (e.g. White & Ghosh 1998), and may be important in estimating the rate of merging objects (e.g. Bethe & Brown 1999) critical for determining the rate of gravitational wave events.
The nearby, bright spiral galaxy M31 offers an excellent site for such studies. The distance of the galaxy is well known, making luminosity estimation from flux measurement straight forward, the galaxy is sufficiently inclined so that sources can be reliably located within its morphology, and it is relatively nearby (780 kpc) so that many sources can be detected. The sub-arcsecond resolution of the Chandra X-ray Observatory (CXO; Weisskopf 1988) permits individual X-ray sources to be discerned even in crowded regions of the galaxy and enables measurement of highly accurate positions. Such position information is critical in finding unique optical and radio counterparts to the sources.
Here, we report on a deep observation of the core of M31 made with the Chandra High Resolution Camera (HRC; Murray et al. 1997). The HRC offers the best spatial resolution available for the X-ray study of M31. We describe the observation and our analysis in §2. We discuss the variability in §3 and source identifications including a source very near, but not coincident with SN 1885, in §4. We consider the spatial and luminosity distributions of the population of X-ray point sources in §5 and describe a model which relates the luminosity distribution to the age of the X-ray binary population. Finally, we conclude in §6 with comments on the implications of our results for understanding the formation history of X-ray binaries.
2 Observation and Source List
M31 was observed with the Chandra X-Ray Observatory (CXO; Weisskopf 1988) using the High Resolution Camera (HRC; Murray et al. 1997) in imaging mode and the High-Resolution Mirror Assembly (HRMA; van Speybroeck et al. 1997) for 46777 s of useful exposure time beginning at 23:49:20 UTC on 2001-Oct-31 (ObsID 1912). The data were reprocessed using the Chandra geometry file released on 2001-Oct-22 (telD1999-07-23geomN0004.fits) and then standard event processing and filtering procedures, from the Chandra Interactive Analysis of Observations software package (CIAO) v2.2.1, were applied to produce a level-2 event list. A light curve from the full detector was constructed to search for times of high background. The count rate appears uniform through out the observation.
Sources were extracted from three images which were produced from the level-2 event list. The first covered the central region with a resolution equal to the HRC electronic pixels (). The second covered the central region with a resolution of 2 HRC pixels. The third image covered the full HRC field of view with a resolution of 4 HRC pixels. The Chandra point spread function (PSF) degrades off axis. Use of three nested images allowed us to adequately sample the Chandra PSF at each off-axis angle without requiring processing of excessively large images.
We constructed a source list for each image using wavdetect (Freeman et al., 2002), the wavelet-based source detection routine in CIAO. We merged the three source lists. We removed duplicates and extracted the position and region parameters for each source with a detection significance above from the highest resolution image in which it appeared. The source regions are ellipses with radii equal to 3 times the 50% encircled energy radii calculated by wavdetect from the events detected for each source. The merged source regions were visually inspected. We manually reduced the sizes of overlapping source regions to reduce the overlap. This was important for the three sources near the nucleus of M31 and two pairs of sources: CXOM31 J004302.9+411522 with CXOM31 J004303.2+411528, and CXOM31 J004255.3+412558 with CXOM31 J004253.4+412549. The fluxes quoted for these sources may be slightly underestimated.
We extracted counts for each source region. We estimated the background for each source using a circular region with a radius 3 times the major axis of the source ellipse and excluding regions twice the size (both major and minor axes doubled) of the source regions. The exposure was calculated for an average photon energy of 1 keV. Relative to the value on-axis, the exposure decreases by 10% at off-axis, by 30% at off-axis, and by 42% at the source furthest off-axis. We translated the count rates to photon fluxes using the exposure, then to energy fluxes in the 0.1-10 keV band assuming an absorbed thermal bremsstrahlung spectrum with a temperature of 2 keV and a column density equal to the Galactic column towards M31 of , and finally to equivalent luminosities at a distance of 780 kpc (Stanek & Garnavich, 1998). The conversion to luminosity is uncertain due to the lack of spectral information, e.g. use of a temperature of 5 keV would increase the luminosities by a factor of 1.5, while use of 1 keV would decrease them by 0.7, and use of a powerlaw spectrum with a photon index of 2 would increase them by 1.2. For comparison with Trincheri and Fabbiano (1991) and Primini et al. (1993), who quoted luminosities in the 0.2-4 keV band for a thermal bremsstrahlung spectrum with a temperature of 5 keV and a distance of 690 kpc, our values should be multiplied by 0.76.
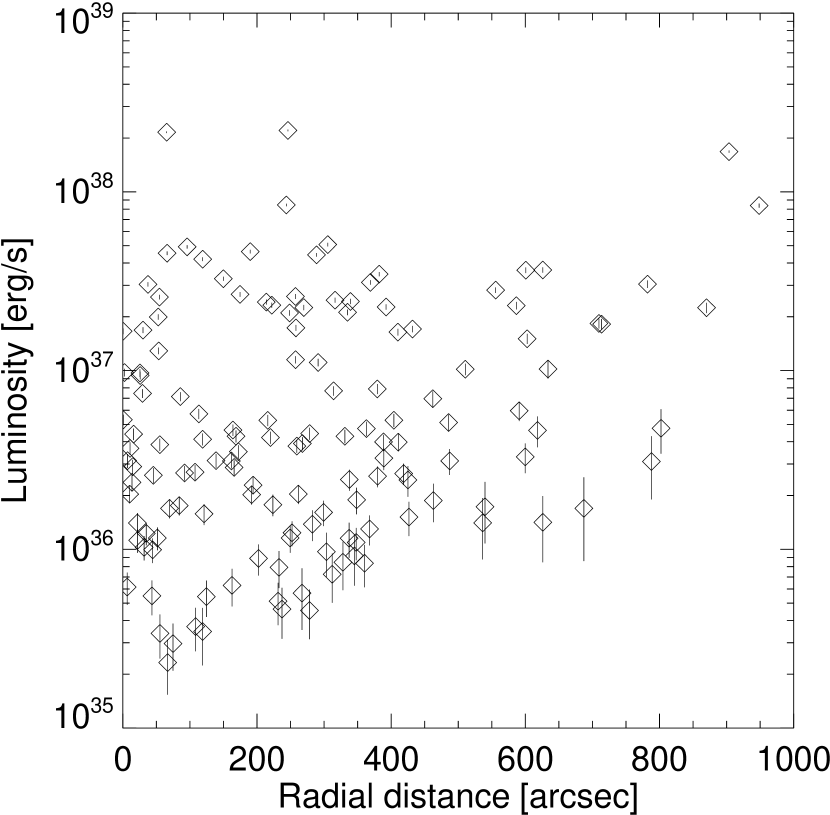
Table 1 includes sources with estimated luminosities as low as . However, the detection threshold is not uniform across the HRC field of view. The degradation of the HRMA point spread function far off-axis causes the photons from sources far off-axis to be spread over a large physical area on the detector. This increases the background within the source region and worsens the detection sensitivity. Fig. 2 shows the source luminosity as a function of angular distance from the Chandra aimpoint. We note that the spatially varying diffuse emission near the nucleus could also be of concern for the detection threshold. However, the diffuse emission is strong only in the central parts of the galaxy where the point spread function is narrow and, hence, adds relatively few photons within the source regions. Sources with luminosities above are efficiently detected out to a distance of from the aimpoint. The detection threshold rises to slightly below at from the aimpoint, and rapidly becomes worse at larger radii.
To check the astrometry of the Chandra observation, we compared the Chandra source positions to the 2mass infrared point source catalog (Cutri et al., 2000). We selected the 2mass catalog because it contains more point sources near the central regions of M31 than do optical astrometry catalogs, such as USNO or Tycho, and because it has good absolute astrometry with an accuracy of (Cutri et al., 2000). Within of the Chandra aimpoint, where the point spread function is narrow and the source positions are well defined, we find 6 coincidences within excluding sources within of the nucleus. There are 107 Chandra sources and 110 2mass sources in this same region. The expected number of chance coincidences within is 0.02. Therefore it is unlikely that more than one of the 6 coincidences is due to chance. We calculated the average coordinate shift for the 6 sources and used this to correct the Chandra position. The magnitude of the shift was . The positions in Table 1 include this correction. After the shift, all 6 sources are coincident within with an average magnitude of displacement of .
3 Variability
We searched for variability on long time scales ( years) by comparing the Chandra fluxes with fluxes measured in a ROSAT observation made during 1990 (Primini et al., 1993) and on short times scales () by looking at light curves extracted from our Chandra data. We also searched for periodic signals.

3.1 Long Time Scales
Primini et al. (1993) derived a source list from a ROSAT High-Resolution Imager (HRI) observation of the central region of M31 made on 25-28 July 1990. Because the sensitivity and point spread function of both ROSAT and Chandra decrease as one goes off-axis, we restricted our comparison to sources with of the nucleus of M31 (which was close to the aimpoint for both observations). Comparing the source lists, we searched for matches and found an average offset of in RA and in DEC. After adding these offsets to the ROSAT positions, we found 53 coincidences within . To compare with our Chandra results, we multiplied the ROSAT luminosities luminosities by a factor of 1.31 to correct for the different distance, spectral model, and spectral range assumed. To allow for calibration errors and uncertainties induced by the lack of spectral information in either observation, we assign a systematic error of 20% on each luminosity.
Fig. 3 shows a comparison of the ROSAT and Chandra source luminosities. There are many more Chandra sources below a luminosity of which lack a counterpart than there are ROSAT sources. This likely indicates incompleteness in the ROSAT sample at low luminosities, and we restrict our comparison to sources which appeared above this luminosity in at least one of the observations. We consider a source to be “constant” if the luminosity varies by less than a factor of 1.6 between the two observations. This is a reasonably conservative criterion.
We find 55 distinct sources in the two observations. Of these, 29 have constant luminosity (within a factor of 1.6) between the two observations. Hence, the fraction of sources which are variable is . This number is relatively insensitive to changes in the criteria, e.g. changing the threshold for luminosity variations from 1.6 to 2.0 changes the variable fraction to which is consistent within the errors. Considering only sources with of the nucleus and taking a luminosity variation threshold of 1.6 gives a variable fraction of . The fraction of sources found here to be variable on time scales of years is similar to the number found to be variable on time scales less than 2 years by Kong et al. (2002).

3.2 Short Time Scales
We searched for variability within the Chandra observation by extracting the photon arrival times for each source and then comparing them to the distribution expected for a constant source with the same average flux using a KS test. No background subtraction was performed. Three sources were found to be variable at a confidence level above 99.9%. Their light curves are shown in Fig. 4. These three sources were also found to be variable on time scales of months to years by Kong et al. (2002). CXOM31 J004222.9+411535 shows an irregular decline over the observation. CXOM31 J004318.9+412016 shows an increase in flux by 50% over a time scale of 10 ks. Such behaviors are common to X-ray binaries.
CXOM31 J004252.5+411854 shows a flare with a duration of , a peak flux of , and a fluence (total energy including persistent emission) of within the first 2000 s. The duration of the flare and the fluence may be substantially larger if the high flux points following the flare are interpreted as part of the flare, i.e. the duration may be as long as 10 ks and the fluence as large as . The flare properties are similar to those of the recently discovered “superbursts” (Cornelisse et al., 2000) which may be due to unstable burning of 12C near the neutron star surface (Cumming & Bildsten, 2001). Also, the average luminosity of the source is within the luminosity range, 0.1–0.3 of the Eddington luminosity for a neutron star, of the known superburst sources (Wijnands, 2001). If identification of the observed flare as a superburst is correct, then CXOM31 J004252.5+411854 would be identified as a neutron-star low-mass X-ray binary.
3.3 Pulsations
We conducted an accelerated search for periodic signals with periods in the range 0.25–5000 s and allowing acceleration sufficient to cover orbital periods down to 6 days for companion star masses up to (Wood et al., 1991). The search range would permit detection of pulsations from any of the known Be/X-ray binaries, except for A0538-66. Taking into account the large number of trials, we found no signal significant at above the 99% confidence level. We note that XMMU J004319.4+411759 found by Osborne et al. (2001) to exhibit 865 s pulsations was not detected (even as unpulsed source) in our observation.
Given the number of trials over accelerations, 143, and over frequencies, , we can place a 99% confidence upper bound on the pulsed fraction for sinusoidal pulsations from each source of , where is the number of photon detected from the source (Buccheri, Ozel, & Sacco, 1987). Concentrating on the sources within of the nucleus, we find 13 sources with more than 1000 counts for which the pulsed fraction upper bound is and 22 sources with more than 500 counts for which the upper bound is .
These upper bounds are below the pulsed fractions of many known Be/X-ray binaries suggesting that the core of M31 is home to few, if any, high-mass X-ray binaries. Combined with the high fraction of sources which are variable, this leads to the conclusion that the X-ray point source population of the core of M31 is dominated by low-mass X-ray binaries (LMXBs) as previously suggested by other authors (e.g. van Speybroeck et al. 1979).
4 Source Identifications
We searched for optical and infrared counterparts to the Chandra sources. In this section, we discuss some of the counterparts found.
4.1 Globular clusters and infrared sources
Globular clusters are well known to contain X-ray sources, in both our galaxy (Clark, 1975) and M31 (e.g. di Stefano et al. 2001), so we searched for coincidences between M31 globular clusters (Battistini et al., 1980; Magnier, 1993; Barmby, 2001) and our Chandra sources. Infrared emission is common from globular clusters, so we also included sources from the 2mass catalog (Cutri et al., 2000) as a check on the astrometry of the globular cluster catalogs. We list coincidences within of Chandra HRC sources with 2mass sources or globular clusters in Table 2. In the cases where a particular globular cluster appeared in more than one catalog, we list the entry from the catalog of Barmby (2001) where available and Magnier (1993) otherwise. The cluster position is taken from catalog containing the closest coincidence. We exclude the nucleus from the list of 2mass sources as it is discussed in a later section.
We consider there to be strong evidence for an association of an X-ray source with a globular cluster when the positions coincide within . There are 14 such coincidences. We expect only 0.4 chance coincidences within . Of these 14 sources, 8 have 2mass counterparts within and the average radial offset between the 2mass and Chandra sources is .
Several of the remaining coincidences may be due to chance. We expect 3.3 chance coincidences with separations between and compared with 6 coincidences found. However, some of the coincidences may represent true associations with the displacement overestimated due to errors in the cluster or X-ray position. The latter is particularly relevant for CXOM31 J004215.9+410115, CXOM31 J004301.2+413017, and CXOM31 J004337.1+411443 which lie more than from the Chandra aimpoint. Follow-up observations centered on their locations would be useful to confirm or deny the associations.
Only two of the X-ray sources with 2mass counterparts lack globular cluster counterparts. These two infrared sources are slightly dimmer, but have colors consistent with those of the 2mass sources with globular cluster and X-ray counterparts. CXOM31 J004221.5+411419 lies within of a globular cluster candidate (S5 15) identified by Wirth, Smarr, & Bruno (1985). It is likely the same object as the X-ray source 2E 0039.6+4057 seen with Einstein. CXOM31 J004210.2+411510 is likely the same source identified as #6 by Primini et al. (1993) and as CXOM31 J004210.1+411509 by Kong et al. (2002). We are aware of no globular cluster, or other, counterpart to the source.
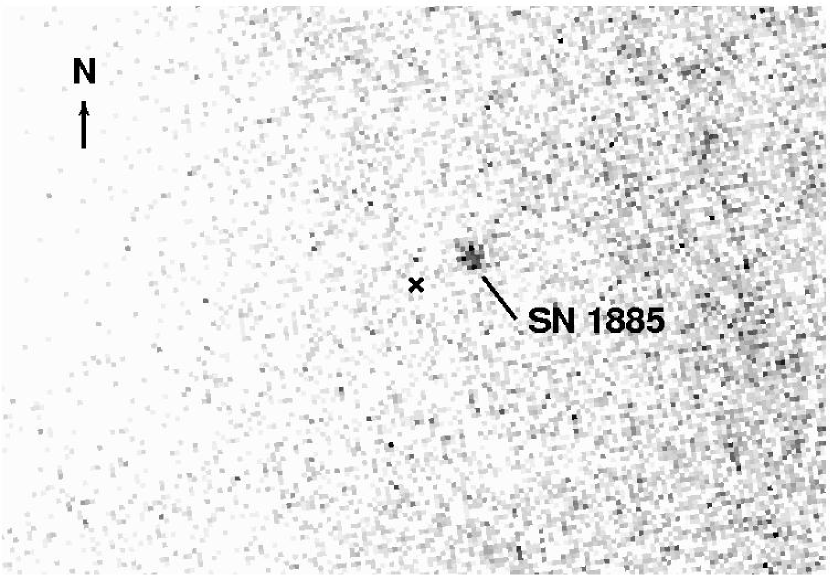
4.2 Source near SN 1885
The X-ray source CXOM31 J004243.1+411604 lies close to the position of the historical supernova SN 1885 (Barnard, 1898; de Vaucouleurs & Corwin, 1985). No X-ray source has been previously reported at this position, even in observations made with Chandra as late as 10 June 2001 (Kong et al., 2002), only 143 days before our observation. Fesen et al. (1999) found a near-UV absorption disk in a Hubble Space Telescope (HST) image of the central region of M31. To determine whether the Chandra source is the counterpart of SN 1885, we extracted the WFPC2 data of Fesen et al. (1999) from the HST archive and repeated the processing described in their paper to obtain a median filtered image at , similar to that shown in Fig. 1 of their paper. The absolute astrometry of HST is limited by the accuracy of the guide star positions which have a typical uncertainty of rms ( at 90% confidence). The accuracy of relative astrometry is much better.
A bright UV source is present about SW of the nucleus and lies near the Chandra source CXOM31 J004241.3+411524; both sources are coincident with the globular cluster identified as MIT 213 (Magnier, 1993). Assuming that the UV source is, indeed, the counterpart of the Chandra source allows us to align the UV and X-ray images. Fig. 5 shows the UV image with the position of CXOM31 J004243.1+411604 superimposed. The Chandra source lies from the center of the UV absorption disk, indicating that CXOM31 J004243.1+411604 is not the counterpart of SN 1885. The angular displacement at the distance of M31 corresponds to a (projected) physical displacement of 4.9 pc. A velocity close to 40,000 km/s would be required for an object to move such a distance between 1885 and 2001. This is much higher than the velocity of any known pulsar. Hence, interpretation of the Chandra source as a neutron star ejected from the SN 1885 is excluded.
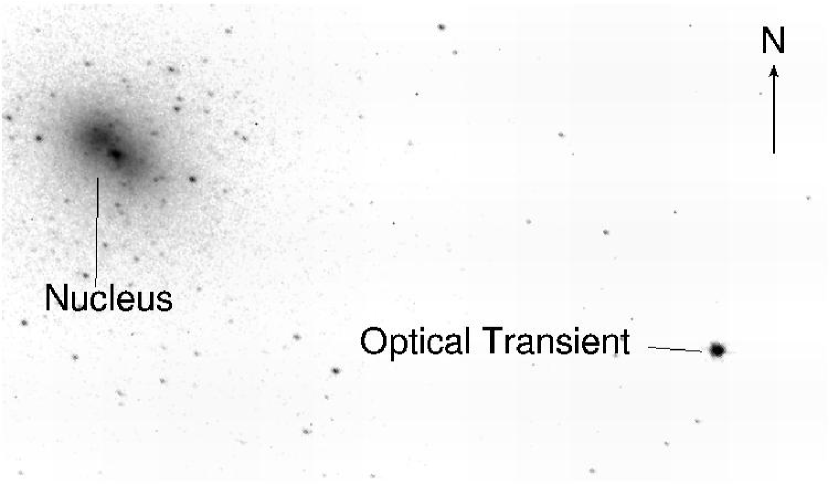
We examined other HST images of M31 and found an optical transient source at the position of CXOM31 J004243.1+411604 in a WFPC2 image (HST data set U2LG020, originally taken by Lauer et al. (1993) to study the nucleus of M31). Fig. 6 shows an image obtained with the F300W filter on 19 June 1995 including the region around SN 1885. We aligned this image with the X-ray image by registering it with other HST images (Garcia et al., 2001) including the bright UV/optical source identified with CXOM31 J004241.3+411524 above. A bright point source is apparent which is coincident with CXOM31 J004243.1+411604 within . This is compatible with the accuracy expected from our alignment procedure. Discovery of this optical counterpart strengths our belief that identification of the bright UV source and CXOM31 J004241.3+411524 is correct (even though the X-ray position is from the cataloged globular cluster position) and that the Chandra source is not the counterpart of SN 1885. The HST source is the brightest object other than the nucleus in the HST image. Using the standard HST calibrations, we estimate the flux is , equivalent to an ST magnitude of 17.5. The brightness is comparable to that of optical novae detected in M31 (Arp, 1956; Shafter & Irby, 2001) and we suggest that the transient is most likely an optical nova.
Some novae have been detected as supersoft X-ray sources which turn on within a few years after the nova outburst Kahabka & van den Huevel (1997). Such sources have very soft spectra, typically blackbody spectra with temperatures of 20–80 eV. A blackbody spectrum with a temperature of 80 eV would imply an unabsorbed luminosity of in the 0.1-10 keV band for HRC count rate of CXOM31 J004243.1+411604. Lower temperatures would require higher unabsorbed luminosities to produce the same observed count rate. This luminosity would be consistent with the properties of the known supersoft sources associated with novae outbursts (Orio, Covington, & Ogelman, 2001). Spectral observations of CXOM31 J004243.1+411604 would be of great interest to determine if it is, indeed, a super soft source.
4.3 Sources near the nucleus
Three Chandra/HRC sources lie within of the nucleus of M31. Of these, only CXOM31 J004244.3+411608 overlaps the bright optical nucleus apparent in HST images of the core of M31 (Garcia et al., 2001). This source is well detected with 152 net counts, but is relatively dim with a flux of . The corresponding luminosity is in the 0.1–10 keV band assuming a thermal bremsstrahlung spectrum with a temperature ; the true luminosity may be somewhat different if the true spectrum has a different form (e.g. a powerlaw spectrum with photon index of 2 would give a luminosity of ). This luminosity is a factor of higher than that measured for Sgr A* (Baganoff et al., 2001). Because of the high density of Chandra sources near the nucleus, we cannot exclude the possibility that the X-ray emission does not arise from the nucleus of M31. Hence, the X-ray emission from CXOM31 J004244.3+411608 should be taken as an upper bound on the emission from the nucleus of M31.
5 Group properties
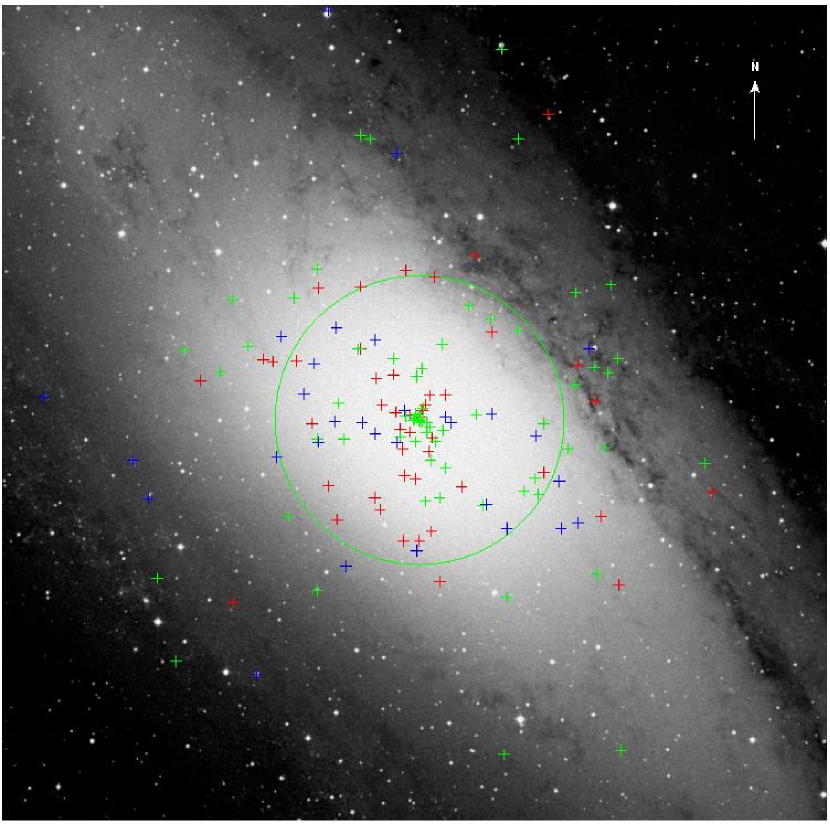
Here, we consider the group properties of the X-ray point sources in the core of M31. We concentrate our analysis on sources within a radius of the nucleus and with luminosities above , corresponding to 63 net counts near the aimpoint. Our detection efficiency is very high given these limits. Hence, our sample should be essentially complete. The sample also corresponds to a well-defined physical area covering the bulge of M31 within 230 pc of the nucleus, assuming a distance of 780 kpc.


5.1 Spatial Distribution of Sources
The azimuthal distribution of the X-ray point sources within a radius of the nucleus and with luminosities above is shown in Fig. 7. A fit of an ellipsoidal distribution gives a position angle measured from north to east and an ellipticity . Kent (1983, 1987) measured the distribution of optical surface brightness for M31. He found that the position angle is near within of the nucleus, shifts to a value as low as at a radius of of , and then returns to at . The ellipticity is also non-monotonic being relatively high, at small radii, decreasing to at intermediate radii near , and then increasing to at . The limited number of X-ray point source do not permit study of the azimuthal distribution as a function of radius, but the general properties are similar to the optical distribution. The X-ray distribution is aligned, within errors and the variations in the optical distribution, with the optical distribution and has a similar ellipticity. This suggests that the X-ray and optical distributions are physically related.
Fig. 8 shows the cumulative radial distribution of the same set of X-ray point sources. The X-ray point source distribution differs significantly from the optical surface brightness profile; there are many more X-ray sources near to the nucleus than would be expected from scaling to the optical profile matched to the X-ray profile at large radii. To constrain the shape of the distribution, we fit the data to a powerlaw form, a King model, and a de Vaucoulers profile. The fitting was done using an unbinned maximum entropy method (Cash, 1979). As is apparent in the figure, the powerlaw form provides a fully adequate fit, while the King model and the de Vaucoulers profile significantly underestimate the number of sources at small radii. The best fit powerlaw exponent is .

5.2 X-ray luminosity distribution
The cumulative X-ray point source luminosity function (XLF) for sources with luminosities above and within a radius of the nucleus are shown in Figure 9. The XLF shows a distinct break near as has been reported in previous studies of the X-ray population of the core of M31 (Primini et al., 1993; Shirey et al., 2001). The sample used to construct this XLF has high and uniform sensitivity which minimizes problems arising from incompleteness or non-uniformity, while still extending to luminosities an order of magnitude below the break.
To compare with previous results, we fit the XLF with two powerlaw functions: one for the range luminosity range and one for . Using a minimum entropy fitting procedure appropriate for our situation of high detection efficiency (Crawford et al., 1970) and fitting the unbinned luminosity data, we find slopes for the cumulative distributions of for the higher luminosity range and for the lower luminosity range. The fit is shown as the long-dashed curve in Fig. 9. The slopes we obtain are consistent with the results of Primini et al. (1993), Shirey et al. (2001), and Kong et al. (2002).
We next fit the XLF using a broken powerlaw for the differential luminosity function. We note that the cumulative distribution corresponding to the differential broken powerlaw has curvature below its break luminosity and is not the same form as a cumulative broken powerlaw. The break luminosity for the differential broken powerlaw lies above the luminosity where the eye would locate the break in the cumulative XLF. This distinction must be noted when comparing break luminosities derived from cumulative, e.g. Shirey et al. (2001), versus differential broken powerlaws, e.g. Sarazin et al. (2000). We used an unbinned maximum entropy technique (Cash, 1979) and found that the best fit break luminosity is . Roughly a factor of 2 higher than the break luminosity quoted for the cumulative distribution above. For comparison, we fit the luminosity data from Shirey et al. (2001) with a differential broken powerlaw (the data were kindly provided by R. Shirey and R. Soria) and find a break luminosity of in good agreement with the break luminosity derived from our Chandra data and roughly a factor of two higher than the break luminosity of derived from their visual inspection of their cumulative luminosity distribution.
The best fit index for the differential powerlaw below the break luminosity is while that above is . The corresponding cumulative powerlaw slopes would be one less. These values are in reasonable agreement with the fits to the cumulative luminosity distribution. The slope of the differential low luminosity powerlaw is somewhat flatter than that of the cumulative low luminosity powerlaw due to the curvature noted above.
Finally, we fit the XLF with a simple model in which all of the x-ray sources are members of a single population with uniform properties except for luminosity and lifetime (Kilgard et al., 2002). Our sample is confined to the bulge of M31. It is, most likely, predominately a uniform population of low-mass X-ray binaries from the bulge of M31, with minor contamination from other classes of sources. In the modeling, we assume that X-ray binaries are born with a birth luminosity distribution given as a powerlaw, at a rate which has been constant in time over an interval . For simplicity, we assume that each source has a constant luminosity through its lifetime which is , where is the efficiency for conversion of accreted matter to radiation, is the average mass of the companion stars, and is the duty cycle of emission (King et al., 2001).
If we assume that , , and are independent of luminosity, then the differential luminosity distribution is described by a broken powerlaw with the index for the high luminosity powerlaw being steeper than that of the low luminosity powerlaw by one (Kilgard et al., 2002). The break luminosity is related to the model parameters as . The break luminosity is then an indicator of the age of the X-ray binary population. We note that the difference between the upper and lower powerlaw indexes for both the differential broken powerlaw fit are consistent with 1.0 within errors. Fitting with a differential broken powerlaw in which the difference between the two indexes is fixed to 1.0, shown as the solid line in Fig. 9, we find a fit which is as good as the general broken powerlaw fit given above. The best fit break luminosity is and the best fit slope for the differential low luminosity powerlaw is .
The difference between the upper and lower powerlaw indexes is one only when , , and are independent of the source luminosity and there is no evolution of luminosity over the life of an individual source. More generally, we can relate the break luminosity to the source age as . In this case the difference between the powerlaw indexes will be and the break luminosity will vary with the population age as . From our fitting results using the differential powerlaw in which both the upper and lower indexes are free, we can constrain .
6 Conclusions
Previous X-ray studies of M31 with pre-Chandra instruments indicated a good correspondence between the X-ray and optical profiles (Trincheri and Fabbiano, 1991). However, the good correspondence does not continue to the small radii accessible with Chandra. Instead, we find a powerlaw profile with an exponent of . Powerlaw profiles with exponents near 1 are well known indicators of core collapse in globular clusters (Djorgovski & King, 1975). The same should be true for other stellar clusters such as the bulge of M31 (Quinlan, 1996). If the X-ray sources are predominately LMXBs which were formed in globular clusters (White, Sarazin, & Kulkarni, 2002), then the distribution may be a remnant of the inward migration and disruption of globular clusters (Tremaine, Ostriker, & Spitzer, 1975).
The X-ray point source luminosity function (XLF) of the core of M31 shows a distinct break near . A break near this luminosity has been reported previously for M31 (Primini et al., 1993; Shirey et al., 2001), although our analysis shows that the break luminosity found from fitting a broken powerlaw to the differential distribution is roughly a factor of two higher than that found from fitting to the cumulative distribution.
In the context of the model presented above (Kilgard et al., 2002), the break luminosity is related to the age of the X-ray point source population. Specifically, the X-ray population age . For accreting neutron stars in low-mass X-ray binaries, the efficiency and the average companion mass . Good observational constraints on the duty cycle of emission are not available. The duty cycles inferred for LMXBs in our Galaxy range from 1.0 to less than 0.01 (Wijnands et al., 2001). It has also been suggested, based on binary evolution models, that a population of LXMBs with low duty cycles is present in elliptical galaxies (Piro & Bildsten, 2002). The stellar population near the nucleus of M31 is one of the reddest known, leading to age estimates of 10 Gyr or older (Rich & Mighell, 1995). If the X-ray population is of the same age, then and we would estimate . If the duty cycle were larger then the compact objects would accrete a total mass exceeding the companion mass in less than 10 Gyr.
7 Acknowledgments
I thank Michael Garcia for providing the HST mosaic image, Pauline Barmby for processing the HST optical transient image, Frank Primini for providing the ROSAT source list, all three of them and Dong-Woo Kim, Albert Kong, Andrea Prestwich, Andreas Zezas, and Rick Harnden for valuable discussions, Robert Shirey and Roberto Soria for providing their XMM luminosity data, and the CXC team for their superb operation of Chandra. PK acknowledges partial support from NASA grant NAG5-7405 and Chandra grant number G01-2034X. This publication makes use of data products from the Two Micron All Sky Survey, which is a joint project of the University of Massachusetts and the Infrared Processing and Analysis Center/California Institute of Technology, funded by the National Aeronautics and Space Administration and the National Science Foundation.
References
- Arp (1956) Arp, H.C. 1956, AJ, 61, 15
- Baganoff et al. (2001) Baganoff et al. 2001, 2001, Nature, 413, 45
- Barmby (2001) Barmby, P. 2001, Ph.D. thesis, Harvard University
- Barmby (2000) Barmby, P. & Huchra, J.P. 2000, ApJ, 531, L29
- Barnard (1898) Barnard, E.E. 1898, ApJ, 8, 226
- Battistini et al. (1980) Battistini, P., Bonoli, F., Braccesi, A., Fusi Pecci ,F., Malagnini, M.L., & Marano, B. 1980, A&AS, 42, 357
- Blanton et al. (2001) Blanton, E.L., Sarazin, C.L., & Irwin, J.A. 2001, ApJ, 552, 106
- Buccheri, Ozel, & Sacco (1987) Buccheri, R., Ozel, M.E., & Sacco, B. 1987, A&A, 175, 353
- Cash (1979) Cash, W. 1979, ApJ, 228, 939
- Clark (1975) Clark, G.W. 1975, ApJ, 199, L143
- Cole et al. (1994) Cole, S., Aragon-Salamanca, A., Frenk, C.S., Navarro, J.F., & Zepf, S.E. 1994, MNRAS, 271, 781
- Cornelisse et al. (2000) Cornelisse, R., Heise, J., Kuulkers, E., Verbunt, F., & in’t Zand, J.J.M. 2000, A&A, 357, L21
- Crawford et al. (1970) Crawford, D.F., Jauncey, D.L., & Murdoch, H.S. 1970, ApJ, 162, 405
- Cumming & Bildsten (2001) Cumming , A. & Bildsten, L. 2001, ApJ, 559, L127
- Cutri et al. (2000) Cutri, R.M. et al. 2000, “Explanatory Supplement to the 2MASS Second Incremental Data Release”, http://www.ipac.caltech.edu/2mass
- de Vaucouleurs & Corwin (1985) de Vaucouleurs, G. & Corwin, H.G., Jr. 1985, ApJ, 295, 287
- Djorgovski & King (1975) Djorgovski, S. & King, I.R. 1986, ApJ, 305, L61
- Fabbiano (1989) Fabbiano, G. 1989, ARA&A, 27, 87
- Finoguenov (2002) Finoguenov, A. & Jones, C. 2002, ApJ, to appear, astro-ph/0204046
- Fesen et al. (1999) Fesen, R.A., Gerardy, C.L., McLin, K.M., & Hamilton, A.J.S. 1999, ApJ, 514, 195
- Freeman et al. (2002) Freeman, P.E., Kashyap, V., Rosner, R., & Lamb, D.Q. 2002, ApJS, in press
- Garcia et al. (2000) Garcia, M.R., Murray, S.S., Primini, F.A., Forman, W.R., McClintock, J.E., & Jones, C. 2000, ApJ, 537, 23
- Garcia et al. (2001) Garcia, M.R., Kong, A., Primini, F.A., Barmby, P., DiStefano, R., McClintock, J.E., Murray, S.S. 2001, in ‘Two Years of Science with Chandra’, Abstracts from the Symposium held in Washington, DC, 5-7 September, 2001
- Giacconi et al. (2001) Giacconi, R., Rosati, P., Tozzi, P., Nonino, M., Hasinger, G., Norman, C., Bergeron, J., Borgani, S., Gilli, R., Gilmozzi, R., & Zheng, W. 2001, ApJ, 551 624
- Irwin et al. (2001) Irwin, J.A., Sarazin, C.L., & Bregman, J.N. 2001, ApJ, submitted
- Kahabka & van den Huevel (1997) Kahabka, P. & van den Huevel, E.P.J. 1997, ARA&A, 35, 69
- Kennicutt (1998) Kennicutt, R.C. 1998, ARA&A, 36, 189
- Kent (1983) Kent, S.M. 1983, ApJ, 266, 562
- Kent (1987) Kent, S.M. 1987, AJ, 94, 306
- Kilgard et al. (2002) Kilgard, R. E., Kaaret, P., Krauss, M. I., Prestwich, A. H., Raley, M. T., Zezas, A. 2002, ApJ, to appear
- King et al. (2001) King, A.R., Davies, M.B., Ward, M.J., Fabbiano, G., & Elvis, M. 2001, ApJ, 552, 109
- Kong et al. (2002) Kong, A.K.H., Garcia, M.R., Primini, F.A., Murray, S.S., DiStefano, R., & McClintock, J.E. 2002, ApJ, to appear
- Lauer et al. (1993) Lauer, T.R. et al. 1993, AJ, 106, 1436
- Magnier (1993) Magnier, E.A. 1993, Ph.D. thesis, Massachusetts Inst. of Tech., Cambridge, MA
- Murray et al. (1997) Murray, S.S. et al. 1997, Proc. SPIE, 3114, 11
- Orio, Covington, & Ogelman (2001) Orio, M., Covington, J., & Ogelman, H. 2001, A&A, 373, 542
- Osborne et al. (2001) Osborne, J.P. et al. 2001, A&A, 378, 800
- Piro & Bildsten (2002) Piro, A.L. & Bildsten, L. 2002, ApJ, to appear, astro-ph/0204495
- Primini et al. (1993) Primini, F.A., Forman, W., and Jones, C. 1993, ApJ, 410, 615
- Quinlan (1996) Quinlan, G.D. 1996, New Astronomy, 1, 255
- Rich & Mighell (1995) Rich, R.M. & Mighell, K.J. 1995, ApJ, 439, 145
- Sarazin et al. (2000) Sarazin, C.L., Irwin, J.A., and Bregman, J.N. 2000, ApJ, 544, 101
- Shafter & Irby (2001) Shafter, A.W. & Irby, B.K. 2001, ApJ, 563, 749
- Shirey et al. (2001) Shirey, R. et al. 2001, A&A, 365, 195
- Stanek & Garnavich (1998) Stanek, K.Z. & Garnavich, P.M. 1998, ApJ, 503, L131
- Toomre & Toomre (1972) Toomre, A. & Toomre, J. 1972, ApJ, 178, 623
- Tremaine, Ostriker, & Spitzer (1975) Tremaine, S.D., Ostriker, J.P., & Spitzer, L. Jr. 1975, ApJ, 196, 407
- Trincheri and Fabbiano (1991) Trincheri, G. & Fabbiano, G. 1991, ApJ, 382, 82
- van Speybroeck et al. (1979) van Speybroeck, L.P., Epstein, A., Forman, W., Giacconi, R., Jones, C., Liller, W., Smarr, L. 1979, ApJ, 234, L45
- van Speybroeck et al. (1997) van Speybroeck, L.P. et al. 1997, Proc. SPIE, 3113, 89
- Weisskopf (1988) Weisskopf, M.C. 1988, Space Science Reviews, 47, 47
- White, Sarazin, & Kulkarni (2002) White, R.E. III, Sarazin, C.L., & Kulkarni, S.R. 2002, ApJ, to appear, aastro-ph/0204172
- Wijnands (2001) Wijnands, R. 2001, ApJ, 554, L59
- Wijnands et al. (2001) Wijnands, R. et al. 2001, ApJ, 560, L159
- Wirth, Smarr, & Bruno (1985) Wirth, A., Smarr, L.L., & Bruno, T.L. 1985, ApJ, 290, 140
- Wood et al. (1991) Wood, K.S. et al. 1991, ApJ, 379, 295
| RA | DEC | S/N | Counts | Flux | Luminosity |
|---|---|---|---|---|---|
| (J2000) | (J2000) | ||||
| 00 41 50.46 | +41 13 37.8 | 6.3 | 49.8 | 5.7 2.3 | 1.4 |
| 00 41 51.78 | +41 14 37.7 | 6.5 | 118.6 | 13.3 2.5 | 3.3 |
| 00 42 07.34 | +41 04 43.0 | 4.6 | 144.7 | 19.2 5.4 | 4.8 |
| 00 42 07.67 | +41 10 26.6 | 5.9 | 49.8 | 5.7 2.1 | 1.4 |
| 00 42 07.77 | +41 18 15.1 | 55.8 | 665.2 | 69.0 2.9 | 17.0 |
| 00 42 09.15 | +41 20 47.8 | 16.4 | 196.9 | 20.9 2.2 | 5.2 |
| 00 42 09.61 | +41 17 45.3 | 20.9 | 214.4 | 22.1 1.9 | 5.5 |
| 00 42 10.28 | +41 15 10.4 | 18.7 | 156.4 | 16.1 1.5 | 4.0 |
| 00 42 10.91 | +41 12 48.6 | 8.6 | 57.2 | 6.1 1.3 | 1.5 |
| 00 42 11.74 | +41 10 49.0 | 9.3 | 111.2 | 12.4 2.0 | 3.1 |
| 00 42 11.96 | +41 16 49.4 | 9.6 | 52.0 | 5.3 1.0 | 1.3 |
| 00 42 12.14 | +41 17 58.4 | 13.9 | 100.5 | 10.3 1.4 | 2.5 |
| 00 42 13.15 | +41 18 36.7 | 122.4 | 1369.3 | 140.4 3.9 | 34.7 |
| 00 42 15.16 | +41 12 34.6 | 76.9 | 874.7 | 91.9 3.2 | 22.7 |
| 00 42 15.21 | +41 18 01.8 | 6.6 | 44.8 | 4.5 1.0 | 1.1 |
| 00 42 15.53 | +41 20 31.9 | 13.6 | 102.6 | 10.6 1.4 | 2.6 |
| 00 42 15.73 | +41 17 20.7 | 21.9 | 172.4 | 17.3 1.5 | 4.3 |
| 00 42 15.93 | +41 01 15.5 | 26.5 | 2067.6 | 339.2 9.0 | 83.8 |
| 00 42 17.01 | +41 15 08.5 | 36.9 | 310.7 | 31.2 1.9 | 7.7 |
| 00 42 18.36 | +41 12 24.1 | 114.9 | 1202.8 | 126.0 3.7 | 31.1 |
| 00 42 18.65 | +41 14 02.1 | 110.0 | 988.1 | 100.1 3.2 | 24.7 |
| 00 42 20.57 | +41 26 40.7 | 4.1 | 58.0 | 6.9 3.4 | 1.7 |
| 00 42 21.49 | +41 16 01.4 | 116.6 | 711.8 | 69.8 2.6 | 17.2 |
| 00 42 21.56 | +41 14 19.6 | 5.6 | 17.9 | 1.8 0.6 | 0.4 |
| 00 42 22.45 | +41 13 34.2 | 69.0 | 444.8 | 44.9 2.2 | 11.1 |
| 00 42 22.95 | +41 15 35.5 | 492.5 | 3469.5 | 340.1 5.8 | 84.0 |
| 00 42 23.17 | +41 14 07.7 | 27.9 | 159.2 | 15.9 1.3 | 3.9 |
| 00 42 25.15 | +41 13 40.9 | 15.4 | 82.5 | 8.2 1.0 | 2.0 |
| 00 42 26.06 | +41 19 15.0 | 32.6 | 183.9 | 18.1 1.4 | 4.5 |
| 00 42 26.11 | +41 25 51.0 | 9.4 | 165.2 | 18.7 3.7 | 4.6 |
| 00 42 28.21 | +41 10 00.8 | 55.7 | 610.4 | 66.4 2.9 | 16.4 |
| 00 42 28.30 | +41 12 23.3 | 227.8 | 1774.8 | 179.7 4.3 | 44.4 |
| 00 42 28.88 | +41 04 36.1 | 17.8 | 572.3 | 73.6 5.1 | 18.2 |
| 00 42 29.11 | +41 28 57.0 | 5.4 | 101.9 | 12.5 4.8 | 3.1 |
| 00 42 30.99 | +41 19 10.9 | 5.4 | 19.8 | 1.9 0.6 | 0.5 |
| 00 42 31.14 | +41 16 21.8 | 331.9 | 1369.8 | 131.3 3.6 | 32.4 |
| 00 42 31.25 | +41 19 38.9 | 78.5 | 476.7 | 46.5 2.2 | 11.5 |
| 00 42 32.08 | +41 13 14.6 | 147.9 | 945.0 | 94.0 3.1 | 23.2 |
| 00 42 32.75 | +41 13 11.2 | 34.3 | 171.8 | 17.1 1.3 | 4.2 |
| 00 42 33.89 | +41 16 20.0 | 57.1 | 161.4 | 15.4 1.2 | 3.8 |
| 00 42 34.16 | +41 21 49.5 | 5.5 | 31.8 | 3.2 0.9 | 0.8 |
| 00 42 35.21 | +41 20 06.0 | 30.3 | 157.0 | 15.3 1.3 | 3.8 |
| 00 42 36.62 | +41 13 50.4 | 7.7 | 22.9 | 2.2 0.5 | 0.6 |
| 00 42 38.58 | +41 16 03.9 | 1329.0 | 9219.4 | 872.8 9.1 | 215.6 |
| 00 42 39.54 | +41 14 28.7 | 78.3 | 239.5 | 23.2 1.5 | 5.7 |
| 00 42 39.57 | +41 16 14.5 | 260.5 | 1104.0 | 104.4 3.1 | 25.8 |
| 00 42 39.65 | +41 17 00.7 | 5.5 | 12.7 | 1.2 0.4 | 0.3 |
| 00 42 39.98 | +41 15 47.7 | 144.2 | 550.0 | 52.2 2.2 | 12.9 |
| 00 42 40.21 | +41 18 45.3 | 55.2 | 193.1 | 18.5 1.3 | 4.6 |
| 00 42 40.56 | +41 10 33.5 | 6.2 | 42.8 | 4.5 1.0 | 1.1 |
| 00 42 40.68 | +41 13 27.6 | 32.3 | 113.5 | 11.2 1.1 | 2.8 |
| 00 42 41.43 | +41 15 24.0 | 53.8 | 163.2 | 15.6 1.2 | 3.9 |
| 00 42 41.59 | +41 21 05.8 | 10.4 | 64.6 | 6.4 1.1 | 1.6 |
| 00 42 42.06 | +41 15 32.1 | 14.6 | 42.2 | 4.0 0.6 | 1.0 |
| 00 42 42.14 | +41 12 18.2 | 4.6 | 16.2 | 1.6 0.5 | 0.4 |
| 00 42 42.33 | +41 14 45.6 | 96.1 | 300.2 | 29.0 1.7 | 7.2 |
| 00 42 42.46 | +41 15 53.9 | 103.7 | 399.9 | 38.0 1.9 | 9.4 |
| 00 42 42.52 | +41 16 59.4 | 5.0 | 14.4 | 1.4 0.4 | 0.3 |
| 00 42 42.74 | +41 15 03.8 | 4.2 | 9.8 | 0.9 0.3 | 0.2 |
| 00 42 42.97 | +41 15 43.3 | 83.1 | 316.4 | 30.2 1.7 | 7.5 |
| 00 42 43.11 | +41 16 04.2 | 33.8 | 123.6 | 11.7 1.1 | 2.9 |
| 00 42 43.18 | +41 16 40.4 | 17.4 | 52.3 | 5.0 0.7 | 1.2 |
| 00 42 43.31 | +41 13 19.8 | 49.2 | 175.5 | 17.4 1.3 | 4.3 |
| 00 42 43.74 | +41 16 32.6 | 104.7 | 413.3 | 39.2 1.9 | 9.7 |
| 00 42 43.80 | +41 16 29.2 | 11.8 | 47.9 | 4.5 0.7 | 1.1 |
| 00 42 43.85 | +41 16 04.1 | 35.2 | 133.3 | 12.7 1.1 | 3.1 |
| 00 42 43.95 | +41 17 55.7 | 37.3 | 116.2 | 11.1 1.0 | 2.7 |
| 00 42 44.26 | +41 16 14.4 | 7.7 | 26.2 | 2.5 0.5 | 0.6 |
| 00 42 44.35 | +41 16 08.9 | 47.7 | 151.6 | 14.4 1.2 | 3.6 |
| 00 42 44.35 | +41 16 05.5 | 101.3 | 418.2 | 39.8 2.0 | 9.8 |
| 00 42 44.37 | +41 16 07.6 | 159.2 | 641.1 | 61.0 2.4 | 15.1 |
| 00 42 44.38 | +41 11 58.7 | 10.6 | 46.1 | 4.7 0.8 | 1.2 |
| 00 42 44.66 | +41 16 18.3 | 42.0 | 156.3 | 14.9 1.2 | 3.7 |
| 00 42 44.84 | +41 11 38.4 | 116.2 | 888.4 | 91.5 3.1 | 22.6 |
| 00 42 44.88 | +41 17 40.0 | 33.6 | 113.5 | 10.8 1.0 | 2.7 |
| 00 42 45.08 | +41 15 23.3 | 33.8 | 109.2 | 10.5 1.0 | 2.6 |
| 00 42 45.10 | +41 14 07.2 | 17.7 | 60.7 | 5.9 0.8 | 1.5 |
| 00 42 45.11 | +41 16 21.8 | 49.7 | 187.8 | 17.9 1.3 | 4.4 |
| 00 42 45.22 | +41 16 11.3 | 24.4 | 86.6 | 8.2 0.9 | 2.0 |
| 00 42 45.58 | +41 16 08.8 | 28.2 | 100.7 | 9.6 1.0 | 2.4 |
| 00 42 45.99 | +41 16 19.7 | 17.7 | 59.7 | 5.7 0.8 | 1.4 |
| 00 42 46.14 | +41 15 43.5 | 13.8 | 43.3 | 4.1 0.6 | 1.0 |
| 00 42 46.89 | +41 21 18.9 | 6.3 | 27.6 | 2.8 0.9 | 0.7 |
| 00 42 46.95 | +41 16 15.7 | 163.2 | 715.4 | 68.2 2.6 | 16.8 |
| 00 42 47.15 | +41 16 28.6 | 274.6 | 1290.6 | 122.9 3.4 | 30.4 |
| 00 42 47.17 | +41 14 13.2 | 4.7 | 13.3 | 1.3 0.4 | 0.3 |
| 00 42 47.28 | +41 11 58.4 | 8.0 | 37.1 | 3.8 0.7 | 0.9 |
| 00 42 47.44 | +41 15 07.8 | 22.8 | 70.9 | 6.9 0.8 | 1.7 |
| 00 42 47.87 | +41 15 50.2 | 7.3 | 23.2 | 2.2 0.5 | 0.5 |
| 00 42 47.87 | +41 15 33.1 | 207.6 | 838.5 | 80.8 2.8 | 19.9 |
| 00 42 48.48 | +41 25 21.9 | 49.2 | 1033.8 | 114.0 4.1 | 28.2 |
| 00 42 48.50 | +41 15 21.4 | 435.5 | 1901.4 | 183.7 4.2 | 45.4 |
| 00 42 48.69 | +41 16 24.7 | 12.3 | 49.1 | 4.7 0.7 | 1.2 |
| 00 42 49.13 | +41 17 42.3 | 5.1 | 15.6 | 1.5 0.4 | 0.4 |
| 00 42 49.20 | +41 18 16.0 | 35.4 | 129.4 | 12.4 1.1 | 3.1 |
| 00 42 51.28 | +41 16 39.7 | 21.7 | 74.2 | 7.1 0.8 | 1.8 |
| 00 42 51.67 | +41 13 03.3 | 9.0 | 35.8 | 3.6 0.7 | 0.9 |
| 00 42 52.01 | +41 31 07.6 | 57.7 | 4727.5 | 679.9 10.6 | 167.9 |
| 00 42 52.30 | +41 17 34.7 | 7.1 | 22.9 | 2.2 0.5 | 0.5 |
| 00 42 52.50 | +41 15 40.1 | 403.3 | 2053.1 | 199.4 4.4 | 49.3 |
| 00 42 52.50 | +41 18 54.4 | 291.2 | 1914.5 | 187.3 4.3 | 46.3 |
| 00 42 52.58 | +41 13 28.1 | 4.2 | 13.7 | 1.4 0.5 | 0.3 |
| 00 42 53.49 | +41 25 49.9 | 8.8 | 183.4 | 20.6 2.3 | 5.1 |
| 00 42 54.91 | +41 16 03.3 | 341.8 | 1702.3 | 166.5 4.0 | 41.1 |
| 00 42 55.18 | +41 18 36.4 | 16.7 | 81.4 | 8.0 1.0 | 2.0 |
| 00 42 55.30 | +41 20 45.5 | 6.0 | 39.1 | 3.9 1.1 | 1.0 |
| 00 42 55.31 | +41 25 58.0 | 17.5 | 431.9 | 49.0 3.0 | 12.1 |
| 00 42 55.59 | +41 18 35.2 | 20.0 | 95.3 | 9.4 1.0 | 2.3 |
| 00 42 57.91 | +41 11 05.2 | 84.3 | 922.7 | 98.7 3.4 | 24.4 |
| 00 42 58.30 | +41 15 29.4 | 27.1 | 127.1 | 12.7 1.2 | 3.1 |
| 00 42 59.30 | +41 16 43.3 | 31.3 | 141.8 | 14.0 1.2 | 3.5 |
| 00 42 59.51 | +41 12 42.8 | 4.2 | 22.5 | 2.3 0.9 | 0.6 |
| 00 42 59.64 | +41 19 19.3 | 125.3 | 1046.3 | 104.9 3.3 | 25.9 |
| 00 42 59.86 | +41 16 06.0 | 180.8 | 1080.2 | 107.5 3.3 | 26.6 |
| 00 43 01.09 | +41 13 51.5 | 8.5 | 31.3 | 3.2 0.7 | 0.8 |
| 00 43 01.23 | +41 30 17.2 | 9.5 | 708.4 | 91.0 6.0 | 22.5 |
| 00 43 02.90 | +41 15 22.8 | 143.0 | 945.3 | 95.9 3.1 | 23.7 |
| 00 43 03.01 | +41 20 42.0 | 5.8 | 35.9 | 3.7 1.2 | 0.9 |
| 00 43 03.11 | +41 10 16.1 | 15.2 | 148.2 | 16.2 1.8 | 4.0 |
| 00 43 03.20 | +41 15 28.2 | 36.2 | 196.8 | 20.0 1.5 | 4.9 |
| 00 43 03.28 | +41 21 21.8 | 32.6 | 304.8 | 31.8 2.0 | 7.8 |
| 00 43 03.82 | +41 18 05.1 | 94.6 | 843.8 | 84.7 3.0 | 20.9 |
| 00 43 04.20 | +41 16 01.6 | 14.0 | 70.4 | 7.1 1.0 | 1.8 |
| 00 43 05.65 | +41 17 02.8 | 678.2 | 8796.6 | 891.7 9.5 | 220.3 |
| 00 43 06.98 | +41 18 10.5 | 8.9 | 49.3 | 5.0 1.2 | 1.2 |
| 00 43 07.47 | +41 20 21.0 | 17.5 | 182.8 | 19.1 1.7 | 4.7 |
| 00 43 08.45 | +41 12 47.4 | 8.9 | 95.8 | 10.2 1.3 | 2.5 |
| 00 43 09.82 | +41 19 00.8 | 78.5 | 831.2 | 85.9 3.1 | 21.2 |
| 00 43 10.59 | +41 14 51.4 | 180.5 | 1970.3 | 205.0 4.7 | 50.6 |
| 00 43 11.39 | +41 18 09.6 | 5.9 | 30.6 | 3.2 1.0 | 0.8 |
| 00 43 13.19 | +41 18 14.2 | 10.1 | 75.4 | 7.9 1.3 | 1.9 |
| 00 43 14.38 | +41 07 21.4 | 46.7 | 1233.7 | 148.0 5.1 | 36.6 |
| 00 43 16.06 | +41 18 41.5 | 11.5 | 124.8 | 13.2 1.8 | 3.3 |
| 00 43 18.54 | +41 09 50.0 | 5.9 | 60.3 | 7.0 2.6 | 1.7 |
| 00 43 18.92 | +41 20 16.7 | 16.3 | 258.4 | 28.2 2.8 | 7.0 |
| 00 43 20.99 | +41 17 48.4 | 7.9 | 91.8 | 9.9 1.9 | 2.4 |
| 00 43 24.79 | +41 17 29.0 | 4.5 | 69.3 | 7.6 1.8 | 1.9 |
| 00 43 27.85 | +41 18 30.5 | 22.5 | 370.8 | 41.2 3.0 | 10.2 |
| 00 43 29.07 | +41 07 48.4 | 21.7 | 597.9 | 74.4 4.8 | 18.4 |
| 00 43 32.51 | +41 10 40.9 | 16.1 | 347.8 | 41.3 4.8 | 10.2 |
| 00 43 34.33 | +41 13 24.6 | 32.7 | 806.1 | 93.5 4.5 | 23.1 |
| 00 43 37.11 | +41 14 43.6 | 42.5 | 1263.8 | 147.5 5.2 | 36.4 |
| 00 43 53.62 | +41 16 54.0 | 23.0 | 947.0 | 123.3 6.0 | 30.5 |
Note. — Table 1 contains for each source detected in our Chandra observation: RA and DEC – the coordinates in J2000, S/N - the source detection significance in , Counts – the net counts, Flux – the photon flux, and Luminosity – the estimated luminosity based on the spectral model described in the text. We note that source names should be formed by appending the coordinates, truncated to the first decimal of seconds in RA and whole seconds in DEC, to the identifier CXOM31, e.g. the first source in the list is CXOM31 J004150.4+411337.
| Chandra source | 2Mass source | GC | |||
|---|---|---|---|---|---|
| J004209.6+411745 | 0042094+411745 | 1.3 | MIT 140 | 0.8 | 0.5 |
| J004210.2+411510 | 0042102+411510 | 0.1 | |||
| J004212.1+411758 | 0042121+411758 | 0.4 | 078-140 | 0.6 | 0.5 |
| J004215.9+410115 | 0042158+410114 | 1.6 | 082-144 | 1.6 | 0.4 |
| J004218.6+411402 | 0042186+411402 | 0.0 | 086-148 | 0.2 | 0.4 |
| J004221.5+411419 | 0042215+411419 | 0.1 | |||
| J004226.0+411915 | 0042260+411914 | 0.2 | 096-158 | 0.5 | 0.3 |
| J004231.2+411938 | 0042312+411938 | 0.0 | MIT 192 | 0.6 | 0.3 |
| J004240.5+411033 | 0042406+411033 | 1.3 | 123-182 | 1.3 | 0.0 |
| J004241.4+411524 | MIT 213 | 1.5 | |||
| J004252.0+413107 | 0042519+413107 | 0.6 | 135-192 | 0.5 | 0.2 |
| J004255.5+411835 | 138-000 | 0.3 | |||
| J004259.6+411919 | 143-198 | 0.0 | |||
| J004259.8+411606 | 144-000 | 0.5 | |||
| J004301.2+413017 | 0043014+413017 | 2.4 | MIT 236 | 2.3 | 0.2 |
| J004302.9+411522 | 146-000 | 0.6 | |||
| J004303.2+412121 | 147-199 | 0.5 | |||
| J004303.8+411805 | 148-200 | 0.3 | |||
| J004307.4+412021 | 150-203 | 1.5 | |||
| J004310.5+411451 | 0043106+411451 | 0.5 | MIT 251 | 1.0 | 0.5 |
| J004314.3+410721 | 0043144+410721 | 0.4 | 158-213 | 0.6 | 0.1 |
| J004337.1+411443 | 0043372+411443 | 2.0 | MIT 299 | 2.3 | 0.3 |
Note. — Table 2 gives coincidences between Chandra HRC sources and infrared sources and globular clusters. The table contains: Chandra source – the Chandra HRC source (CXOM31), 2Mass source – the 2mass infrared source, – the displacement between the Chandra source and the 2mass source in arcseconds, GC – the name of the globular cluster, – the displacement between the Chandra source and the globular cluster in arcseconds, – the displacement between the globular cluster and the 2mass source in arcseconds. Globular clusters taken from Barmby (2001) are listed as two sets of three digits and those taken from Magnier (1993) are listed as MIT followed by three digits.