ASCA observations of groups at radii of low overdensity.
Implications for the cosmic preheating.
Abstract
Through a 3d-modeling of ASCA observations, we performed a spatially resolved X-ray spectroscopic study, extending to radii exceeding 150 kpc, for a sample of 9 groups of galaxies. Combined with published ROSAT results, we conclude that these systems generally exhibit a strong temperature decline at outer radii. In our best case, NGC3268, this corresponds to a flattening of the entropy profile at a level of keV cm2. This value is high compared both to the observed entropy floor of keV cm2 and to the expected value from gravitational heating. We suggest that the observed entropy profile in most groups at densities exceeding 500 times the critical is purely driven by non-gravitational heating processes. After comparison with a larger sample of groups and clusters, we conclude that there is a variation in the level of non-gravitational heating between keV cm2 and keV cm2 within every system. Using models of cluster formation as a reference frame, we established that the accreted gas reaches an entropy level of keV cm2 by redshift , while such high entropies where not present at redshifts higher than , favoring nearly instantaneous preheating. Adopting galactic winds as a source of preheating, and scaling the released energy by the observed metal abundance, the variation in the preheating could be ascribed mostly to variation in the typical overdensity of the energy injection, for an entropy floor ( keV cm2) and to for an entropy of keV cm2.
Subject headings:
Abundances — galaxies: clusters: general — galaxies: evolution — intergalactic medium — stars: supernovae — X-rays: galaxies1. Introduction
Comparative studies of the scaling relations in clusters of galaxies reveal strong deviations of the observed relations from predictions based on self-similar collapse (Evrard & Henry 1991; Bower 1996; Loewenstein 2000; Finoguenov, Reiprich, Böhringer 2001). These deviations are best characterized by an entropy floor in the X-ray emitting gas. While negligible compared to the entropy due to the accretion shock in large clusters, such preheating111We define preheating as a change in the initial adiabat for the gas before its accretion into the potentials of groups and clusters. The plausible sources of preheating include galactic winds and AGN activity, as well as gravitational shocks associated with the formation of large scale structure. leads to very extended, low-density gas distributions on the scales of groups, that cause a steepening of most scaling relations (Ponman, Cannon, Navarro 1999, hereafter PCN). When the temperature of the preheated gas reaches the level comparable to the virial temperature, simulations predict adiabatic accretion of the gas (e.g. Tozzi, Scharf, Norman 2000). This also implies strong temperature gradients, proportional to the gas density to the 2/3 power (). As noted by Loewenstein (2000), the observation of this phenomena is a critical test for the importance of preheating, as well as other characteristics of cluster collapse. So far no clear examples of systems with an adiabatic gas distribution have been found.
Throughout this Paper we will define the entropy as in keV cm2, following PCN. The observational data is presented assuming km s-1 Mpc-1.
2. Observations
We select our sample of groups by cross-correlating ASCA (Tanaka, Inoue & Holt 1994) and ROSAT (Truemper 1983) archival data on elliptical galaxies with the group catalogs by Huchra & Geller (1982) and Hickson (1982). From an initial sample of 23 groups, we omit 12 because of insufficient coverage by ASCA SIS (Burke et al. 1991) or availability of only ROSAT HRI data, that after a critical check, does not allow the study of the surface brightness profile at the radii of interest. Specifically, our criterium was source extent exceeding 150 kpc. In addition, we exclude HCG92 and NGC3923, because the ’group’ component of these two systems does not appear clearly in the ASCA data (for HCG92, see also ROSAT HRI analysis of Pietsch et al. 1997).
All observations were screened using FTOOLS version 4.2 with standard screening criteria. An advantage of ASCA data is its low background, compared to Chandra and XMM, which is essential for studies of low surface brightness emission. An obvious drawback is the complexity of the broad ASCA PSF. Detailed treatment of the PSF effects is therefore a critical part of our analysis, where we follow the approach described in Finoguenov et al. (1999), also including the geometrical projection of the three-dimensional distribution of X-ray emitting gas. Compared to clusters of galaxies, however, the temperature structure of groups is defined by the Fe L-shell peak, thus decreasing the importance of energy dependent effects of ASCA PSF on temperature determination, as they affect primarily the continuum. In addition, for energies below 2 keV, the energy dependence of the ASCA PSF is negligible. Our minimization routines are based on the criterion. No energy binning is done, but an error calculation is introduced as in Churazov et al. (1996) to properly account for small number statistics. Model fits to the ROSAT surface brightness profiles of these groups are used as the input to the ASCA data modeling. The details of our minimization procedure for ASCA spectral analysis are described in Finoguenov and Ponman (1999). We adapted the XSPEC analysis package to perform the actual fitting and error estimation. The spatially resolved spectral characteristics are quoted as the best fit solution, plus an estimate of the 90 % confidence area for possible parameter variation, based on the regularization technique (Press et al. 1992; Finoguenov and Ponman 1999). To study the systematic errors related to the spatially resolved spectroscopic analysis of the ASCA data, we follow the approach described in Finoguenov, David and Ponman (2000; hereafter FDP). For all ROSAT imaging analysis, we use the software described in Snowden et al. (1994) and references therein.
NGC5129 IC4296 NGC4325
NGC7619 NGC2300 NGC507
NGC2563 NGC6329 NGC3268


NGC5129 IC4296 NGC4325
NGC7619 NGC2300 NGC507
NGC2563 NGC6329 NGC3268
| Name | D | ′ | ♮ | ♮ | |||||||
|---|---|---|---|---|---|---|---|---|---|---|---|
| Mpc | kpc | kpc | keV | keV | Mpc | total | galaxy | ||||
| NGC5129 | 139. | 39. | 0.60 | 96. | 0.75 | 0.07 | 1.07 | 18.4 | 0.69 | 5.5 | 0.66 |
| IC4296 | 76. | 22. | 0.31 | 58. | 0.95 | 0.16 | 1.20 | 8.3 | 0.42 | 1.4 | 0.92 |
| NGC4325 | 155. | 43. | 0.59 | 14. | 0.98 | 0.07 | 1.22 | 54.8 | 0.61 | 33.3 | 0.62 |
| NGC7619 | 75. | 21. | 0.33 | 48. | 1.00 | 0.02 | 1.23 | 6.2 | 0.82 | 2.2 | 0.64 |
| NGC2300 | 38. | 11. | 0.33 | 34. | 1.01 | 0.23 | 1.24 | 0.8 | 0.63 | 0.4 | 0.56 |
| NGC507 | 98. | 27. | 0.44 | 16. | 1.34 | 0.05 | 1.43 | 28.6 | 0.89 | 9.2 | 0.85 |
| NGC2563 | 90. | 25. | 0.40 | 86. | 1.36 | 0.10 | 1.44 | 4.5 | 0.86 | 0.8 | 0.60 |
| NGC6329 | 167. | 46. | 0.53 | 120. | 1.45 | 0.12 | 1.49 | 19.4 | 0.89 | 3.8 | 0.88 |
| NGC3268♭ | 57. | 16. | 0.32 | 62. | 1.82 | 0.06 | 1.66 | 40.1 | 0.86 | ||
♮ Deprojected luminosity in units of ergs/s, in the 0.5–2 keV band
♭ also referred to as the Antlia cluster or NGC3258, the second brightest galaxy
† fraction of line emission, based on the iron abundance and assuming the solar abundance ratio
We use the MEKAL plasma code (Mewe et al. 1985, Mewe and Kaastra 1995, Liedahl et al. 1995) in all of our spectral analysis. Spectral fitting was twofold. First we use the energy range 0.8–7 keV and determine the intensity of the hard component, arising from the unresolved point sources in the central galaxy, fixing its spectral shape to a bremsstrahlung temperature of 6.5 keV (Finoguenov & Jones 2000). This is mostly important for heavy element abundance determination (Matsushita 1998) and is a specific of the analysis of X-ray spectra of early-type galaxies, where the gas-to-light ratio is an order of magnitude lower than in clusters of galaxies. Later we perform the analysis in the 0.8–3 keV band, where the group’s emission is clearly seen over the background. The exception is NGC3268, which is much hotter (2.5 keV) than other groups. For it we use the 0.8–7 keV energy band. Below 1.5 keV, we add a 10% systematic error at the 68% confidence level to the spectra to account for systematics in spectral modeling.
The groups, centered on NGC2300, IC4296, NGC5129, NGC6329 and NGC2563 have in the ASCA fields of view point-like background sources, which are brighter than the ’blank-sky’ threshold chosen for ASCA background files and thus should be removed individually. In these cases we extract the spectra of point sources using both the ROSAT/PSPC and the ASCA/SIS, subtract the background, analyze the spectra and then, at all energies of the ASCA response matrix, estimate the contribution from these point sources to the regions of diffuse emission selected for the analysis.
Basic characteristics of the sample are listed in Tab.1. Column (1) identifies the system, (2) is the adopted luminosity distance, (3) the corresponding scale length. Columns (4–5) give the results of the surface brightness fitting outside the central region using a model. Column (6) gives the best fit cluster emission-weighted temperature, (7) the corresponding 90% error, and (8) an estimate of the virial radius of the system ( Mpc; Evrard, Metzler, Navarro 1996) using . Estimates of the virial radii using X-ray observations by Finoguenov, Reiprich and Böhringer (2001) show that the actual virial radii are 20% lower than the estimation of Evrard et al. (1996). Columns (9–12) list the luminosity in the 0.5-2 keV band and a fractional contribution from the line emission for the system in total and the central galaxy (excluding the hard component). The deprojected luminosity is calculated using the profiles of temperature, element abundance and normalization, obtained in our analysis of ASCA SIS data. The luminosity is not corrected for differences in normalization between ASCA SIS and other experiments. Since line emission in our energy band is dominated by iron, in calculating the fractional contribution of the line emission, we use the derived iron abundance profile and assume a solar abundance ratio for other elements. We attribute to the central galaxy the X-ray emission of temperature matching the stellar velocity dispersion, which is typically one-two central bins in our analysis.
3. Radial profiles of temperature and entropy

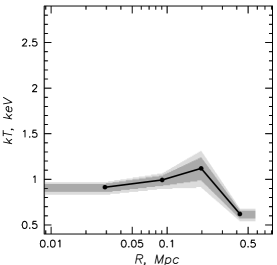
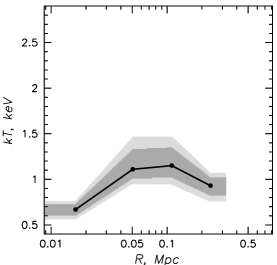
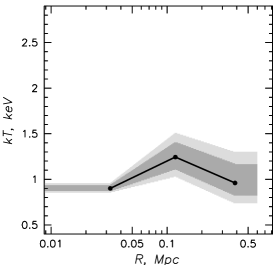
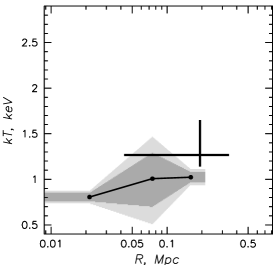
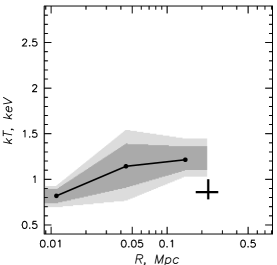
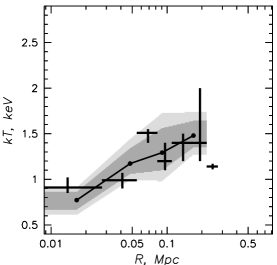
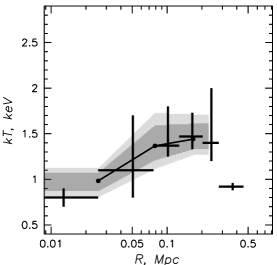
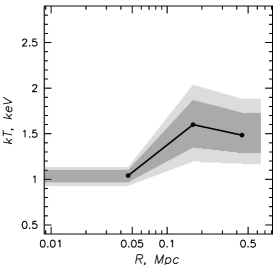
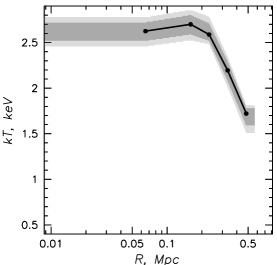
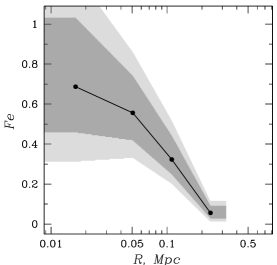
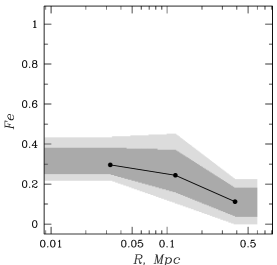
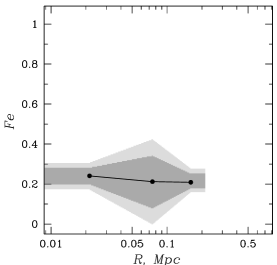
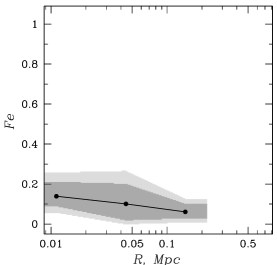
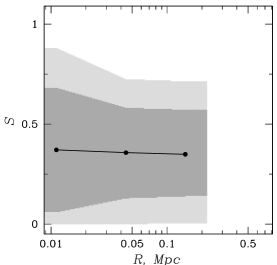
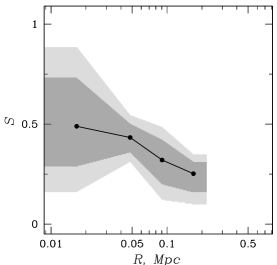
Temperature and entropy profiles are presented in Figs.1 and 2. Heavy element abundances are of secondary interest to this paper and are discussed in the appendix. The data on temperature, entropy, Fe and Si abundance is given in Tab.2. The general behavior of the temperature profiles is defined by kinematics of the stellar mass loss at the center (Matsushita 2001), characterized by the velocity dispersion of stars in the central galaxy. Beyond radii of 150 kpc, the galaxy contribution is small and the emission is dominated by the intragroup gas, which exhibits a gradual decrease in temperature, extending to the observational limits. In our sample, the best examples of such temperature behavior are the NGC3268, NGC5129 and IC4296 groups. A central drop in temperature is not seen in NGC3268, suggesting that the emission is dominated by the ICM gas at radii as small as 50 kpc. ROSAT observations, extending to larger radii, show that the temperature also drops in NGC2563, NGC507 (Buote 2000), and possibly in NGC2300 (Davis et al. 1996). A decrease of the temperature profile at radii exceeding 150 kpc is commonly seen in groups (Trinchieri et al. 1997; Finoguenov et al. 1999; Finoguenov & Ponman 1999, Buote 2000, Finoguenov & Jones 2000). Total gravitational mass estimates for the five best observed systems (NGC3268, NGC6329, NGC4325, IC4296 and NGC5129) are given in Finoguenov, Reiprich, Böhringer (2001).
In deriving the temperature profiles, we were particularly interested in revealing any isentropic zones in groups. As one can see from Fig.1, where temperature profiles are shown, several groups show sharp temperature declines at large radii, typically exceeding 200 kpc. Thus the detection of isentropic behavior is limited by the spatial extent of the data.
Isentropic outskirts in the NGC3268 group
The X-ray emission from the Antlia (NGC3268) group is extended, filling the ROSAT PSPC field of view. The determination of the surface brightness with the ROSAT PSPC has a large uncertainty, due to the source extent and uncertain level of the ROSAT background, caused by the short exposure time (6 ksec). Inclusion of ASCA data for the surface brightness analysis constrains the parameter, because ASCA has a lower background at the radii of interest, due to additional pointings that cover the group outskirts. With four pointings, about 30 ksec each, the ASCA data cover the central 35′ of the cluster. The results of the analysis are listed in Tab.1.
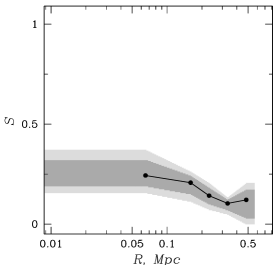
Given the flat gas density profile, projection effects are important. ASCA SIS projected temperature is keV, in agreement with the GIS results of Nakazawa et al. (2000), while the deprojected temperature at the center is keV (Fig.1). We note that the temperature drop from 0.2 to 0.6 Mpc in the Antlia cluster is detected in two off-set ASCA pointings, that cover the south-west part of the cluster. From the constant entropy level seen at outer radii in the Antlia cluster (Fig.2), we conclude that the temperature drop is primarily due to the cluster emission and not to a contribution from NGC3258, located south-west of NGC3268. Our arguments are based on a factor of 3 lower entropy, typical of the group centers (Lloyd-Davies et al. 2000 and this work), compared to the adiabat of the gas at the place of NGC3258. In addition, enhancement in the surface brightness would be seen in the ROSAT map, as well as more than just one galaxy (NGC3258) ought to be associated with the putative subgroup. Finally a coincidental match of the temperature close to the center of the Antlia cluster and at larger distances, reaching 600 kpc, would require fine tuning. For another group, AS1101, first XMM-Newton results reveal a temperature profile in remarkable correspondence to NGC3268 (Kaastra et al. 2001).
From radii of 150 kpc to 600 kpc, the entropy profile of the Antlia cluster is flat at the level of 430 keV cm2. In many groups the temperature drop is very sharp, corresponding to the leveling off of the entropy at a value of keV cm2 (see Fig.2). While the plateau in the entropy profile is predicted by the preheating scenario, the observed entropy level is 3 times higher than the measurement of PCN. In the following we consider the reasons for this phenomenon.
4. A ceiling in the preheating value for entropy
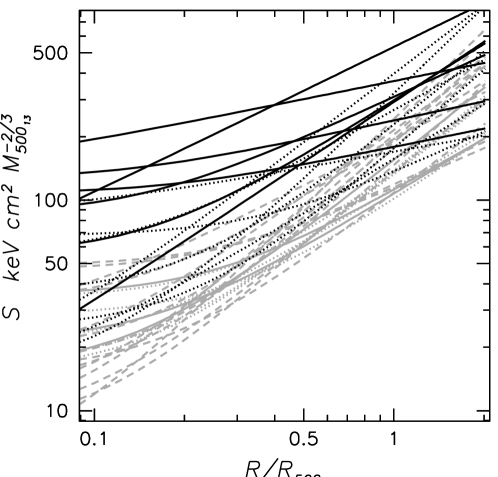
We compare the observed entropy level at the group’s outskirts to that predicted from scaling relations, choosing an overdensity () of 500, , where is the mean density of the cluster integrated out to . In Finoguenov, Reiprich and Böhringer (2001) we estimated radii for (hereafter ), the polytropic index and the total mass , while in Sanderson et al. (2002) we fit a -model to the observed ASCA de-projected density. The employed -model fits to surface brightness profiles and polytropic fits to the temperature profiles are only valid outside the cores of the systems, typically larger than . The resulting entropy profiles for samples of groups and clusters are plotted in Fig.3 vs the fraction of , scaled by , the total enclosed mass measured within in units of M⊙. Such scaling is equivalent to scaling by virial temperature and is introduced to remove the dependence of the shock strength on the cluster mass. We use the mass instead of the measured temperature to exclude the effect of adiabatic compression. Entropy profiles produced by the accretion shock exhibit the strongest rise with radius, as seen for rich clusters (also David et al. 1996). Entropy profiles of groups are much shallower (solid and dotted lines in Fig.3) and, especially at smaller radii, are higher than found for clusters.
The flatter entropy profiles found for groups are in good agreement with simulations that introduce an entropy floor (Borgani et al. 2001). However, at low overdensities groups still deviate from clusters. These deviations are opposite to the prediction of structure formation, since groups form earlier than clusters, resulting in lower entropy. These deviations are larger than expected due to the entropy floor (PCN) and the effect of gas cooling (Voit & Bryan 2001).
4.1. Effects of gravitational heating and substructure
Clusters do not appear as uniform entities. As Fig.3 (left) shows, at the entropy profiles of clusters start to diverge, so the scatter in the entropy among clusters at a given overdensity becomes similar to the differences between clusters and groups. A critical radius at which such deviations occur corresponds to , matching an earlier suggestion of Evrard et al. (1996) that X-ray determinations of cluster mass should generally be trusted to such radii only. We produce a cut in the entropy profiles at and in Fig.3 (right) plot the resulting entropy values vs the gravitational mass of the system, measured at overdensity of 500. Preheating at the level discussed in this paper (shown as a long-dashed line) can only affect systems with mass () below M⊙, and is successful in describing the entropy behavior in groups.
In Fig.3 (right) we also present the rescaled theoretical prediction for shock heating (Eke, Navarro, Frenk 1998; PCN), with details presented in the appendix. As is seen from the Figure, clusters exhibit a large spread around the theoretical prediction, compared to the effect of variation in the cluster formation epochs.
In this paragraph we consider the possible reasons for the large spread in the entropy among clusters. Incomplete merger shock heating predicts a sharp temperature and density changes, arising from a final time of shock propagation through the cluster. Since Chandra cluster images often show surface brightness edges (Markevitch 2002), the temperature behavior generally suggests cold fronts rather than shocks (Markevitch et al. 2000; Vikhlinin, Markevitch & Murray 2001). Another possibility is that merger shocks start in the cluster core and decrease in strength with radius (due to the flat distribution of the gas density). Finally, survival of the gas associated with the infalling subcluster results in a decreased entropy (e.g. Borgani et al. 2002). Since formation of large clusters is still in progress, compared to poor clusters (Kauffmann 1995), hotter clusters tend to have lower entropy, resulting in a larger range around the entropy prediction which includes the effect of cluster formation epoch. In addition, an observed scatter in the entropy could result from our simplified approximations to both temperature and density profiles. At least in one example of the hot cluster (although not from our sample), A2163, where a decreasing temperature profile from ASCA is confirmed by Chandra and XMM-Newton (Markevitch, Vikhlinin 2001; Pratt, Arnaud, Aghanim 2001), a steepening of the density profile is also suggested at large radii (Vikhlinin, Forman, Jones 1999a). If such behavior is present in other systems, the resulting entropy would be underestimated.
4.2. Leaning over the gravitational threshold
At radii beyond , entropy profiles in clusters may be the result of purely gravitational heating. Preheating will increase the scatter in the entropy profiles between clusters and groups. One can see from Fig.3 (left) that the scatter between cluster and group profiles, compared to the scatter within the cluster profiles, decreases with increasing radius. For example at half , the range among all the systems is a factor of 10, while it is a factor of 2 for clusters. At the scatter is a factor of 3 for all systems and a factor of 2 for clusters, while at yet larger radii the scatter does not change when groups are excluded. This indicates that is a limiting radius where the scatter arising from the non-gravitational effects can still be seen above the scatter resulting from the gravitational heating. This corresponds to a typical mass for the groups in our sample of around M⊙.
Let’s compare the entropy level measured for radii of equal enclosed mass for groups and clusters. Observations show that there is no significant trend in gas fraction with system mass at radii defined this way (Sanderson et al. 2003), which is important in estimating the entropy produced by a given shock strength, as explained in §4.6. Consideration of the entropy at similar enclosed mass is fruitful because the implied strength of the accretion shock is thought to be similar, unless the epoch of cluster formation plays a dominant role. We choose a mass of M⊙ for this comparison, which is still within the analyzed radii for the groups, while outside the 150 kpc radii for clusters in our sample (and thus is free from complications due to BCG potential, cooling flow and BCG AGN heating).
A comparison of the entropy for this enclosed mass is presented in Fig.4 (left panel) for each222In this approach we are limited to samples analyzed by Finoguenov (FDP, FAD and this paper). This excludes a few hot clusters, introduced in Fig.3: A3558, A119, A3571, A401, A3266. of the clusters and groups (38 systems in total) shown in Fig.3. An entropy level of 350 keV cm2 is typical for systems with temperatures below 3 keV. A dramatic change in the behavior of entropy vs temperature occurs above 3 keV, exhibiting a trend towards lower entropy for hotter systems. The dashed line in the left panel of Fig.4 shows the entropy attributed to shock heating, calculated for the mean formation redshift () of groups and clusters (the solid line on the right panel of Fig.4) and up-scaled by a factor of two (it is off the graph when the normalization of PCN is adopted). It is clearly seen that the observed trend is different from the entropy behavior predicted from shock heating.
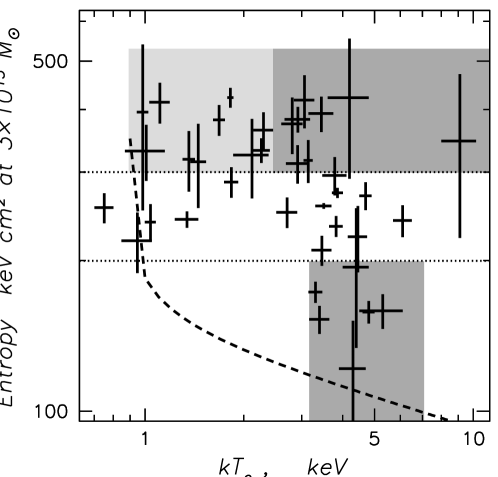
If we assume a similar history of gas preheating in groups and clusters, then the trend in Fig.4 (left) requires a growth in the gas entropy with (Hubble) time, with the entropy increasing from cluster cores () to the outskirts of groups (). The entropy in poor clusters (kT keV; ) reaches a level, comparable to that found in groups. This picture implies both prompt preheating at high-z and a lack of preheating at low-z. Thus we suggest that the preheating level, observed through the entropy, will not increase in other observational tests and corresponding therefore to the entropy ceiling.
An entropy floor has been suggested based on the observation of excess entropy in cores of groups compared to the gravitational heating (PCN). Introduction of the term "ceiling" would represent the upper limit on the preheating, which is a characteristic of any realistic model of the preheating, based on the limited energetics provided by putative sources of preheating, such as SNe. Term entropy ceiling is also appropriate for scenarios ignoring the preheating, where one can reformulate a key assumption of Voit & Bryan (2001), to read ’a ceiling in the preheating value for entropy is much lower than the entropy floor’. Since we prove otherwise, the scenario of Voit & Bryan (2001) in its original formulation is dismissed. Below, we present a more detailed consideration of the establishment of the entropy ceiling, after first noting other supporting observations.
The entropy level for the gas accreting onto the outskirts of clusters can be estimated from the entropy level of filaments connecting the clusters. Durret et al. (1998) found that a galaxy filament close to A85 exhibits an elongated X-ray emission in the 0.4–2 keV band. From the reported flux of ergs cm-2 s-1, estimating the flux collecting area as , and taking the short axis for the third dimension, we obtain a density of the X-ray emitting electrons of cm-3. For emission to be detected in the 0.4–2 keV band, the gas temperature should exceed 0.3 keV, corresponding to an entropy of keV cm2. Briel and Henry (1995) used the ROSAT all sky survey data to combine the measurements of regions connecting physically close clusters of galaxies, identified in Huchra et al. (1990). They obtain a limit on the emission of ergs cm-2 s-1. With the assumption of a 0.5 keV temperature for the gas in filaments, justified by observation of metals in clusters of galaxies (Finoguenov, Arnaud, David 2001; hereafter FAD), Briel and Henry (1995) derived a limit on the gas density333assuming an iron abundance of 0.3 solar of cm-3, which for translates into a lower limit on the entropy of 360 keV cm2. Thus we conclude that also in rich clusters, the entropy of the accreting gas is higher than the entropy floor.
Observations of a newly discovered class of objects, fossil groups or OLEGs (Ponman et al. 1994; Vikhlinin et al. 1999b) also show a high level of preheating (entropy is 350 keV cm2 at radii of the enclosed mass of M⊙, Vikhlinin, A. 2001, private communication).
Interpretation of the relation for clusters of galaxies also requires a higher preheating level of keV cm2 (Babul et al. 2002, McCarthy et al. 2002). The issue of the level of preheating in the theoretical models is still unsettled, as e.g. model of Dos Santos and Dorè (2002) does not require such a high entropy.
4.3. Dating the preheating using a prescription for cluster formation
With recent advances in high-resolution numerical simulations, cosmic microwave background observations, the SN Ia Cosmology project, and surveys of clusters of galaxies, studies of the evolution of the Universe have achieved a convincing picture with a large degree of detail, involving dark energy and dark matter. These constrain the geometry of the Universe, its dynamics and the large-scale structure of the dark matter distribution. Thus, from the difference in the formation epochs for the outskirts of groups compared to cluster cores, we can infer the redshift over which the entropy ceiling has been maintained.
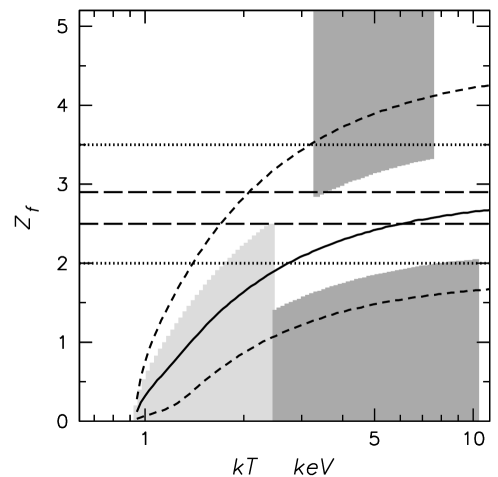
In order to estimate the redshift when most of the preheating occurs, we show in Fig.4 (right) the analytical and numerical results for the formation of clusters (Lacey & Cole 1993), following the formulae presented in Balogh et al. (1999) for . With a solid line we indicate the mean of the cluster formation redshift distribution and with dashed lines the corresponding 10% and 90% values. To represent the measurements on the left panel, we divide the systems into three groups according to the entropy as low, intermediate and high, , , keV cm2, respectively. We attribute the gas with entropy lower than 200 keV cm2 to that accreted before the establishment of the entropy ceiling, while the gas with entropy higher than 300 keV cm2 is considered to achieve the entropy ceiling before accretion. Analysis of the left panel reveals that at least 75% of the low temperature systems have achieved a high level of entropy and therefore have formed later than the entropy ceiling was established. This is shown by the light-grey shaded zone in the right panel. The dark-shaded zone at higher temperatures indicates the presence of both high (at least 25% of clusters) and low (at least 25% of clusters) entropy systems. Low entropy systems are treated as formed before the entropy ceiling was established.
As is shown in Fig.4 (right), at redshifts greater than 2.8–3.5 the accreted gas was characterized by low entropy, while starting at redshifts 2–2.5, the accreted gas is on a high adiabat. Duration of this transition period is very short, Gyr. The limits on the epoch for feedback processes, based on the entropy measurements, crucially depend on the way such feedback occurs. However, a lower limit of on the feedback redshift should hold in any scenario for external (pre) heating. Yet, the requirement of high redshift for the feedback processes responsible for the preheating further supports the dominant role of bulges and is an important input to modeling galaxy formation in high-density environments. This conclusion is in agreement with observational evidence of no star-formation in early-type galaxies since a redshift of 2 (Ellis et al. 1997; Bender et al 1998).
4.4. Relating enrichment to the preheating
In this section we attribute the establishment of the preheating level for the gas to action of the galactic winds. Within this scenario, the metals found in the hot intracluster medium can serve as an additional constraint on the preheating, as they are directly related to the amount of energy released into the ICM (FAD).
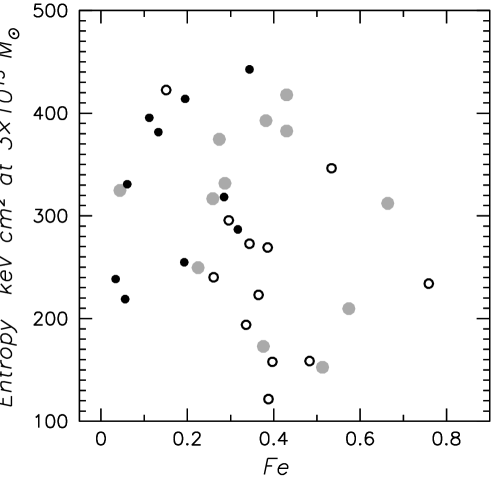
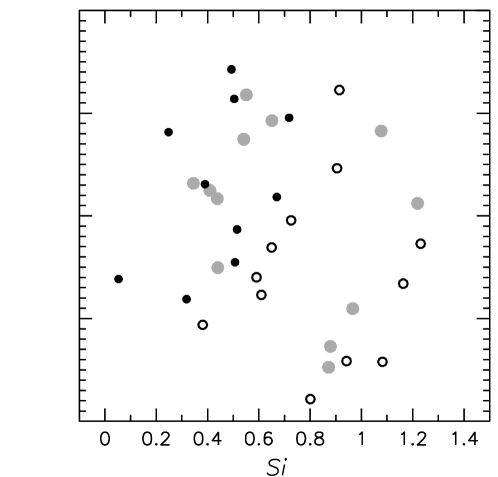
In the previous section we concluded that a high preheating level corresponding to an entropy of about 350 keV cm2 is reached at large radii in all systems. On the other hand, the observed level of heavy element enrichment varies between groups and clusters leading to the suggestion that galaxy winds deposit more energy in clusters (FAD). Moreover, such enrichment was found to be constant over the cluster (FDP), while a simple interpretation of the results of the previous section leads to the expectation of an abundance profile rising with radius. To better illustrate this point, we show in Fig.5 that the entropy at a radius of equal enclosed mass does not correlate with either the Fe or Si abundance.

Apparently, at least part of the enrichment is not associated with the preheating (e.g. SN Ia enrichment occurs at later times, which determines the Fe abundance in clusters at radii corresponding to Fig.5). Furthermore, Chandra and XMM-Newton observations do not significantly change the picture of the distribution of SN II products (David et al. 2001; Matsushita et al. 2002; Molendi & Gastaldello 2001; Tamura et al. 2001).
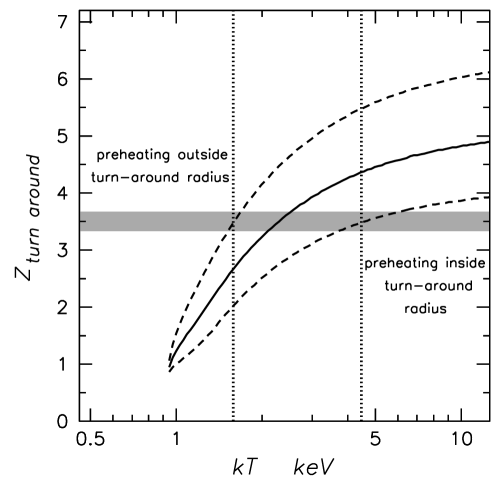
We have concluded that preheating of the gas reaching the virial radius should be complete by a redshift of . Since it takes some time before the preheated gas will be accreted, the redshift of the feedback is somewhat higher. Let’s choose a redshift of 3.5 for the energy injection and calculate the overdensity at which energy injection takes place in order to reproduce the observed entropy for radii corresponding to M⊙ enclosed total mass (it will be possible for us to check the validity of a particular assumption for the redshift). We account only for the effects of star-formation, estimating the amount of energy from direct observations of the chemical enrichment, as calculated by FAD. (For simplicity we will take an average for systems with similar total mass, which is 0.4 keV/particle for groups, reaching 1.2 keV/particle for rich clusters, and analytically expressed as keV/particle). In Fig.6 (left) we determine the overdensity where this amount of heat would lead to the observed entropy level. We assume the electron density at critical density of cm-3 (taking , , ). For the chosen redshift of 3.5, the scaling suitable for results in cm-3 corresponding to the critical density. There is a slight underestimate of the overdensity since we take the density at which we eject the heat as the overdensity. We can take into account at least galaxies embedded in the preheated gas, if we introduce an increase in the overdensity by 20% due to a gas-to-bulge ratio of 5. Variation in the assumption for the redshift changes both left and right panels of Fig.6 such that matching between the temperature of the system at turn-around on both panels is maintained for a broad range of redshifts. A requirement for the minimum derived overdensity to be higher than linear approximation to the growth of primordial density fluctuations () rules out redshifts .
Fig.6 (left) shows that many systems, including the outskirts of groups, are characterized by SN enrichment at turn-around, while cluster cores are characterized by enrichment occurring primarily at higher overdensities. In Fig.6 (right) we present a calculation for the turn-around redshift that corresponds to the virialization epoch, shown in Fig.4 (right). The turn-around time is calculated as half the collapse time, defined in Fig.4 (right). This plot allows us to check our assumption for the star-formation redshift. For the chosen redshift of 3.5, the gas presently accreting onto the outskirts of groups should not necessary be inside the turn around radius. Thus, there is no contradiction in our estimate that injection overdensities are less than 5. In our approach, the preheating level in groups is defined by the overdensity of the material destined to collapse (). Constant entropy behavior at radii of equal enclosed mass is therefore a consequence of a narrow range of possible overdensities and a small scatter in the metal production. For the cores of clusters with temperatures above 4.5 keV, the high overdensity shows that the metal enrichment occurred during the advanced stages of cluster core formation. A more refined approach, would allow for the expectation that most star formation takes place at larger redshifts in the regions which now form cluster cores, compared to the outskirts of groups. This will reduce the range in derived overdensities at which preheating is inferred to happen, and in particular it will increase the very low overdensities inferred for group outskirts. Another effect arises from the importance of SN Ia in the production of metals in groups, generally understood as enrichment at high density regions, thus reducing the level of preheating. Both effects just mentioned are of the same factor of few, compensating each other. Two other uncertainties related to our calculation are the energy-to-temperature transformation, as discussed in Lloyd-Davies et al. (2001), which we assume to be and the energy released per SNe, which we take as ergs in our calculation.
In summary, a gradual increase in the entropy of the accreting gas in any system could be characterized by a single preheating epoch, with the cores of systems being already at an advanced stage of collapse. Flat -element abundance profiles observed in clusters of galaxies (FDP) are naturally reproduced, since at a derived range of overdensities there is no segregation between gas and galaxies. A smoking-gun to define the epoch and level of preheating would be an observation of the thermodynamic state of baryons in the infall regions of clusters, either in emission or absorption.
4.5. Comparison to existing approaches
Borgani et al. (2002) have carried out simulations where various preheating entropy levels are reproduced. One difference between their approach and ours lies in the attitude regarding the high density regions. Borgani et al. (2002) rises the entropy of all particles in the system to the same level, which requires a much higher level of energy injection, as well as preferential deposition of metals into high-density regions. The highest overdensity where we introduce preheating is 30. Since in our approach, we do not add energy to high density regions, we allow star-formation to continue in Ly break galaxies. Still, we are able to preheat the bulk of the gas mass, which resides at lower overdensities. As a consequence, our approach is different to that of Borgani et al. (2002) by requiring the dense regions to cool, either by forming galaxies outside the virial radius or via early cooling flows, as proposed by Voit and Bryan (2001). An advantage of our approach lies in lowering the requirements for the total energy required to achieve the observed preheating level.
One firm conclusion that can be derived from our work is that for star-formation to be responsible for the preheating in groups and clusters, the energy ejection should occur at an early epoch and preferentially in a low-density environment. As star-formation itself usually peaks in high-density regions, it might seem that such a requirement could rule out this scenario. However, examples of local star-formation show that galaxies are very good in building chimneys expel most of the energy and metals (self-regulating star-formation; Larson & Dinerstein 1975). Also if energy is equally deposited at various densities, the low-entropy gas experiences large radiative losses and falls back onto the galaxy and is consumed in subsequent star-formation. Since high overdensities surrounding the galaxy may not become part of the ICM (Larson & Dinerstein 1975), it is quite logical to assume that the energy associated with metals in the ICM comes from the high-entropy tail of the energy ejection (FAD).
Injecting the energy into overdensities lower than 5 requires that the infall of the gas into the group horizon occurs after the gas is preheated. Also, when we calculate the amount of metals in groups, we only account for the filaments that fall in and not those that do not. This explains why it is reasonable to assume no losses due to the removal from galaxies by galactic winds of the part of metals found in clusters.
4.6. Alternative sources of preheating
To estimate the uncertainties in using entropy to constrain the feed-back epoch, one can consider the influence of cooling flows and AGN heating, as well as segregation between mass and gas inside the cluster virial radius.
The high level of entropy, associated with the entropy ceiling is beyond the reach of models that invoke gas cooling (e.g. Voit & Bryan 2001) to explain the 100 keV cm2 entropy floor. We have shown that the high entropy level in the groups’ outskirts is related to recently accreted gas, while lower entropy levels would be more typical of an earlier epoch. One effect of gas cooling is to reduce of the entropy of the gas, due to entropy carried out by emitting photons. However, most of the cooling gas is expected to drop out at the same location as the cooling, so part of the information originally recorded in the entropy at centers of groups and clusters is lost due to the conversion of the X-ray emitting gas into stars. Regarding the systematics of using only the cores of clusters as probes, note that our systems are sampled at a radial range outside the regions, where cooling is appreciable and in addition we use only the hotter component in our analysis of cluster cores.
AGNs are proposed as a source of the preheating, as they may provide much higher energies per particle, compared to SNe (Wu, Fabian & Nulsen 2000). Using the AGN luminosity function with a proper scaling by cluster volume and overdensity, and an increase by a factor of 80 in the AGN activity with the redshift (Miyaji, Hasinger and Schmidt 2000), the energy radiated in X-rays over a Hubble time for all AGN corresponds to 0.2 keV/particle. AGN still could play a dominant role if, according to Fabian & Iwazawa (1999), most of them are absorbed and most of the emission is re-radiated in the infrared. Assuming an efficient accretion mode forming 100% of the local volume density of black holes, a corresponding estimate of the radiated energy is 10-15 keV/particle. Observationally there is a lack of such luminous absorbed AGNs. In particular the optical follow-up of the XMM Lockman-Hole field and Chandra Deep Field South reveal that absorbed AGNs are located at low redshifts (Hasinger 2002, Rosati et al. 2002). Although the identification of AGNs is not yet complete, the unidentified sources are too faint to account for efficient mode of accretion growth of the black holes. Ciotti & Ostriker (1999) also argue that feedback processes prevent AGN from effective accretion.
Another problem, related to the suggestion of Fabian (1999) on AGN importance is related to the conversion of radiated energy to kinetic energy. The most effective mechanism, based on radiative pressure (Silk & Rees 1998), requires galactic column densities of cm2, while the bulk of baryons at high redshift have column densities less than cm2 (Ellison et al. 2001). Yamada & Fujita (2001) considered heating by AGN jets and concluded that jets are capable of providing about 0.3 keV/particle at redshifts below 3. They assume that 1% of normal galaxies are radio galaxies and limit the redshift to be less then 3 using the prediction for the deformation of the cosmic microwave background (Sunyaev-Zel’dovich effect). One can elaborate this scenario by considering the association of radio-loud quasars with elliptical galaxies (e.g. Laor 2000), which formally increases the preheating in clusters by up to an order of magnitude (3 keV/particle). However, Ho (2002) proposed that the association of radio-loud sources with ellipticals is driven by a tendency of local galaxies to have nuclei that are both underluminous and radio-loud, in qualitative agreement with predictions of accretion disk theory. Thus, such an association would not hold when ellipticals were star-forming and the galactic wind was driven by star-formation. Indeed, as acknowledged by Laor (2000), Stern et al. (2000) find no evidence that the radio-loud fraction depends on optical luminosity for at .
Another aspect of AGN activity is related to the robustness of our approach, where we use the cluster cores. We can consider Hydra-A as a counter-example, where the AGN activity is among the strongest (McNamara et al. 2000) at the present time, yet its entropy is amongst lowest ( keV cm2). As discussed in McNamara et al. (2000), no significant shock heating is seen in Hydra-A. The reason is that the typical kinetic energy associated with the observed AGN activity in clusters centers is on the level of ergs/s (Böringer et al. 2002), while to substantially change the entropy of the central gas mass of M⊙, typical of cluster cores, it requires kinetic input from AGN of ergs/s. Since the abundance of hot clusters is Mpc-3 (Reiprich & Böhringer 2002), to systematically change the entropy of the cluster cores it would require an AGN activity three orders of magnitude higher than the Mpc-3 maximal volume density of AGNs with ergs/s, as observed at high redshift. Note that AGNs of such luminosity are capable of completely ionizing the torus and could not be hidden from the observer (Nandra et al. 1995).
The last possible source of systematics we consider is the segregation of mass and gas. In fact the gas fractions are similar between groups and clusters at radii of the same enclosed mass and are (Sanderson et al. 2003) at radii of total mass of M⊙. Thus the radii of equal enclosed gas mass and equal total mass agree in this case.
Observation of a systematic increase in the gas mass fraction with the mass of the system (David et al. 1995; Jones, Forman 1999; Sanderson et al. 2002), could be self-consistently explained within the preheating scheme (Babul et al. 2002). However, if reduction in the gas fraction occurs before the shock heating, the entropy resulting from the gravitational heating will be higher. This possibility does not change the consideration of the entropy at radii of equal enclosed mass, since the gas fractions are similar. The gravitational heating fails to reproduce the trend in the entropy at radii of equal enclosed mass, independent of the normalization, thus disfavoring the leading role of the reduction in the gas fraction before the shock in the entropy profiles.
5. Conclusions
We present the temperature, entropy and heavy element abundance measurements for nine groups of galaxies and compare their entropy profiles to a larger sample of groups and clusters of galaxies. We conclude
-
•
Analysis of groups at radii exceeding 150 kpc generally reveals a decrease with radius in the gas temperature. In the best-resolved case, NGC3268, this corresponds to a flat entropy profile at the level of keV cm2.
-
•
Comparison of the scaled entropy at an overdensity of 500 between groups and clusters, still reveals deviations, that require a high level of preheating ( keV cm2).
-
•
Comparing the entropy in groups and clusters at radii with a similar enclosed mass (chosen as M⊙), we conclude that the entropy of the preheated gas does not exceed keV cm2. Thus, we establish a ceiling for the preheating entropy.
-
•
Comparing our results to the prediction of structure formation, we find that accretion of the gas preheated to keV cm2 did not occur before a redshift of 3.5, but is typical of accretion for redshifts below 2. Thus, not only the metal enrichment of clusters is associated with bulges, but also the timing of the preheating suggests the dominant role of bulges in the feed-back process.
-
•
If an increase in the level of preheating is due to secular star-formation activity, duration for energy ejection is constrained to a narrow time interval (redshifts 2–3.5). Distribution of the level of preheating cannot result from the progressive release of SN energy from galaxies, but can be produced by the nearly instantaneous release of SN energy into a density gradient.
-
•
Assuming an injection (or star-formation) redshift of 3.5 and scaling the feed-back by the observed metal content in groups and clusters of galaxies, (0.4 keV/particle in groups, 1.2 keV/particle in clusters), the typical overdensity of gas receiving the preheating must be below 5 for outskirts of groups and 5–30 for cluster cores.
-
•
Using the luminosity function of AGNs, we show that AGNs cannot be the dominant source of the preheating. A concentration of obscured AGNs at low redshift does not support the suggestion of an unseen growth in black-hole masses.
-
•
The "energy crisis", related to the preheating with a limited source of energy, such as SNe, is solved in our approach by allowing the high-density regions (overdensities higher than 50 at redshift of 3.5) to cool out and form stars, while we are able to preheat the dominant gas fraction which resides at low densities.
Acknowledgments
AF thanks Andrey Doroshkevich for communicating the idea of using Lagrangian units in entropy studies, Paolo Tozzi for helpful referee report, Stefano Borgani, Richard Bower, Michael Loewenstein and Chris Metzler for discussion of effects of star formation on the observed entropy level, Arif Babul for useful comments on the manuscript, Guenther Hasinger for enlightening discussion on AGNs. Simulations required for ASCA data reduction were performed using the computer facilities of Astrophysikalisches Institut Potsdam. AF acknowledges receiving the Max-Plank-Gesellschaft Fellowship. The authors acknowledge the devoted work of the ASCA operation and calibration teams, without which this paper would not be possible. This work was partially supported by NASA grant NAG5-3064 and the Smithsonian Institution.
References
- (1) Anders, E. and Grevesse, N. 1989, Geochimica et Cosmochimica Acta, 53, 197
- (2) Babul, A, Balogh, M.L. Lewis, G.F. Poole, G.B. 2002, MNRAS, 330, 329
- (3) Balogh, M.L., Babul, A., Patton, D.R. 1999, MNRAS, 307, 463
- (4) Bender, R, Saglia, R.P., Ziegler, B, Belloni, P, Greggio, L, Hopp, U, Bruzual, G. 1998, ApJ, 493, 529
- (5) Böhringer, H., Matsushita, K., Churazov, E., Ikebe, Y., Chen, Y. 2002, A&A, 382, 804
- (6) Borgani, S., Governato, F., Wadsley, J., Menci, N., et al. 2001, ApJ, 559, L71
- (7) Borgani, S., et al. 2002, MNRAS, accepted (astro-ph/0205471)
- (8) Bower, R. 1996, MNRAS, 288, 355
- (9) Briel, U.G., Henry, J.P. 1995, A&A, 302, 9
- (10) Buote, D.A. 2000, ApJ, 539, 172
- (11) Burke, B.E., Mountain, R.W., Harrison, D.C., Bautz, M.W., Doty, J.P., Ricker, G.R., Daniels, P.J. 1991, IEEE Trans., EED-38, 1069
- (12) Ciotti, L., Ostriker, J.P. 2001, ApJ, 551, 131
- (13) Churazov, E., Gilfanov, M., Forman, W., Jones, C., 1996, ApJ, 471, 673
- (14) David, L.P., Jones, C., Forman, W. 1995, ApJ, 445, 578
- (15) David, L.P., Jones, C., Forman, W. 1996, ApJ, 473, 692
- (16) David, L.P., Nulsen, P.E.J., McNamara, B. R., Forman, W., Jones, C., Ponman, T., Robertson, B., Wise, M. 2001, ApJ, 557, 546
- (17) Davis, D.S., Mulchaey, J.S., Mushotzky, R.F., Burstein, D. 1996, ApJ, 460, 601
- (18) Dos Santos, S., Doré, O. 2002 A&A, 383, 450
- (19) Durret, F., Forman, W., Gerbal, D., Jones, C., Vikhlinin, A. 1998, A&A, 335, 41
- (20) Eke, V.R., Navarro, J.F., Frenk, C.S. 1998, ApJ, 503, 569
- (21) Ellis, R.S.. Smail, I.. Dressler, A., Couch, W.J., Oemler, A., Jr., Butcher, H.. Sharples, R.M. 1997, 483, 582
- (22) Ellison, S. L., Yan, L., Hook, I. M., Pettini, M., Wall, J. V., Shaver, P. 2001, A&A, 379, 393
- (23) Evrard, A.E., Henry, J.P. 1991, ApJ, 383, 95
- (24) Evrard A.E., Metzler C.A., Navarro J.F., 1996, ApJ, 469, 494
- (25) Fabian, A.C., Iwazawa, K. 1999, MNRAS, 303, L34
- (26) Fabian, A.C. 1999, MNRAS, 308, L39
- (27) Finoguenov, A., Jones, C., Forman, W.R., David, L.P., 1999, ApJ, 514, 844
- (28) Finoguenov, A. and Ponman, T.J. 1999, MNRAS, 305, 325
- (29) Finoguenov, A., David L. P., Ponman T. J. 2000, ApJ, 544, 188; FDP
- (30) Finoguenov, A., Jones, C. 2000, ApJ, 539, 603
- (31) Finoguenov, A., Arnaud, M., David, L.P. 2001, ApJ, 555, 191; FAD
- (32) Finoguenov, A., and Jones, C. 2001, ApJ, 547, 107
- (33) Finoguenov, A., Reiprich T., Böhringer H. 2001, A&A, 368, 749
- (34) Finoguenov, A., Matsushita, K., Böhringer, H., Ikebe, Y., Arnaud, M. 2002, A&A, 381, 21
- (35) Jones, C., Forman, W. 1999, ApJ, 511, 65
- (36) Hasinger, G. 2002, astro-ph/0202430
- (37) Heinz, S., Reynolds, C.S., Begelman M.C. 1998, 501, 126
- (38) Hickson, P. 1982, ApJ, 255, 382
- (39) Ho, L.C. 2002, ApJ, 564, 120
- (40) Huchra, J.P., Geller, M.J. 1982, ApJ, 257, 423
- (41) Huchra, J.P., Henry, J.P., Postman, M., Geller, M.J. 1990, ApJ, 365, 66
- (42) Kaastra, J. S., Ferrigno, C., Tamura, T., Paerels, F. B. S., Peterson, J. R., Mittaz, J. P. D. 2001, A&A, 365, L99
- (43) Kauffmann, G. 1995, MNRAS, 274, 153
- (44) Lacey, C., Cole, S. 1993, MNRAS, 262, 627
- (45) Laor, A. 2000, ApJ, 543, L111
- (46) Larson, R.B., Dinerstein, H.L. 1975, PASP, 87, 911
- (47) Liedahl, D.A., Osterheld, A.L., and Goldstein, W.H. 1995, ApJ, 438, L115
- (48) Lloyd-Davies, E.J., Ponman, T.J., Cannon, D.B. 2000, MNRAS, 315, 689
- (49) Loewenstein, M. 2000, ApJ, 532, 17
- (50) Markevitch, M., et al. 2000, ApJ, 541, 542
- (51) Markevitch, M., Vikhlinin, A. 2001, ApJ, 563, 95
- (52) Markevitch, M. 2002, in Proc. of Taiwan Conference on Clusters
- (53) Matsushita, K. 1998, PhD thesis, University of Tokyo
- (54) Matsushita, K. 2001, ApJ, 547, 693
- (55) Matsushita, K., Belsole, E., Finoguenov, A., Böringer, H. 2002, A&A, 386, 77
- (56) McCarthy, I.G., Babul, A., Balogh, M.L. 2002, ApJ, accepted (astro-ph/0203189)
- (57) McNamara, B.R., Wise, M., Nulsen, P.E.J., David, L.P., Sarazin, C.L. 2000, ApJ, 534, L135
- (58) Merritt, D., Ferrarese, L. 2001, preprint astro-ph/0107134
- (59) Mewe, R., Gronenschild, E.H.B.M., and Oord, G.H.J. 1985, A&AS, 62, 197
- (60) Mewe, R., Kaastra, J. 1995, Internal SRON-Leiden report
- (61) Miyaji, T., Hasinger, G. and Schmidt, M. 2000, A&A, 353, 25
- (62) Molendi, S., and Gastaldello, F. 2001, A&A, 375, L14
- (63) Mushotzky, R.F., Loewenstein, M., Arnaud, K.A., Tamura, T., Fukazawa, Y., Matsushita, K., Kikuchi, K., Hatsukade, I. 1996, ApJ, 466, 686
- (64) Nakazawa, K., Makishima, K., Fukazawa, Y., Tamura, T. 2000, PASJ, 52, 623
- (65) Nandra, K., Fabian, A. C., Brandt, W. N., Kunieda, H., Matsuoka, M., Mihara, T., Ogasaka, Y., Terashima, Y. 1995, MNRAS, 276, 1
- (66) Pierpaoli, E., Scott, D., White, M. 2001, MNRAS, 325, 77
- (67) Pietsch, W., Trinchieri, G., Arp, H., Sulentic, J.W. 1997, A&A, 322, 89
- (68) Ponman, T.J., Allan, D.J., Jones, L.R., Merrifield, M., McHardy, I.M., Lehto, H.J., Luppino, G.A. 1994, Nature, 369, 462
- (69) Ponman, T.J., Cannon, D.B., Navarro, J.F. 1999, Nature, 397, 135; PCN
- (70) Pratt, G., Arnaud, M., Aghanim, N. 2001, preprint astro-ph/0105431
- (71) Press, W.H., Teukolsky, S.A., Vetterling, W.T., Flannery, B.P. 1992, Numerical recipes in FORTRAN
- (72) Reiprich, T.H., Böhringer, H. 2002, ApJ, 567, 716
- (73) Rosati, P., Tozzi, P., Giacconi, R., Gilli, R., Hasinger, G., Kewley, L., et al. 2002, ApJ, 566, 667
- (74) Sanderson, A.J.R., Ponman, T.J., Finoguenov, A., Lloyd-Davies, E.J., Markevitch, M. 2002, MNRAS, submitted
- (75) Sanderson, A.J.R., et al. 2003, MNRAS, in preparation
- (76) Silk, J., Rees, M.J. 1998, A&A, 331, L1
- (77) Snowden, S.L., McCammon, D., Burrows, D.N. and Mendenhall, J.A. 1994, ApJ, 424, 714
- (78) Stern, D., Djorgovski, S.G., Perley, R.A., de Carvalho, R.R., Wall, J.V. 2000, AJ, 119, 1526
- (79) Tamura, T., Bleeker, J.A.M., Kaastra, J.S., Ferrigno, C., Molendi, S. 2001, A&A, 379, 107
- (80) Tanaka, Y., Inoue, H., and Holt, S.S. 1984, PASJ, 46, L37
- (81) Tozzi, P., Scharf, C., Norman, C. 2000, ApJ, 542, 106
- (82) Tozzi, P., Norman, C. 2001, ApJ, 546, 63
- (83) Trinchieri, G., Fabbiano, G., Kim, D.-W. 1997, A&A, 318, 361
- (84) Truemper, J. 1983, ASR, 2, 241
- (85) Vikhlinin, A., Forman, W., Jones, C. 1999a, ApJ, 525, 46
- (86) Vikhlinin, A., McNamara, B.R., Hornstrup, A., Quintana, H., Forman, W., Jones, C., Way, M. 1999b, ApJ, 520, L1
- (87) Vikhlinin, A., Markevitch, M., & Murray, S. S. 2001, ApJ, 551, 160
- (88) Voit, G.M., Bryan, G.L. 2001, Nature, 414, 425
- (89) Wu, K.K.S., Fabian, A.C., Nulsen, P.E.J. 2000, MNRAS, 318, 889
- (90) Yamada, M., Fujita, Y. 2001, ApJ, 553, L145
A. Rescaling the entropy from gravitational heating
The scaling of the entropy, chosen in Fig.3 (right) accounts for the increasing strength of the shock with the cluster temperature. To scale the theoretical prediction for the shock heating (Eke, Navarro, Frenk 1998; PCN), stated at , we rescale the entropy to the radius of the overdensity of 500, using the (such entropy scaling on radius is also suggested in Tozzi & Norman 2000), , found in the same simulations (Eke, Navarro, Frenk 1998) and use the relation of Evrard et al. (1996) to consistently remove the entropy scaling on temperature. We scale the prediction to , and account for the fact that in the low density Universe, the shock occurs at lower overdensity and is even lower when lambda is taken into account (100 compared to 178, Pierpaoli, Scott, White 2001), so the shock temperature is lower, but the density is even lower. We obtain
| (1) |
where is in units of M⊙.
Compared to the original
| (2) |
Contribution of various scaling are following
| (3) |
| (4) |
where the PCN scaling of resulting from is balanced by the scaling coming from .
| (5) |
In Fig.3 (right) we show the prediction for shock heating and include the influence in the redshifts of cluster formation ( in CDM, while we use a prescription for density and virial overdensity evolution in CDM).
B. Heavy element abundance determination
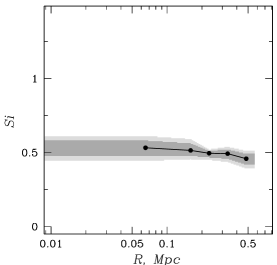
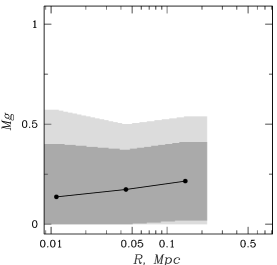
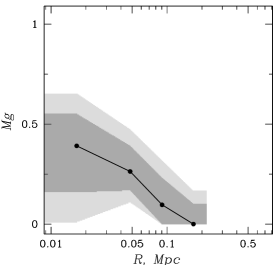
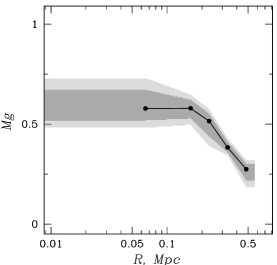
All abundances are given relative to the solar photospheric values in Anders & Grevesse (1989). The abundances of He and C are fixed to their solar values. The remaining elements are combined into four groups for fitting: Mg; Si; S and Ar; and Ca, Fe, and Ni. Large systematic uncertainties in the ASCA SIS at low energies prevent us from determining the O abundance.
A specific problem in the analysis of this sample, compared to the cluster samples of FAD and FDP, is the low signal-to-noise ratio for most of these groups. Given the spectral shape for 1 keV plasma, in most of the systems, no continuum is detected above 2 keV in the outer annuli. This limits the S abundance determination to only a few systems (NGC2300, NGC507 and NGC3268) and increases the uncertainties in the measurement of the Si abundance. Low signal-to-noise also makes the Mg abundance determination difficult, although temperature and Fe abundance determinations are robust.
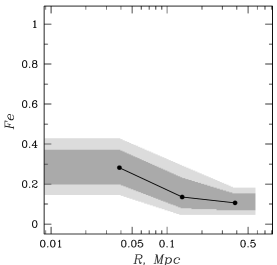
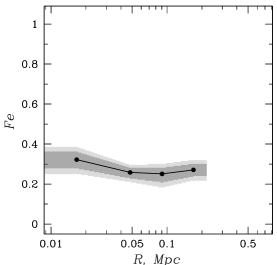
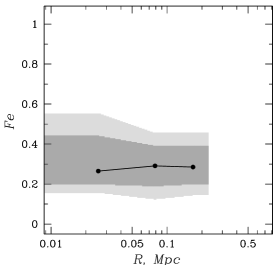
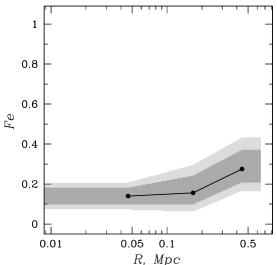
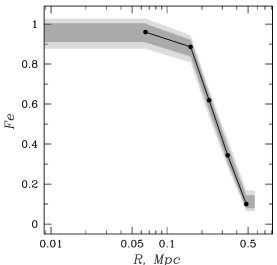
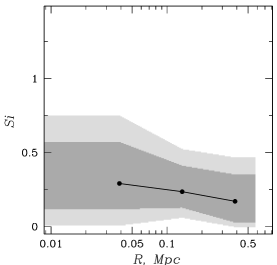
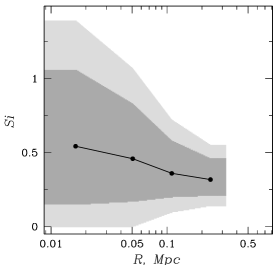
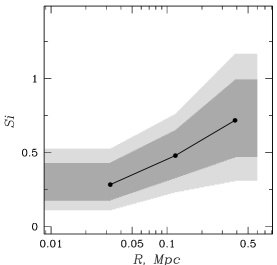
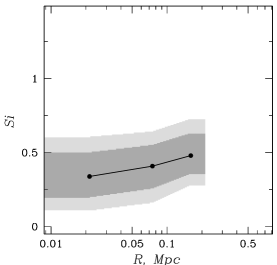
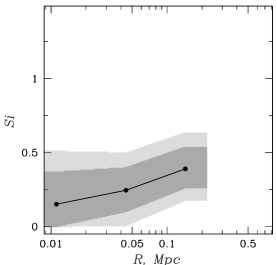
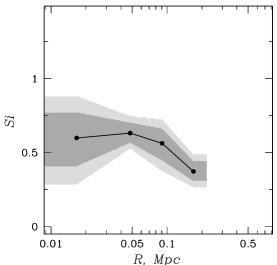
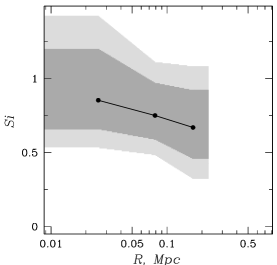
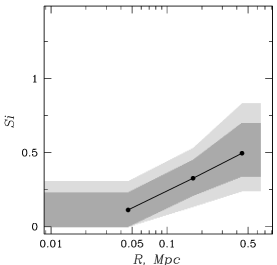
Heavy element abundance profiles are shown in Figs.7–10. Like the temperature, elemental abundance profiles evolve with radius from stellar mass loss values to intragroup medium values, as indicated by an increase with radius in the gas-to-light ratio. Later types of the chemical enrichment are given preference in the (central) zones with low gas-to-light ratios, characterized by the dominance of SNe Ia in the Fe production.
With the possible exception of the Mg abundance in NGC3268, the observed heavy element abundance profiles can be understood within the framework developed in FDP, FAD and Finoguenov et al. (2002). Groups are expected to have a lower abundance of SN II products as well as prevalence of SN Ia in the Fe production, related to low gas fraction in groups. The high gas temperature in NGC3268 causes the Mg measurements to be compromised (Mushotzky et al. 1996). This is further complicated by the strong temperature gradient in NGC3268, which, for the abundance determinations of light elements could not be sufficiently resolved in our data. Thus a confirmation of the Mg abundance profile requires observations with higher spatial resolution, such as XMM-Newton. Given the low X-ray luminosities of the systems in this study, determination of the central elemental abundance needs much higher spatial resolution in order to illuminate contributions from galactic point sources, a central AGN and a possible diffuse hard source (Finoguenov, Jones 2001). We therefore caution the reader about the limitations of our abundance results in the central spatial bins.
Determination of the element abundance, characteristic of the elliptical galaxies has raised a problem when compared to optical data and raised controversy among the X-ray studies (Buote 2000, FDP). Element abundance gradients, reported here, are at least partly due to transition between the galaxy ISM and intragroup gas. While a number of pitfalls exist in determining of the element abundance for ellipticals from X-rays (Finoguenov et al. 2002), abundance determination, corresponding to the intragroup gas is robustly determined with ASCA data.
NGC5129 IC4296 NGC4325
NGC7619 NGC2300 NGC507
NGC2563 NGC6329 NGC3268
NGC5129 IC4296 NGC4325
NGC7619 NGC2300 NGC507
NGC2563 NGC6329 NGC3268
NGC2300 NGC507 NGC3268
NGC2300 NGC507 NGC3268
| Annulus (′) | kT, keV | S, keV cm2 | ||
|---|---|---|---|---|
| NGC5129 | ||||
| 7—15 | 0.620 (0.58–0.65) | 0.507 (0.31–0.69) | 0.193 (0.17–0.21) | |
| 3.2—7 | 1.120 (1.00–1.23) | 0.465 (0.37–0.54) | 0.240 (0.15–0.33) | |
| 1.5—3.2 | 0.993 (0.94–1.03) | 0.436 (0.32–0.54) | 0.299 (0.26–0.34) | |
| 0—1.5 | 0.914 (0.87–0.94) | 0.443 (0.25–0.63) | 0.423 (0.37–0.45) | |
| IC4296 | ||||
| 7—15 | 0.931 (0.83–1.01) | 0.318 (0.21–0.46) | 0.056 (0.03–0.09) | |
| 3.2—7 | 1.151 (1.03–1.34) | 0.360 (0.20–0.58) | 0.323 (0.25–0.44) | |
| 1.5—3.2 | 1.110 (1.02–1.32) | 0.459 (0.17–0.83) | 0.556 (0.42–0.74) | |
| 0—1.5 | 0.669 (0.61–0.72) | 0.543 (0.15–1.06) | 0.687 (0.46–1.03) | |
| NGC4325 | ||||
| 4—14 | 0.960 (0.83–1.16) | 0.718 (0.47–0.99) | 0.112 (0.04–0.18) | |
| 1.5—4 | 1.244 (1.12–1.40) | 0.480 (0.33–0.65) | 0.244 (0.16–0.37) | |
| 0—1.5 | 0.901 (0.88–0.93) | 0.284 (0.18–0.43) | 0.296 (0.25–0.38) | |
| NGC7619 | ||||
| 5—10 | 1.023 (0.98–1.07) | 0.480 (0.36–0.63) | 0.209 (0.18–0.25) | |
| 2—5 | 1.007 (0.71–1.28) | 0.409 (0.26–0.55) | 0.212 (0.08–0.34) | |
| 0—2 | 0.806 (0.77–0.84) | 0.339 (0.20–0.50) | 0.241 (0.20–0.28) | |
| NGC2300 | ||||
| 6—20 | 1.215 (1.11–1.35) | 0.390 (0.26–0.54) | 0.061 (0.03–0.10) | |
| 2—6 | 1.143 (0.92–1.38) | 0.246 (0.10–0.40) | 0.101 (0.02–0.20) | |
| 0—2 | 0.819 (0.75–0.88) | 0.152 (0.00–0.37) | 0.139 (0.09–0.21) | |
| NGC507 | ||||
| 4.3—8 | 1.480 (1.36–1.63) | 0.373 (0.31–0.44) | 0.271 (0.24–0.30) | |
| 2.3—4.3 | 1.293 (1.11–1.55) | 0.563 (0.45–0.66) | 0.251 (0.21–0.28) | |
| 1.2—2.3 | 1.173 (1.07–1.33) | 0.632 (0.57–0.70) | 0.258 (0.23–0.28) | |
| 0—1.2 | 0.772 (0.68–0.85) | 0.599 (0.41–0.77) | 0.322 (0.28–0.36) | |
| NGC2563 | ||||
| 4.2—9 | 1.441 (1.34–1.60) | 0.670 (0.46–0.92) | 0.285 (0.20–0.39) | |
| 2—4.2 | 1.367 (1.22–1.58) | 0.751 (0.59–0.97) | 0.291 (0.19–0.39) | |
| 0—2 | 0.983 (0.88–1.06) | 0.854 (0.66–1.20) | 0.265 (0.20–0.44) | |
| NGC6329 | ||||
| 5.3—14 | 1.485 (1.30–1.72) | 0.496 (0.34–0.70) | 0.275 (0.21–0.37) | |
| 2—5.3 | 1.600 (1.36–1.86) | 0.327 (0.21–0.45) | 0.156 (0.10–0.24) | |
| 0—2 | 1.041 (0.98–1.09) | 0.113 (0.00–0.23) | 0.140 (0.10–0.18) | |
| NGC3268 | ||||
| 24.2—35 | 1.721 (1.60–1.77) | 0.459 (0.42–0.49) | 0.100 (0.08–0.14) | |
| 16.7—24.2 | 2.195 (2.09–2.28) | 0.493 (0.46–0.52) | 0.344 (0.31–0.39) | |
| 11.6—16.7 | 2.588 (2.53–2.70) | 0.496 (0.47–0.51) | 0.619 (0.57–0.65) | |
| 8—11.6 | 2.700 (2.60–2.79) | 0.515 (0.48–0.56) | 0.886 (0.84–0.92) | |
| 0—8 | 2.625 (2.53–2.71) | 0.533 (0.48–0.58) | 0.960 (0.91–1.00) | |
-
†
Definition of the solar abundance units is 3.55 and 4.68 for the number abundance of Si and Fe relative to H, respectively. Errors are given at 68% confidence level (see text for further details). MEKAL plasma code is used for spectral fitting.