The Mass Function of the Arches Cluster from Gemini Adaptive Optics Data
Abstract
We present the mass function (MF) of the Arches cluster obtained from ground-based adaptive optics data in comparison with results derived from HST/NICMOS data. A MF slope of is obtained. Both datasets reveal a strong radial variation in the MF, with a flat slope in the cluster center, which increases with increasing radius.
Max-Planck-Institute for Astronomy, Heidelberg, Germany European Southern Observatory, Garching, Germany
Max-Planck-Institute for Astronomy, Heidelberg, Germany
European Southern Observatory, Garching, Germany
Space Telscope Science Institute, Baltimore, USA
1. Introduction
The Arches cluster is one of the most massive young star clusters found in the Milky Way. The total stellar mass is estimated to be , with a central stellar density of (Figer et al. 1999). Located at a projected distance of only 25 pc from the Galactic Center (GC), it evolves under extreme physical conditions. As the formation of massive stars () is proposed to be strongly dependent on high stellar and gas densities (Behrend & Maeder 2001, Bonnell et al. 1998), star clusters close to the GC are important test beds for star formation (SF) scenarios in dense regions. Displaying the highest stellar density found in a massive young cluster (YC) in the Milky Way, the Arches cluster is a unique object for the comparison with massive SF models. Due to the proximity to the GC, strong tidal forces act towards the disruption of the cluster entity, causing the timescale for dynamical evolution to be short, which may lead to the dissolution of the cluster within (Kim et al. 1999, Portegies Zwart et al. 2002). With an age of only Myr (Figer et al. 2002, in prep.), the stellar population of the Arches cluster should be mostly unaffected by stellar evolution, but the spatial appearance of the cluster should reflect the fast dynamical evolution.
2. Observations
We analyse high-resolution adaptive optics (AO) and -band observations of the Arches cluster center obtained during the Gemini North science verification111The Gemini North science verification data are publicly available at http://www.gemini.edu (SV) with the University of Hawai’i AO system Hokupa’a (Graves et al. 2000). These data are compared to HST/NICMOS observations of the same field obtained by Figer et al. (1999). In uncrowded regions, the spatial resolution and limiting magnitudes in both datasets are comparable given a 3 to 4 times longer integration time in and , respectively, for the Gemini observations. In crowded regions, the AO data are limited by uncompensated seeing haloes from bright stars caused by the low Strehl ratio of only a few percent in the Gemini SV data. These haloes locally decrease the detection efficiency of faint sources. Evidence for this is seen at the faint end of the colour-magnitude diagrams and in the MF of the dense cluster center.
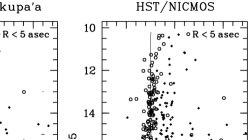
3. Colour-Magnitude Diagrams
The colour-magnitude diagrams (CMDs) are shown in Fig. 1. The dominant feature in the CMDs is the Arches main sequence (MS). Due to the low Strehl ratio in the Gemini data, the upper part of the MS, corresponding to the bright population in the cluster center, appears less confined than in the NICMOS CMD. The fainter stars, not detected in the cluster center due to crowding, show a large scatter towards redder colours, which is caused by a strong colour gradient observed over the Arches field.
4. Results
4.1. Colour Gradient
The colour trend is apparent in both datasets, with increasingly red stellar colours observed at increasing radii (Fig. 2). The change in corresponds to an increase in visual extinction of mag (, Rieke & Lebofsky (1985)). The well confined main sequence at the bright end of the CMD shows that the innermost cluster center (, 0.2 pc at 8 kpc distance) is unaffected by this colour trend. This suggests that the remaining dust and gas has been expelled from the cluster center by winds and/or photoevaporation from the massive stars.
4.2. Mass Function
After correction for the extinction variation, a 2 Myr isochrone from the Geneva basic set of stellar evolution models (Lejeune & Schaerer 2001) has been used to transform -band magnitudes into stellar masses. The resulting MF (Fig. 3) displays a slope of in the mass range in the Gemini as well as the HST dataset. This slope is flatter than the Salpeter slope of , often assumed to be universal in young star forming regions. When neglecting the colour trend, we derive a MF slope as flat as . This clearly shows that the changes in extinction in SF regions are not negligible when deriving mass functions. The flat MF observed in Arches indicates an overdensity of high-mass stars as compared to other SF regions, thereby supporting models predicting enhanced high-mass SF in dense regions.
We have analysed the stellar population at different radii from the cluster center to derive the radial variation in the MF (Fig. 4). The MF slope appears very flat in the cluster center, where stellar and gas densities are highest, and increases with increasing radius. While mainly massive stars are found in the central part of Arches, an increasing number of faint, low-mass stars is found in the cluster outskirts, indicating mass segregation. To exclude that the derived variation is due to crowding, incompleteness simulations have been performed in each radial bin, shown as dotted lines in Figs. 3 and 4. Although incompleteness begins to affect the MF earlier in the cluster center (), the corrected MF remains very flat for . From the distribution of stellar masses, we can obtain a rough estimate of the relaxation timescale, , where is the mass within the half-mass radius , the characteristic mass, and N the number of stars (Binney & Tremain 1987). We obtain and observe as a lower limit to the total mass. The median mass within is measured to be . Assuming a total mass of at least leads to . A characteristic mass of , more typical for SF regions, yields . With being on the same order of magnitude as the age of Arches, it is impossible to discrimate between primordial and dynamical mass segregation.

5. Summary
The radial variation in the MF of the Arches cluster as well as the flat integrated mass function support massive cluster and star formation models, suggesting high-mass stars to form in dense cluster environments. Although the radial variation in the MF strongly suggests mass segregation in Arches to be present, the short dynamical timescales, strongly influenced by the GC tidal field, prohibit discrimination between primordial and dynamical segregation effects.
The close similarity of the mass functions obtained from the Gemini AO and the HST datasets reveal that high-resolution ground-based AO data are capable to produce comparable physical results as space-based observations - in particular in dense regions where spatial resolution is essential.
Acknowledgments.
Based on observations obtained with the Gemini North telescope and HST.
References
Behrend, R., & Maeder, A. 2001, A&A, 373, 190
Binney, J., & Tremaine, S. 1987, Galactic Dynamics, Princeton University Press, 514
Bonnell, I. A., Bate. M. R., & Zinnecker, H. 1998, MNRAS, 298, 93
Figer, D. F., Kim, S. S., Morris, M., et al. 1999, ApJ, 525, 750
Graves, J. E., Northcott, M. J., Roddier, F. J., et al. 2000, SPIE, 4007, 126
Kim, S. S., Figer, D. F., Lee, H. M. & Morris, M. 2000, ApJ, 545, 301
Lejeune, T., & Schaerer, D. 2001, A&A, 366, 538
Portegies Zwart, S. F., Makino, J., McMillan, S. L. W.,& Hut, P. 2002, ApJ, 565, 265
Rieke, G. H., & Lebofsky, M. J. 1985, ApJ, 288, 618