BeppoSAX observations of the three Gamma-ray pulsars PSR B065614, PSR B105552 and PSR B170644
We report the results of the observations of the three -ray pulsars PSR B065614, PSR B105552 and PSR B170644 performed with BeppoSAX. We detected a pulsed emission only for PSR B105552: in the range 0.1 – 6.5 keV the pulse profile is sinusoidal and the statistical significance is . The pulsed fraction was estimated 0.640.17. This pulsation was detected also at energies greater than 2.5 keV suggesting either a non-thermal origin or a quite high temperature region on the neutron star surface. Spectral analysis showed that only the X-ray spectrum of PSR B170644 can be fitted by a single power–law component, while that of PSR B105552 requires also a blackbody component ( keV) and that of PSR B065614 two blackbody components (, keV).
Key Words.:
stars: neutron - stars: pulsars: general - stars: pulsars: individual: PSR B065614, PSR B105552, PSR B1706 - X-rays: stars1 Introduction
The study of the X-ray emission from -ray pulsars is important to gain more information about the acceleration site of particles and the high energy emission processes in the magnetosphere of these sources. Several models predict the production of a huge number of secondary electron-positron pairs generated by the interactions of primary high energy curvature photons with the intense magnetic field. These pairs are expected to radiate X rays via synchrotron and inverse Compton mechanisms. This is not the only important emission processes of X-ray photons: thermal (blackbody) radiation from the polar caps, likely heated by the impinging of high energy particles, can also be quite efficient in this energy band. Finally, in the case of young pulsars, X rays can be emitted in a compact synchrotron nebula surrounding the neutron star. Several spectral components are then expected, likely characterized by different time modulation properties.
In this work we present the results of the spectral analysis in the energy interval 0.1 to 10 keV of three pulsars PSR B065614, PSR B105552 and PSR B170644, detected in the rays by EGRET–CGRO, and observed by the Italian-Dutch satellite BeppoSAX. Only for one of them (PSR B105552) we were able to detected pulsation, while for the other two a non modulated signal was observed.
PSR B065614 ( s, yr) was discovered by Manchester et al. (1978) and its pulsed optical emission was detected by Shearer et al. (1997) and Pavlov, Welty & Cordova (1997). In the X-ray band a pulsed signal at the radio period was observed by Cordova et al. (1989) and -ray detection in the EGRET band has been reported by Ramanamurthy et al. (1996). ROSAT-PSPC observations (Finley et al. 1992) showed that the 0.1–2.4 keV spectral distribution can be well fitted by two blackbodies or by a blackbody plus a power law. Greiveldinger et al. (1996), on the basis of ASCA and ROSAT data, proposed a three component model (two blackbodies plus a power law), while Wang et al. (1998) found that only two blackbodies without a power law are sufficient to have a satisfactory spectral fit.
The middle-aged pulsar PSR B105552 ( s, yr) was discovered by Vaughan & Large (1972). X-ray emission was first observed by Chen & Helfand (1983) with the Einstein Observatory and subsequently by Brinkmann & Ögelman (1987) with EXOSAT and by Ögelman & Finley (1993) with ROSAT who detected a nearly sinusoidal pulsation at energies up to 2.4 keV. The X-ray spectrum is complex and at least two components are necessary to achieve an acceptable fit: one is a blackbody while the other is not safely established and can be either a power law or another blackbody with higher temperature. Greiveldinger et al. (1996) prefer the two blackbody spectrum, with temperatures of K and K; the power-law component would have a photon index of 3–4 larger than the values measured in other pulsars. At variance, Wang et al. (1998) give a flatter power-law fit with an index of 1.50.3. The pulsed emission above 100 MeV was first reported by Fierro et al. (1993) and a comprehensive analysis of its high energy emission is given by Thompson et al. (1999). The pulse profile shows two peaks with phase separation of 0.2 and the spectrum is rather hard with a photon index of 1.580.15 below 1 GeV. A study of the surrounding field and sources observed by BeppoSAX, ASCA and ROSAT has been recently presented by Becker et al. (1999) who concluded against evidence for a wind–nebula around the pulsar.
PSR B170644 is a young pulsar with a period of 0.102 s and a spin-down age of yr. It was discovered in the radio band by Johnston et al. (1992) and unpulsed X-ray was first detected by Becker et al. (1995) with ROSAT-PSPC. In the more recent X-ray observations performed with ASCA (SIS+GIS) (Finley et al. 1998) and RossiXTE (Ray, Harding & Strickman 1999) no pulsed emission was detected. SIS and GIS spectra in the (0.5–5) keV range were fitted by a power law with a photon index ranging from 1.6 to 1.9 and column densities of (1.3–2.2) 1021 cm-2, but these values are poorly constrained because of their quite large (1 standard deviation) uncertainties of about 0.3 and 1.3 1021 (and even more), respectively. A spectral fit with the higher column density fixed at 5 1021 cm-2 gave the steeper photon index of 2.3 0.3. A -ray source was detected by COS B (Swanenburg et al. 1981) and the pulsation at energies greater than about 50 MeV was found by EGRET-CGRO (Thompson et al. 1992). An unpulsed source at TeV energies has been detected with the air Cherenkov telescope of the CANGAROO collaboration (Kifune et al., 1995). VLA images by Frail et al. (1994) indicated that this pulsar may be located inside a plerionic nebula; new VLA images (Giacani et al. 2001) clearly shows that the pulsar is surrounded by a syncrotron nebula about 3′′.5 x 2′′.5 in size. Evidence for a X-ray compact nebula (with a radius of about 27”) was also found by Finley et al. (1998) from the analysis of a ROSAT-HRI image. Very recently, using a Chandra-HRC-I observation Gotthelf, Halpern & Dodson (2002) have discovered a pulsed X-ray emission from PSR B170644 with a nearly sinusoidal pulse profile and a pulsed fraction 23%6%. Their spatial analysis provides a clear evidence for an extended emission between 1′′.5 and 20′′ originated in a synchrotron nebula.
2 Observation and Data reduction
The Italian-Dutch X-ray satellite BeppoSAX observed PSR B065614 and PSR B170644 in 1999 while the observation of PSR B105552 was performed in December 1996, when all the three MECS units were working. Table 1 shows the observation log for the three pulsars together with the LECS and MECS exposures.
| Source | Date | Exposure (s) | |||||
|---|---|---|---|---|---|---|---|
| LECS | MECS | ||||||
| PSR B065614 | 9-11 | Mar | 1999 | 34887.5 | 76002.9 | ||
| PSR B105552 | 28-29 | Dic | 1996 | 21818.5 | 55934.6 | ||
| PSR B170644 | 29-31 | Mar | 1999 | 36676.6 | 85554.5 | ||
Standard procedures and selection criteria were applied to the data to avoid the South Atlantic Anomaly, solar, bright Earth and particle contamination using the SAXDAS v. 2.0.0 package. The images in the LECS and MECS show sources at positions fully compatible with the radio coordinates.
In the case of PSR B065614 and PSR B105552, the events for the time and spectral analysis were selected within circular regions, centred at the radio position, with radii of 4’ and 3’ for the LECS and MECS, respectively. These regions contain the 60% of the 0.1–2.0 keV flux in LECS and the 82% of the point source signal in the MECS; larger regions would include a higher background signal lowering the S/N ratio. The background was estimated from annular regions in the same fields and from a collection of bank field images. As it will discussed later, the spectrum of PSR B065614 resulted quite complex and to obtain a more accurate estimate of the various components we need a significant increase of the statistics of the data. We considered, therefore, another observation of this pulsar, performed by ASCA on 1998 October 11 and available from the archive, and joined it to our BeppoSAX data. We used only GIS data for which, after standard selections, the observation time was 153 ks. The spectrum was selected within a circular region of 3 arcmin and the background was accumulated in a source-free region of the field.
The event selection and the local background evaluation for PSR B170644 was not simple because of the presence of the near bright LMXB 4U 170544, which lies close to the edge of the MECS, and just outside the LECS, instrumental field of view. In order to get a reliable evaluation of the local background in the MECS image, we computed the count levels in a series of adjacent small circular regions with a radius of 3 arcmin located along the binary-to-pulsar direction (Fig. 1, upper panel).
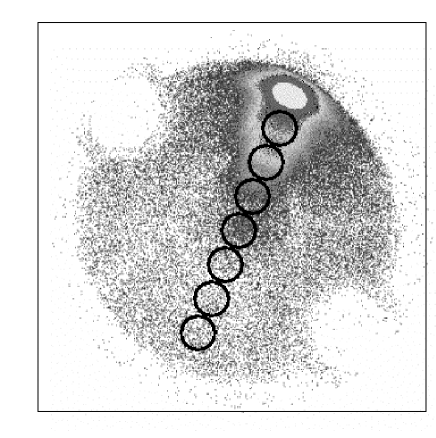

These values were fitted using a simple analytical formula (an exponential plus a constant) excluding the region containing PSR B170644; the value computed at the pulsar position was assumed as the proper background estimate. In the lower panel of Fig. 1, we plotted the best fit model from which the excess corresponding to the circular region including the pulsar is clearly evident. We computed fits correspondent to four energy bands and found that the background at the pulsar spot () can be modeled by a linear combination of the counts in the two nearest regions ():
with the coefficients practically independent of
energy. We used =0.13 to estimate the background in the energy
bins considered for
the spectral analysis.
The same procedure applied to the LECS data, which have poorer
statistics and a wider PSF, shows a detectable signal only in the energy
channels lower than 1.5 keV.
We therefore considered only these photons and included them in a single bin
from 0.1 to 1.5 keV.
3 Timing analysis
We searched for pulsed emission in the MECS from the sources
using the Z2 statistics with one and
two harmonics.
No statistically significant signal was detected for PSR B065614
and PSR B170644, even considering different energy ranges.
A 2 signal is present at the radio frequence in the LECS data
of PSR B065614 below 2 keV, as expected from the pulsed fraction
detected by Finley et al. (1992), while
the 2 upper limit of the pulsed fraction in the energy band 2–10 keV
is 45%.
We stress that a low pulsed signal such that measured by Gotthelf, Halpern & Dodson (2002) in PSR B170644 emission cannot be detected in the BeppoSAX images, where in addition to the contribution of the (unresolved) nebula, there is also the local strong background level due to the near LMXB.
A positive result was indeed obtained for PSR B105552. The Z2 plot gave a peak at the frequency Hz, compatible with that expected by the extrapolation of the ephemeris given by Thompson et al. (1999) equal to 5.07328150 Hz. Because of its rather low flux we limited the analysis to the LECS and MECS events having an energy smaller than 6.5 keV. The statistical significance, in this energy range, derived by the Z2 test for one harmonic corresponds to a chance probability of 6 10-6 (4.5 gaussian standard deviations)
Pulse profiles in the energy bands (0.16.5 keV), (0.12 keV, LECS) and (2.06.5 keV, MECS) are shown in the three panels of Fig. 2: they are roughly sinusoidal, as found in the ROSAT observations (Ögelman & Finley 1993). The significance of these pulsed signals was also estimated with the Z2 test and resulted 2.4 (probability 1.5 10-2) for the LECS data and 2.7 (probability 7.3 10-3) for the MECS. Note also that the phase of the pulsation in the two energy bands coincides. This is therefore the first detection of a pulsed X-ray emission from PSR B105552 at energies above 2.5 keV. To estimate the pulsed fraction in the whole energy band, we considered the approximate sinusoidal shape of the signal, and fitted to these data (upper panel in Fig. 2) a simple sinusoid added to a constant
and evaluated the pulsed fraction as
where is the total number of counts, the background level and the number of bins in the phase histogram. The value was estimated using archive blank fields corrected to match the local background and resulted equal to 294 counts (with a negligible error) while N was 531. The fit was statistically quite good (=53.01.6, =15.02.3) and the resulting pulsed fraction was = 0.640.17.


4 Spectral analysis
4.1 PSR B065614
On the basis of literature results, we used multi-component spectral models to fit the LECS and MECS data. The fits with an absorbed blackbody power law and with two blackbodies did not give acceptable values of the reduced , as shown in the upper section of Table 2, while a fit with a power law plus two blackbodies gave a significant improvement. The absorbing column density resulted equal to (3.1 0.8) 1020 cm-2 and the photon index of the power law equal to 2.08 0.41, while the blackbodies’ parameters were quite poorly constrained because of the limited statistics. We therefore added to the BeppoSAX data the ASCA-GIS observation and performed a joint spectral analysis. Again, any attempt to obtain a good fit with only two components failed to reach a satisfactory reduced , as is apparent from the values given in Table 2 (lower section), and, as found above, an acceptable fit is reached with two blackbody distributions plus a power law. The corresponding best fit values of the parameters together with 1 errors are listed in Table 3. The total spectrum with the residuals and the unfolded model with the relative components are shown in Fig. 3. The present analysis confirms that the X-ray spectrum of this source is quite complex. Our spectral results are generally in acceptable agreement with the previous literature. Typical differences in the blackbody temperatures are of the order of 20 % while a difference of a factor of two is found between our estimate of is and that of Greiveldinger et al. (1996). Similar results have been recently obtained by Zavlin, Pavlov & Halpern (2001, as referenced in Becker & Pavlov 2001) using the same ASCA data added to a ROSAT observation.
| BeppoSAX (LECS+MECS) | |
|---|---|
| Model | (dof) |
| 1) Absorb. Power Law + Black Body | 2.98 (13) |
| 2) Absorb. Black Body + Black Body | 4.10 (12) |
| 3) Absorb. Power Law + 2 Black Body | 1.29 (11) |
| BeppoSAX (LECS+MECS) + ASCA (GIS) | |
| Model | (dof) |
| 1) Absorb. Power Law + Black Body | 1.60 (57) |
| 2) Absorb. Black Body + Black Body | 2.40 (56) |
| 3) Absorb. Power Law + 2 Black Body | 0.97 (55) |
| Parameter (unit) | Value |
|---|---|
| (1020 cm-2) | 3.41.1 |
| kT1 (keV) | (5.890.48)10-2 |
| (erg cm-2 s-1) | (2.67f 0.16)10-11 |
| kT2 (keV) | 0.12 0.01 |
| (erg cm-2 s-1) | (3.49 0.25)10-12 |
| Photon Index | 2.10 0.23 |
| PL Norm. | (6.610.86)10-5 |
| a unabsorbed flux in the 0.1–2 keV band | |


4.2 PSR B105552
The rather low intensity of the pulsed signal and the consequent difficulty in the estimation of the unpulsed level did not allow us to perform the spectral analysis of the pulsed emission. We therefore carried out some fits of spectral models on the total signal. A blackbody law failed to give an acceptable fit (=4.21, 7 d.o.f.), being unable to match the flux above a few keV, also an absorbed power law gave a of 1.86 (7 d.o.f.) corresponding to a chance probability of about 8%. Although this fit cannot be completely rejected, we used various two–component models: two blackbodies and a blackbody plus a power law. Both these models better result than the two others and gave smaller than unity. The estimates of parameters, however, were rather uncertain, in particular for the absorbing column we obtained only upper limits. To obtain more information, we performed other fits with the value fixed at 2 1020 cm-2, compatible with the estimate given by Greiveldinger et al. (1996). Best fit values with 1 errors are listed in Table 4 and the spectral distribution for the blackbody plus a power law is plotted in Fig. 4.
| Two blackbodies | |
|---|---|
| Parameter (unit) | Value |
| kT1 (keV) | (7.80.6)10-2 |
| (erg cm-2 s-1) | (2.30.3)10-12 |
| kT2 (keV) | 0.74 0.14 |
| (erg cm-2 s-1) | (6.71.6)10-14 |
| Blackbody + power law | |
| Parameter (unit) | Value |
| kT (keV) | (7.50.6)10-2 |
| (erg cm-2 s-1) | (2.20.3)10-12 |
| Photon Index | 2.09 0.49 |
| PL Norm. | (3.60.8)10-5 |
| a unabsorbed flux in the 0.1–2 keV band | |
| Pulsar | |||
|---|---|---|---|
| PSR B065614 | 30.50.9 | 1.460.02 | 0.040.01 |
| PSR B105552 | 2.40.3 | 0.820.19 | 0.330.03 |
| PSR B170644 | 1.30.4 | 1.280.07 | 1.120.06 |
| a 0.1–2 keV unabsorbed flux in unit of 10-12 erg cm-2 s-1 | |||
| b 2–10 keV unabsorbed flux in unit of 10-13 erg cm-2 s-1 | |||
| c E 100 MeV flux in unit of 10-6 erg cm-2 s-1 | |||


4.3 PSR B170644
The spectral analysis of the LECS and MECS data confirmed that the spectrum of this source can be well described by a single power law. The fit gave a photon index of 1.69 0.29 and a column density = (3.7 1.5) 1021 cm-2, with a reduced = 1.30 for 15 d.o.f. (Fig. 5). Fixing the value at the ROSAT-PSPC result of 5 1021 cm-2 (Becker et al. 1995), we found a photon index of 1.71 0.12 (reduced = 1.25, 16 d.o.f.), in agreement with the one reported above. To be more confident that our result was independent of the local background, we used different estimates of its intensity and spectrum. These were derived varying the value of within its uncertainty in the model used to fit the LMXB contribution: in all cases we found changes of the best fit spectral parameter values somewhat less than the statistical uncertainties.
We are therefore confident that the above result provides the best available representation of the actual spectral distribution of PSR B170644.

5 Discussion
The main results of the analysis of the BeppoSAX observations of PSR B065614 (in this case also joined to a long ASCA archive observation), PSR B105552 and PSR B170644 presented in this contribution can be summarized as follows.
-
1.
No pulsation above 2 keV at the extrapolated radio periods was detected for PSR B065614 and PSR B170644, whereas a pulsed signal was clearly observed for PSR B105552 up to the energy band 2.0–6.5 keV with the relatively high pulsed fraction of 0.640.17, in agreement with that given by Ögelman & Finely (1993).
-
2.
The spectral distribution of the X-ray emission of PSR B065614, derived from the combined BeppoSAX and ASCA data, is quite complex. Two component models are excluded by the high values and an acceptable fit is given by at least three components, one power law and two blackbodies, as early proposed by Greiveldinger et al. (1996).
-
3.
The X-ray spectrum of PSR B105552 is well fitted by a two component model: a blackbody with a temperature keV and a power law with a photon index of about 2.1. This result does not confirm the very steep power law spectrum found by Greiveldinger et al. (1996), while it agrees with the spectral model given by Wang et al (1998).
We recall however that a two blackbody model gives also an acceptable fit, but a quite high value of keV is necessary.
-
4.
The X-ray spectrum of PSR B170644 is well fitted by a single power law with a photon index of 1.65. This value is compatible with that connecting the radio to X-ray flux (Finley et al. 1998) and seems then to confirm that a large fraction of this radiation originates in the compact synchrotron nebula around the pulsar.
The 0.1–2 keV and 2–10 keV unabsorbed flux values detected by BeppoSAX are summarized in Table 5, together with the E100 MeV fluxes (Hartman et al. 1999) for the three sources. Note that the to X-ray flux ratios are quite different, suggesting that the radiation mechanisms responsible for these emissions are not the same in these pulsars.
X-ray emission from young rotation-powered neutron stars is generally explained either in terms of blackbody radiation from a hot region on the star surface or in terms of non-thermal magnetospheric processes from high-energy electrons and positrons. Furthermore, a non-thermal component can be generated in a surrounding synchrotron nebula. Spectral and phase distributions are useful to distinguish between these different kinds of emission mechanisms.
For PSR B1706, the intense local background and the presence of a nebula do not allow us to detect pulsation. According to the recent results of Gotthelf, Halpern & Dodson (2002) the dominant component originates in the nebula and has a spectral index of 1.34(+0.34,0.20), statistically compatible with that found in our analysis. These authors also found a blackbody component at a temperature of about 1.7 106 K originating from the neutron star, but it is not necessary to fit our data.
The complex spectrum of PSR B065614 requires at least three components, two of them having blackbody energy distributions at temperatures different by a factor of 2. From the measured fluxes of these components, and assuming a distance for the pulsar, one can estimate some interesting quantities like the area of the emitting surface and, when this coincides with the entire neutron star, the stellar radius. Indicating the measured bolometric blackbody flux with , the area of the emitting region is given by
where is the distance to the source and the Stefan-Boltzmann constant. For two blackbody components the ratio between their areas is:
while the stellar radius is given by:
Bolometric fluxes of the soft (1) and hard (2) components can be derived from the (0.1 keV) fluxes given in Table 3, by applying the proper correction factors derived from the integrals of the planckian law, which are 1.144 and 1.022 for the softer and harder components, respectively. We found then , coincident with the result of Greiveldinger et al. (1996). Such a small value implies that the region of the stellar surface emitting the hotter radiation is much less extended than the softer one. The latter can be associated with the cooling emission from the entire neutron star and Eq.(6) can be used to estimate , which for a distance = 0.5 kpc, is 244 km. This value is somewhat larger than the one of Greiveldinger et al. (1996), but agrees within its satistical uncertainty. Our results therefore substantially confirm the previous picture of this pulsar.
We stress that the discrepancy, already noted by Greiveldinger et al. (1996), between the extent of a pure dipolar polar cap containing the open field lines, likely heated by the impact of relativistic particles, and that of the hotter region is still present. The ratio between the dipolar polar cap area to that of the neutron star surface is given by which, considering also a factor of 2 if the spin axis is inclined enough to see both polar caps, is equal to , more than one order of magnitude smaller than the value given above, even taking into account the large uncertainty of the estimate. A possible explanation has been proposed by Wang et al. (1998), who showed that a hot cap larger than the dipolar one can be due to a relevant distorsion of the field lines near the star surface produced by the different motion of inner and outer vortices in the superconducting star core. They give also an estimate of the cap temperature of K in good agreement with our findings.
The nature of the X-ray emission from PSR B105552 is also rather complex. A blackbody component with a temperature of about 9 105 K is well established but with flux lower than that reported by Greiveldinger et al. (1996). Assuming that it is emitted from the entire surface, it is possible to estimate a stellar radius km, about one half the estimate by Greiveldinger et al. (1996) but compatible with that expected for a neutron star, unless the actual source distance would be somewhat smaller than 1 kpc.
Our results show also that the pulsed emission is detectable at energies higher than 2 keV. This finding does not match with a two blackbody model, although statistically acceptable, because it would imply a second emission region at a temperature as high as 8 106 K, about a factor of 6 larger than that found for PSR B065614. The same sinusoidal X-ray pulse shape and phase is observed at energies lower and higher than 2 keV, suggesting a common emission site. We recall that this shape is quite different from that observed in the EGRET range, which has two peaks with a phase separation of 0.2 (Thompson et al. 1999). At variance, a non-thermal emission would be more naturally explained by the model prosed by Wang et al. (1998), where X rays are synchrotron photons emitted by secondary electrons produced in the surrounding of the neutron star by pair absorption of primary curvature -rays from inward-moving high energy particles from the outer gap. In this case a relatively broad pulse profile and pulsed fraction greater than 0.5 are expected; furthermore, the spectrum should have a photon index of 1.5. Our results agree with these requirements, although the observed index is steeper than the model value, but the uncertainty is large enough to make them compatible.
Acknowledgements.
The authors are grateful to Bruno Sacco for his helpful comments. They are also grateful to the referee, J. Halpern, for the useful comments. This work has been partially supported by the Italian Space Agency (ASI).References
- Becker et al., (1995) Becker, W., Brazier, K.T.S., Trümper,J. 1995, A&A, 298, 528
- Becker et al., (1999) Becker, W., Kawai, N., Brinkmann, W., Mignani, R. 1999, A&A, 352, 532
- (3) Becker, W., Pavlov, G. 2001, ”The Century of Space Science”, Editors: Johan Bleeker, Johannes Geiss and Martin Huber, Published by Kluwer Academic Publishers
- Brinkmann, Oegelman (1987) Brinkmann, W., Ögelman, H. 1987, A&A, 182, 71
- Cheng Helfand (1983) Cheng, A.F., Helfand, D.J. 1983, ApJ, 271, 271
- Cordova et al., (1989) Cordova, F.A., Middleditch, J., Hjellming, R.M., Mason, K.O. 1989, ApJ 345, 451
- Fierro et al., (1993) Fierro, J.M., Bertsch, D.L., Brazier, K.T.S., et al. 1993, ApJ, 413, L27
- Finley et al., (1992) Finley, J.P., Ögelman H., Kiziloǧlu, Ü. 1992, ApJ, 394, L21
- Finley et al., (1998) Finley, J.P., Srinivasan, R., Saito, Y., et al. 1998, ApJ, 493, 884
- Frail et al., (1994) Frail, D.A., Goss, W.M., Whiteoak, J.B.Z. 1994, ApJ, 437, 781
- Giacani et al., (2001) Giacani, E.B., Frail, D.A., Goss, W.M., Vieytes, M. 2001, AJ, 121, 3133
- Greiveldinger et al., (1996) Greiveldinger, C., Camerini, U., Fry, W., et al. 1996, ApJ, 465, L35
- Gotthelf et al., (2002) Gotthelf E.V., Halpern J.P., Dodson R. 2002, ApJ, 567, L125
- Hartman et al. (1999) Hartman, R.C., Bertsch, D.L., Bloom, S.D., et al. 1999, ApJS, 123, 79
- Johnston et al., (1992) Johnston S., Lyne, A.G., Manchester, R.N., et al. 1992, MNRAS, 225, 401
- Kifune et al. (1995) Kifune T., Tanimori, T., Ogio, S., et al. 1995, ApJ, 438, 91
- Manchester et al., (1978) Manchester R.N., Lyne, A.G., Taylor, J.H., et al. 1978, MNRAS, 185, 409
- Ogelmanfinley, (1993) Ögelman, H., Finley, J.P. 1993, ApJ, 413, L31
- Pavlov et al., (1997) Pavlov, G.G., Welty, A.D., Cordova, F.A. 1997, ApJ, 489, L75
- Ray et al. (1999) Ray,A., Harding A.K:, Strickman M. 1999, ApJ 513, 919
- Ramanamurthy et al., (1996) Ramanamurthy, P.V., Fichtel, C.E., Kniffen, D.A., et al. 1996, ApJ, 458, 755
- Shearer et al., (1997) Shearer, A., Redfern, R.M., Gorman, G., et al. 1997, ApJ, 487, L181
- Swanenburg et al. (1981) Swanenburg B.N., Bennett, K., Bignami, G.F. et al. 1981, ApJ, 243, 69
- Thompson et al., (1992) Thompson D.J., Arzoumanian, Z., Bertsch, D.L., et al., 1992, Nature 359, 615
- Thompson et al., (1999) Thompson D.J., Bailes M., Bertsch D.L. et al. 1999, ApJ, 513, 297
- Vaughan and Large (1972) Vaughan, A.E., Large,M.I. 1972, MNRAS, 156, 27
- Wang et al, (1998) Wang, F.Y.-H., Ruderman, M., Halpern, J., et al. 1998, ApJ, 498, 373
- (28) Zavlin, V., Pavlov, G.G., Halpern, J. 2001, preprint