Size and Structure of the Narrow–Line Region of Quasars11affiliation: Based on observations with the NASA/ESA Hubble Space Telescope, obtained at the Space Telescope Science Institute, which is operated by AURA, Inc., under NASA contract NAS 5–26555
Abstract
We have observed the narrow–line regions (NLRs) of the seven brightest radio–quiet PG (or BQS) quasars (z 0.5) with the Wide Field and Planetary Camera 2 on board the Hubble Space Telescope (HST). Linear–ramp filters were used to image the [O III] 5007 line emission with 00455–01 pixel resolution. We find that the NLRs are very compact with typical extents of 2″–4″. Two quasars show compact filamentary structures similar to Seyfert NLRs. They may be related to radio outflows. Most interestingly, when including a sample of Seyfert galaxies observed with HST, we tentatively find that the size of the NLR is proportional to the square root of the [O III] luminosity. This is comparable to the scaling found for the size of the broad–line region with continuum luminosity, which has been interpreted in terms of a constant photoionization parameter. The relation determined here connects the NLR of radio–quiet quasars and Seyferts over three orders of magnitude in [O III] luminosity.
1 INTRODUCTION
Quasars are active galactic nuclei (AGN) in which two different regions of ionized gas can be distinguished — the broad–line region (BLR) and the narrow–line region (NLR) which exhibit optical emission lines, kinematically broadened with typical widths of 103-4 km s-1 and 102-3 km s-1, respectively. The optical spectra of quasars resemble those of the less luminous Seyfert galaxies, and it is presumed that most radio–quiet quasars are their more luminous counterparts. The most prominent optical emission lines of the NLR are [O III] 5007 (hereafter referred to simply as [O III]) and H + [N II] 6548,6584.
In the Unified Model of AGN, an optically thick obscuring dust torus is envisioned to encircle the accretion disk (Antonucci, 1993), leading to a so–called “ionization cone” formed by anisotropic escape of ionizing photons (Schulz, 1988; Pogge, 1988, 1989; Storchi–Bergmann et al., 1992). Thus, the NLR is expected to show a specific morphology, which is suited for investigation with the high spatial resolution afforded by the Hubble Space Telescope (HST). Such investigations have been carried out for Seyfert galaxies, revealing highly elongated structures or ionization cones (Capetti et al., 1996; Falcke et al., 1998).
While the NLR in Seyferts is now relatively well studied, there are no comparable studies for the NLR in quasars. By observing quasars we can greatly extend the luminosity range to answer questions such as: Are quasars indeed just scaled–up versions of Seyferts? Does the size of the NLR scale with luminosity? Is this emission–line region possibly affected by radio jets shaping the interstellar medium, or is there a contribution from star formation?
We make a first step in this direction by presenting an HST emission–line imaging survey of a complete sample of the seven brightest [in [O III], Boroson & Green (1992)] radio–quiet quasars from the BQS (Schmidt & Green, 1983; Kellermann et al., 1989) with z 0.5. The sample is given in Table 1. Here we present an investigation of the NLR structure as seen in the [O III] line and discuss the size of the NLR as a function of luminosity.
Luminosity distances for both Seyferts and quasars were calculated by using redshifts relative to the 3K background as derived with the velocity calculator provided by the NASA Extragalactic Database (NED). Throughout this paper we adopt a Hubble constant of = 65 km s-1 Mpc-1 and a homogeneous, isotropic, flat world model, which includes Einstein’s cosmological constant in agreement with recent supernova measurements (Perlmutter et al., 1999): = 1, = 0.35, = 0.05, and = 0.6.
2 OBSERVATION, DATA REDUCTION, & ANALYSIS
2.1 HST Observations
All quasars in our sample were observed with the Wide Field and Planetary Camera 2 (WFPC2) on board HST between January and October 2000. Except for observations of the adjacent continua, we used the linear–ramp filters (LRFs). A description of properties and data reduction of LRF data is given in Falcke et al. (1998).
For our observations, the filters and central wavelengths were chosen to be centered on the redshifted [O III] emission lines. PG0026+129 (catalog ) was the only quasar that could be imaged with the Planetary Camera and its smaller pixel scale of 00455 pixel-1. The other quasar images were taken with the Wide Field Camera (01 pixel-1). Several short integrations of a bright star (V = 11–16) were taken in the LRF at the same position on the chips as the corresponding quasar, to determine the point–spread–function (PSF) for calibration purposes.
To subtract the underlying continuum, images of the adjacent continua were taken in narrow–band filters (F588N: Å, F631N: Å, and F673N: Å), at the same chip position as the LRF images. All observations were split into several integrations to allow for cosmic–ray rejection with integration times chosen to avoid saturation at the position of the central point source.
2.2 Data Reduction & Analysis
All exposures were bias– and dark–subtracted and, except for the LRF images, flat–field corrected by WFPC2 pipeline processing at the Space Telescope Science Institute (STScI). For the LRFs, we used flat fields taken in nearby narrow–band filters. In all cases the different exposures were shifted (using linear interpolation as recommended for subsampled data) by aligning the central intensity peaks of the LRF, continuum, and PSF images, as determined from gaussian–profile fitting. The point–source calculator (as provided by STScI) was used for flux calibration. For subtraction of the continuum and especially the contribution from the unresolved continuum source at the center of the quasar, we used either the continuum images or the PSF star (see Table 1). In one case (PG1012+008 (catalog )), no continuum was detected on the continuum images, and a scaled PSF star was substracted from the LRF image. The scaling was done such that, after subtraction, the central pixel had the same value as the average of the neighbouring pixels. This avoids “holes” in the center and may lead to an underestimate of the [O III] emission. We also had to scale the “continuum” image for PG1049–005 (catalog ) in the same way, as the image was, by accident, not taken in a continuum wavelength range but in the middle of the emission line of [O III] 4959. For PG0157+001 (catalog ) and PG0953+414 (catalog ) the continua were clearly extended compared with that of the PSF star, and the continuum images were used for subtraction. In the three remaining cases (PG0026+129 (catalog ), PG0052+251 (catalog ), and PG1307+085 (catalog )) the continua were not extended, compared with the PSF star, and we subtracted the PSF star, scaled to the flux seen in the continuum image, because of the higher signal–to–noise ratio of the star.
To check how much galaxy line emission or continuum we might be missing by using our short–exposure continuum (or scaled PSF) images, we used broad–band continuum images of the host galaxies of our quasars from Bahcall et al. (1997). The broad–band images were scaled to the appropriate filter width and exposure time of our LRF images and subtracted. We found the same [O III] flux at radii pixels, where the broad–band images were not overexposed, and concluded that, indeed, the host–galaxy continuum contribution to the LRF images was negligible outside the very nucleus. We also performed surface photometry of the continuum–subtracted LRF images and compared the resulting [O III] luminosities (Table 2) with the [O III] magnitudes determined by Boroson & Green (1992) with ground–based spectroscopy in a 6″ 15 extraction aperture. After correcting the luminosity distances for differences in the Hubble constant (a 30% effect) and the world model ( 3%), the difference between the HST imaging and ground–based spectroscopic data scatters within 0.25 mag, consistent with the expected spectrophotometric errors. The evidence suggests that we have not missed any significant extended flux, and that our continuum subtraction is correct.
3 RESULTS
3.1 Photometry & Structure
For each quasar we defined a radius of the NLR in our images at which a 3 –level above background was reached in ring apertures. The surface brightness at that distance was typically 0.3% of central, thereby enclosing more than 98% of the detectable emission. The results of the photometry as well as these radii are given in Table 2. In all cases the NLR was largely concentrated within 2″–4″.
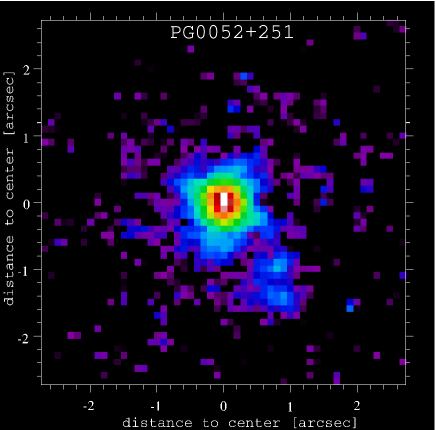
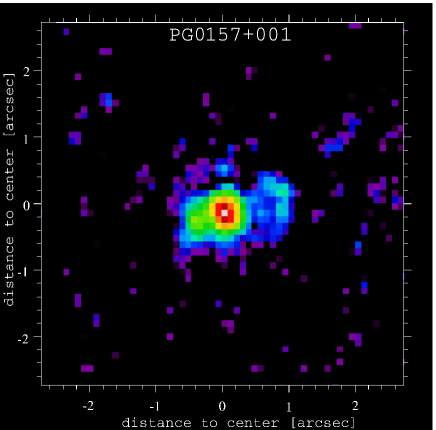
Two quasars show compact filamentary structure as shown in Figure 1. Photometry of these features (PG0052+251 (catalog ): 15 to the south and 08 to the west of the nucleus; PG0157+001 (catalog ): 04 to the north and 1″ to the west of the nucleus), was carried out separately (see Table 2). The feature in PG0052+251 (catalog ) can also be found in the broad–band images of Bahcall et al. (1997) as “knots” and in a radio map from Kukula et al. (1998) (classified as possible core–jet), whereas Miller et al. (1993) do not find a significant radio extension. The “linear” structure of PG0157+001 (catalog ) is coincident with radio features [Kukula et al. (1998) (classified as a double source with radio components on either side of the optical nucleus), Miller et al. (1993)]. A close association between the NLR emission–line morphology and that of the radio emission has already been found for Seyferts (Capetti et al., 1996; Falcke et al., 1998). PG1012+008 (catalog ) and PG0026+129 (catalog ) reveal some extended radio structure (Miller et al., 1993; Kukula et al., 1998), but we do not find extended emission–line features. Five out of the seven quasars are listed in Kukula et al. (1998) with maximum radio angular extents of 024–2″.
3.2 Size as a Function of Luminosity
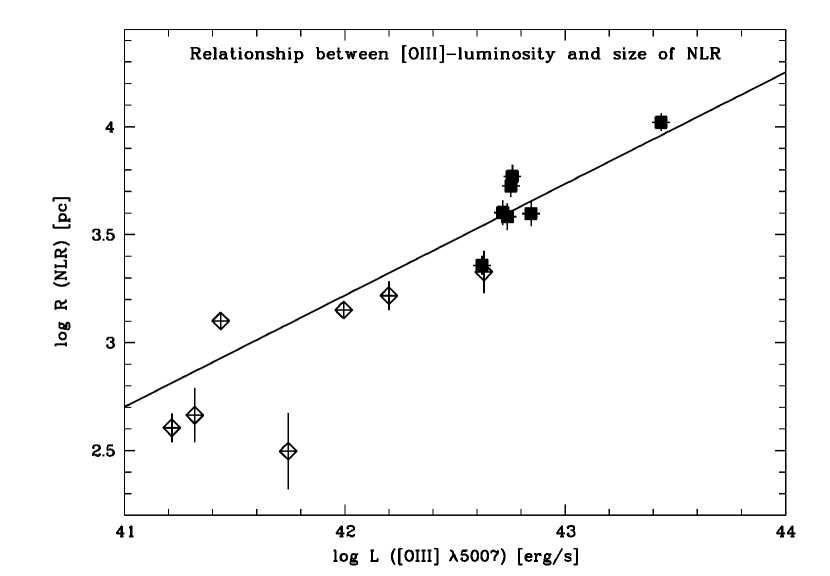
An important question is how the NLR grows as one increases the luminosity of the central engine from Seyfert to quasar luminosities. For that reason we compared the sizes and luminosities of the NLR in our quasar sample with the NLR of a sample of Seyfert 2 galaxies that we have studied earlier. This sample was observed with HST in a very similar fashion, using LRFs and imaging the [O III] emission line (Falcke et al., 1998). In Figure 2 we plot the linear sizes versus the luminosities for the Seyferts and quasars.
The number of sources is of course very limited, but with the addition of the quasars we are probing three orders of magnitude in luminosity. The weighted linear least–square fit is (weight = , = standard error in ; units of and are pc and erg/s, respectively):
| (1) |
with a correlation coefficient (cc) of 0.92 for 14 datapoints (dp). Hence, the size of the NLR seems to scale proportionally with the square root of the [O III] luminosity.
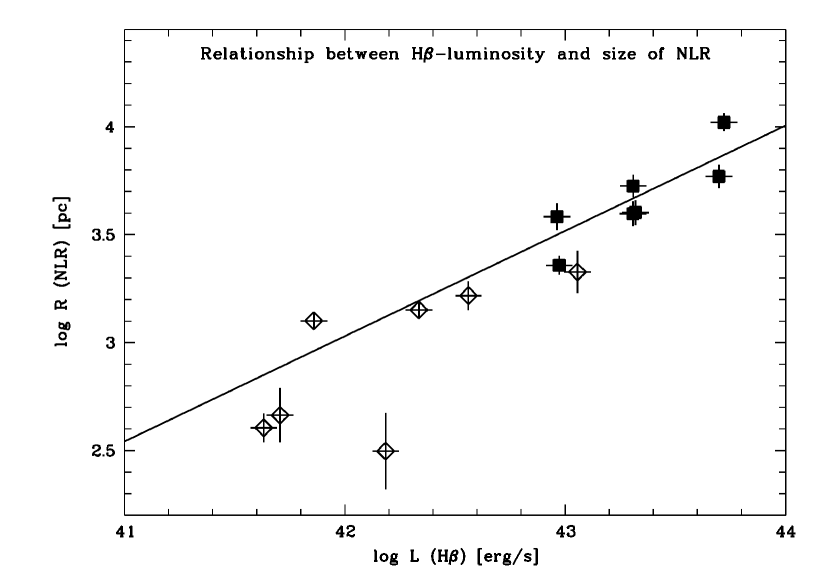
We note that for the quasars alone a similar relation is found, when plotting the NLR size versus the H luminosity (Figure 2, right). With derived by multiplying our with the H/[O III] ratios from Boroson & Green (1992) (see Table 2) we obtain (cc = 0.85, 7 dp)
| (2) |
The average [O III]/H ratio of the Seyferts is 30 times larger than that of the quasars. Since the Seyferts are Type 2 objects, in the framework of the unified model, only a few percent of the total H is visible. Boroson & Green (1992) also found that 3% of the total H flux is visible as the narrow line component. We have thus multiplied the inferred narrow line H luminosities of the Seyferts by a factor of 30 to estimate their total H luminosities, and found that the resulting versus relationship is consistent with an extrapolation to lower luminosity of the relationship found for the quasars. Including both Seyfert and quasar data into a weighted linear least–square fit we obtain (cc = 0.91, 14 dp)
| (3) |
4 DISCUSSION & CONCLUSIONS
We find that the NLRs of seven bright radio–quiet PG quasars are remarkably compact with typical extents of 2″–4″. Hence, detailed imaging of quasar NLRs requires sub–arcsecond resolution. Generally, the structure is relatively symmetric, in agreement with the unified scheme, that predicts a view into the ionization cones of these type 1 objects.
Two quasars exhibit compact filamentary structure like that seen for Seyferts. These structures may be related to radio outflows. This is reminiscent of the situation in many Seyfert galaxies, where radio outflows are morphologically related to the NLR. In three quasars the radio emission is approximately as compact as the NLR, and in all five cases that can be found in literature, the maximum angular extent is in agreement with our compact extents.
The NLR in quasars seems to be consistent with being a scaled–up version of the NLR in Seyferts. In fact, one of the Seyfert 2 galaxies, Mrk 34 (catalog ), has a similar radius and [OIII] luminosity to the quasars, and hence might be considered a “type 2 quasar”. In addition, the size of the NLR seems to scale roughly with the square root of the [O III] luminosity when combining the quasar and Seyfert samples.
The latter result, however, has to be taken with some caution. For one, we have a very limited number of sources available. Especially for quasars, high resolution images of the NLR are extremely scarce, one essentially needs the resolution of HST plus the flexibility of the LRFs to image redshifted emission lines. Second, when comparing the Seyfert 2 and the quasar sample, one needs to consider that, according to the unified scheme, orientation effects might bias the type 2 sample towards somewhat larger sizes. Third, the individual scatter of NLR sizes is relatively large. Fourth, the “size” of the NLR is not a well defined quantity, being dependent on sensitivity and resolution. Nevertheless, given the large span in luminosities, none of the effects is likely to change the results significantly.
Seeking a clue to the origin of this relation, we consider a recombination line like H, rather than [O III], as a tracer of continuum luminosity. The ionization parameter is given by ( rate of H–ionizing photons, = distance between photoionizing source and emission–line clouds). Employing the relation (cgs units; is the covering factor and the recombination coefficients and are taken from Osterbrock (1989) for K) yields a relation for given , , and constant .
The slope in Figure 2 is close to the slope of given by Peterson (2001) for the relationship between BLR size (measured from reverberation mapping) and the continuum–luminosity (at 5100Å). McLure & Jarvis (2002) find an even tighter correlation between BLR radius and 3000Å luminosity, with both correlations being consistent with a relation of the form .
To first order, BLRs and NLRs exhibit similar ionization parameters commonly explained by interaction of clouds with a quasar wind (Schiano, 1986). More recently, Dopita et al. (2002) use radiation–pressure dominated photoionization models to explain a constant ionization parameter (in the range of –2.5 –2). At the outskirts of a NLR, cm-3, , so that efficient [O III] emission comes from regions with , corresponding to an ionizing photon rate photons/(s cm2). Individual values of derived with this scheme are slightly larger than the measured , corresponding to covering fractions 1.
The same average [O III]/H ratio for Seyferts and quasars preserves the slope of the size–[O III] relation for a size–H relation. This corroborates the explanation in terms of the ionization parameter and argues for photoionization as the main underlying process for producing narrow lines.
As pointed out by the referee, the relationship (or ) corresponds to constant [O III] (or H) surface brightness. We are, however, not aware of any other physical, or instrumental, reason why this should be the case, since [O III] is emitted by the whole volume filled with NLR clouds.
Clearly, more HST observations of quasars with lower [O III] luminosity are needed to test the validity of the correlation. We expect fainter [O III] quasars to have even smaller NLRs than the sources presented here and such a program will present an observational challenge for the years to come. Nevertheless, the available data provides the first direct evidence that quasar and Seyfert NLR are related and possibly evolve along a common luminosity–size track determined by photoionization.
References
- Antonucci (1993) Antonucci, R.R.J. 1993, ARA&A, 31, 473
- Bahcall et al. (1997) Bahcall, J.N., Kirhakos, S., Saxe, D.H., & Schneider, D.P. 1997, ApJ 479, 642
- Bergvall et al. (1986) Bergvall, N., Johansson, L., & Olofsson, K. 1986, A&A, 166, 92
- Boroson & Green (1992) Boroson, T.A. & Green, R.F. 1992, ApJS, 80, 109
- Capetti et al. (1996) Capetti, A., Axon, D.J., Macchetto, F., Sparks, W.B., & Boksenberg, A. 1996, ApJ, 469, 554
- Colina et al. (1987) Colina, L., Fricke, K.J., Kollatschny, W., & Perryman, M.A.C. 1987, A&A, 186, 39
- Dopita et al. (2002) Dopita, M.A., Goves, B.A., Sutherland, R.S., Binette, L., & Cecil, G. 2002, preprint (astro–ph0203360)
- Falcke et al. (1998) Falcke, H., Wilson, A.S., & Simpson, C. 1998, ApJ, 502, 199
- Fernandes et al. (2001) Cid Fernandes, R., Heckman, T., Schmitt, H., Delgado, R.M.G., Storchi-Bergmann, T. & 2001, ApJ, 558, 81C
- Kaspi et al. (2000) Kaspi, S., Smith, P.S., Netzer, H., Maoz, D., Jannuzi, B.T., & Giveon, U. 2000, ApJ, 533, 631
- Kellermann et al. (1989) Kellermann, K. I., Sramek, R., Schmidt, M., Shaffer, D. B., & Green, R. 1989, AJ, 98, 1195
- Kukula et al. (1998) Kukula, M.J., Dunlop, J.S., Hughes, D.H., & Rawlings, S. 1998, MNRAS, 297, 366K
- McLure & Jarvis (2002) McLure, R.J. & Jarvis, M.J. 2002, preprint (astro–ph/0204473)
- Miller et al. (1993) Miller, P., Rawlings, S., & Saunders, R. 1993, MNRAS, 263, 425
- Osterbrock (1989) Osterbrock, D.E.O. 1989, Astrophysics of Gaseous Nebulae and Active Galactic Nuclei (Mill Valley, CA: University Science Books)
- Peterson (2001) Peterson, B.M. 2001, preprint (astro–ph/0109495)
- Perlmutter et al. (1999) Perlmutter, S., Aldering, G., Goldhaber, G. et al. 1999, ApJ, 517, 565
- Pogge (1988) Pogge, R.W. 1988, ApJ, 328, 519
- Pogge (1989) Pogge, R.W. 1989, ApJ, 345, 730
- Schiano (1986) Schiano, A.V.R. 1986, ApJ, 302, 81
- Schmidt & Green (1983) Schmidt, M. & Green, R.F. 1983, ApJ, 269, 352
- Schulz (1988) Schulz, H. 1988, A&A, 203, 233
- Storchi–Bergmann et al. (1992) Storchi–Bergmann, T., Mulchaey, J.S., & Wilson, A.S. 1992, ApJ, 395, L73
| Quasar | z | Int. [O III] | Int. Cont. | Int. PSF Star | Subtr. Method | ||
|---|---|---|---|---|---|---|---|
| (1) | (2) | (3) | (4) | (5) | (6) | (7) | (8) |
| PG0026+129 (catalog ) | 00 29 13.71 | +13 16 03.83 | 0.142 | 300 (8) | 120 (2) | 6 (2) | PSF star scaled to cont. |
| PG0052+251 (catalog ) | 00 54 52.13 | +25 25 39.33 | 0.155 | 280 (5) | 60 (4) | 35 (4) | PSF star scaled to cont. |
| PG0157+001 (catalog ) | 01 59 50.21 | +00 23 41.55 | 0.163 | 240 (6) | 60 (4) | 40 (4) | cont. |
| PG0953+414 (catalog ) | 09 56 52.35 | +41 15 22.53 | 0.234 | 165 (8) | 60 (4) | 50 (4) | cont. |
| PG1012+008 (catalog ) | 10 14 58.10 | +00 32 05.44 | 0.187 | 400 (4) | 60 (3) | scaled PSF star | |
| PG1049–005 (catalog ) | 10 51 51.46 | –00 51 18.16 | 0.360 | 212.5 (8) | 60 (4) | 40 (4) | scaled cont. |
| PG1307+085 (catalog ) | 13 09 47.93 | +08 19 49.62 | 0.155 | 250 (6) | 60 (4) | 35 (4) | PSF star scaled to cont. |
Note. — Columns: (1) quasar; (2–3) right ascension (in units of hours, minutes, and seconds) and declination (degrees, arcminutes, and arcseconds) as provided by NED (J2000); (4) heliocentric redshift from NED; (5–7) mean of the integration time in s for the single image ([O III], continuum or PSF star) followed by, in brackets, the number of exposures which were combined; (8) subtraction method: scaled PSF star, continuum, scaled continuum or PSF star weighted by the flux in the continuum image
| Quasar | Lum. Dist. | Apert. | Radius | [O III] Flux | [O III] Lum. | H Lum. | Surf. Brightn. |
|---|---|---|---|---|---|---|---|
| (1) | (2) | (3) | (4) | (5) | (6) | (7) | (8) |
| PG0026+129 (catalog ) | 708 | 0.86 | 2281 240 | 7 | 4.2 0.4 | 9.41 1.4 | 1.47 |
| PG0052+251 (catalog ) | 780 | 1.39 | 3958 565 | 8.59 | 6.25 0.6 | 18.12 2.7 | 2.03 |
| (feature) | 0.6 | 1696 283 | 0.38 | 0.27 0.03 | 0.81 0.1 | ||
| PG0157+001 (catalog ) | 824 | 1.29 | 3832 590 | 5.67 | 4.61 0.5 | 7.74 1.2 | 2.43 |
| (feature) | 0.5 | 1474 295 | 0.4 | 0.32 0.03 | 0.54 0.1 | ||
| PG0953+414 (catalog ) | 1239 | 1.49 | 5884 785 | 3.14 | 5.76 0.6 | 49.9 7.5 | 1.05 |
| PG1012+008 (catalog ) | 973 | 1.59 | 5319 665 | 5.01 | 5.67 0.6 | 20.35 3.1 | 1.54 |
| PG1049–005 (catalog ) | 2011 | 1.99 | 10484 1048 | 5.64 | 27.28 2.7 | 52.57 7.9 | 0.53 |
| PG1307+085 (catalog ) | 791 | 1.39 | 4002 572 | 6.96 | 5.21 0.5 | 20.83 3.1 | 1.35 |
Note. — Columns: (1) quasar; (2) luminosity distance in Mpc; (3) radius of the apertures in arcseconds; (4) radius of the NLR in pc; (5) [O III] 5007 fluxes, given in units of erg s-1 cm-2. These fluxes were derived by summing the flux in the HST images inside the circular aperture with radius given in column (3); (6) [O III] 5007 luminosities in units of erg s-1; (7) H luminosities in units of erg s-1; (8) surface brightness at the edge of the NLR in units of erg s-1 pixel-1 (those of the Seyferts were at about the same value)