Evolutionary synthesis models of starbursts
In this work we investigate the evolution of the X-ray emission of a cluster of single young massive stars with different metallicities. We have considered the X-ray contribution originated by the diffuse gas heated by the mechanical energy released by stellar winds and SN explosions as well as the X-ray contribution from SN remnants. The resulting ionizing spectrum (i.e. Å) has been used to compute the expected intensity of the nebular He ii 4686 Å. The observational ratio He ii/H could be reproduced by the models assuming that a fraction of the mechanical energy produced by the star-formation episode is reprocessed by interaction with the ISM as soft X-ray radiation, contributing to the He ionization. However, the discreteness of the stellar populations affects the ionizing flux and may be responsible for the observed dispersion of the ratio. We have finally used the synthesis models to estimate the contribution of circumnuclear star-forming regions to the multiwavelength energy distribution in Active Galactic Nuclei, finding that the UV to soft X-ray continuum in many Seyfert 2 galaxies seems to be dominated by star-formation processes.
Key Words.:
Galaxies: evolution – X-rays: galaxies1 Introduction
In the last years convincing observational evidences have been collected about the presence of starburst regions in or around active Seyfert 2 nuclei (Heckman et al. 1997; González-Delgado et al. 1998, and references therein). It has been found that most of their UV light originates in (circum-)nuclear star-formation sites; the possible connection between the nuclear activity and the properties of these starbursts is still a matter of debate. According to the unified scheme of Seyfert galaxies, the active nucleus should be hidden by an opaque torus in the case of Seyferts 2, explaining why the collected UV light is dominated by young, massive stars. The low degree of contamination by the active source in the UV provides detailed information about the properties of the star-formation processes. Moreover, extrapolating to the radio – X-ray ranges the emission associated with the starbursts, it should be possible to disentangle the fractional contribution of both sources (the starburst and the active nucleus) at different energy ranges. Multiwavelength evolutionary synthesis models normalized to the observed UV emission would be the ideal tool to perform this analysis.
With these ideas in mind we started some years ago a program to extend our evolutionary synthesis models (Arnault et al. 1989, Paper I, Mas-Hesse & Kunth 1991, Paper II, hereafter MHK, Cerviño & Mas-Hesse 1994, Paper III, hereafter CMH) to high-energy ranges (soft and hard X-rays, -rays). The predictions of -ray emission were presented in Cerviño et al. (2000a), and this paper is devoted to the X-ray emission. It became evident from the beginning that to properly reproduce the X-ray emission, both the contribution of evolved binary systems and the heating of the diffuse interstellar gas by the release of mechanical energy (by stellar winds and supernova explosions), had to be considered. Nevertheless, while High Mass X-ray binaries contribute essentially to the hard X-ray range (above few keV, Van Bever et al. 1999; Van Bever & Vanbeveren 2000), the soft X-ray emission is dominated by very hot diffuse gas, heated by the release of mechanical energy from the starburst (Heckman et al. 1995, 1996; Dickow et al. 1996; Stevens & Strickland 1998a, b; Strickland & Stevens 1999; Summers et al. 2001). We will therefore discuss in this paper the predicted soft X-ray emission, and its effects on other observables, like the relative intensity of Hydrogen and Helium emission lines. The contribution of binary systems and evolved sources to the hard X-ray emission will be discussed in a forthcoming paper.
Additionally, the statistical dispersion due to the discreteness of actual stellar populations as presented in Cerviño et al. (2000b, 2002, 2001) is particularly important in the high energy domain, where the number of effective sources is lower. This computed statistical dispersion allows to perform a better comparison with real systems and to evaluate the statistically relevant sources in each energy range.
We present in Sec. 2 our evolutionary synthesis model and show how the X-ray emission and its associated statistical dispersion have been computed. In Sec. 3 we show the predictions on soft X-ray emission. In Sec. 4 we explore the effects of the soft X-ray contribution on the He ii nebular emission line. In Sec. 5 we compare our predictions with observational data from star-forming and Seyfert galaxies, aiming to disentangle the relative contribution of starbursts to the global energy budget of Seyferts. We finally summarize in Sec. 6 our conclusions.
2 The evolutionary synthesis model and the X-ray emission
We have updated and improved the synthesis model presented in Arnault et al. (1989); Mas-Hesse & Kunth (1991); Cerviño & Mas-Hesse (1994) with the following modifications:
- 1.
- 2.
-
3.
Inclusion of an analytical Initial Mass Function (IMF) formulation using a dynamical mass-bin111We have used a resolution in the HR diagram of = 0.001 dex and = 0.001 dex for alive stars and not larger than 0.1 and not lower than M⊙ for stars that have reached their life-time at the computed age. (see Cerviño et al. 2001, and references therein for a full description). We have also maintained the original Monte Carlo formulation.
-
4.
Use of parabolic interpolations in time for the computation of the isochrones (see Cerviño et al. 2001, for a full study and discussion).
- 5.
For this work, we will use only an analytical formulation of the IMF without Monte Carlo simulations. The basic input parameters of the model are: (i) Instantaneous burst of star formation. (ii) Salpeter IMF () with a lower mass-limit equal to 2 M⊙ and upper mass-limit equal to 120 M⊙ (iii) Set of evolutionary tracks with standard mass-loss rates from Schaller et al. (1992).
In the following sections we describe how the different contributions to the soft X-ray emission have been included in the computations.
We will consider as soft X-rays all photons with energies between 0.07 and 2.4 keV (the rosat band), while hard X-ray photons will have energies between 2.5 and 10 keV. We will also use the einstein band (range 0.1 – 3.4 keV) in Sec. 5 and the total X-ray luminosity (0.02–10 keV), .
2.1 Sources of soft X-ray emission
The main (persistent) contributors to the X-ray emission in a star-forming region with only single-star populations will be essentially individual stars, supernova remnants (SNR) and hot diffuse gas. In addition, other sources like supernova explosions themselves, produce transient peaks of X-ray emission. Since these peaks would be of very short duration, we have not included them in our calculations, but we want to stress that they could provide some degree of variability in the high-energy emission of starbursts. Additionally, neither pulsars in young supernova remnants nor X-ray binaries have been included in the computations, as explained below.
2.1.1 Individual stars
In the case of massive stars, strong mass losses produce first a cloud of material surrounding the star. In a second stage, winds from the star shocks this material generating X-ray emission (Chlebowski & Garmany 1991). The luminosity in X-rays for stars hotter than B1 may be approximated by Chlebowski et al. (1989):
| (1) |
The maximum contribution from the total population of individual stars is about 1030 erg s-1 M at 3 Myr after the onset of a burst, assuming an instantaneous burst following a Salpeter IMF slope. As we will see, this contribution is around 2 orders of magnitude lower than the emission from other sources and has not been taken into account for computing of the total X-ray spectral energy distribution. We have instead included the amount of mechanical energy released by the stellar winds in the total budget of energy injected into the interstellar medium, as discussed later.
2.1.2 Supernova Remnants
Supernova explosions (SN) will contribute strongly to the whole spectral energy distribution, but only during a very short time (the light-curve of a SN decays very quickly in few years). This contribution is furthermore very variable in a short time scale and has not been taken into account in the models.
On the other hand, after a SN explosion, there will be a remnant of expanding hot gas that will contribute essentially to the X-ray and radio domains during its free-fall and adiabatic phases. The time scale of the free-fall phase is about 90 yr (Woltjer 1972), and has not been taken into account in the models. The adiabatic phase has a time scale of (Woltjer 1972):
| (2) |
where is the density where the SNR expands and the mechanical energy released by the SN explosion in units of 1050 erg. Assuming a mean value of = 10 and atoms cm-3, a SNR emits in X-rays during yr. Following MHK, the contribution to the spectral energy distribution from SNRs can be approximated by:
| (3) |
where is the SN rate, the time in which the SNR shows X-ray (or radio) emission and the emission associated to one individual SNR. Eq. 3 assumes that the supernova rate is high enough to maintain a steady emission from SNRs during the burst.
It is important to point out that in the case of the analytical-IMF computations, we have used a mass bin such that there is, at least, one star suffering a SN explosion in every step of 104 years starting 2 Myr before the computed age. This assures that the computation of the X-ray emission is correctly made and that there is no bias due to the choice of the mass bin. The final output is the average value over the used time step.
For the emission in radio and X-rays of SNR we have done the following assumptions concerning :
-
•
X-rays: During the adiabatic phase of the SNR evolution, we have assumed it will emit soft X-rays following a composite Raymond-Smith hot-plasma law (Raymond & Smith 1977) at different temperatures and at a metallicity consistent with the metal abundance of the region. In accordance with the compilation of Dickel et al. (1990), we have assumed the same average temperature for the hot gas in the cavity of all SNR, as given by Eq. 4:
(4) where is a Raymond-Smith spectrum of temperature . We have normalized the emission of each individual SNR within the einstein band (0.1–3.4 keV) to an average value of 1036 erg s-1, similar to the emissions given for the Cygnus Loop by Cox (1972) and Chu & Mac Low (1990) for SNR in the Large Magellanic Cloud. With these values, and assuming that the emissivity within the einstein band is roughly constant in the range of temperatures of the adiabatic phase, we obtain finally erg s-1 year, which is the value we have considered in our calculations.
We have assumed in addition a harder component with keV (Cox 1972) originated at the shock front of the SNR, accounting for around 20% of the total emission.
-
•
Radio: Following MHK, we have assumed that the radio emission originated by a SNR follows a power law with index from 408 MHz to 4885 MHz (6 cm). We have updated the emission associated with a single SNR considered in MHK to a value at 6 cm of Jy Kpc2 year, that takes into account the possible contribution from cosmic rays and interaction with other remnants (see MHK and Mas-Hesse 1992 for more details).
Individual point sources detected by rosat in nearby galaxies are indeed generally associated with SNR (Aschenbach 1998).
2.1.3 Mechanical energy released into the Interstellar Medium
The large amounts of mechanical energy released by the starburst process are expected to heat the interstellar medium around the newly formed stars. Observations with einstein already showed the presence of hot diffuse gas within the H ii shells of 30 Dor (Wang & Helfand 1991). Combining rosat and asca data, Wang (1999) confirmed the thermal nature of the emission, originated by diffuse gas at K, in the soft X-ray band. Similar results have been obtained in many other starburst-dominated galaxies: Stevens & Strickland (1998a, b) found that the soft X-ray spectra of a sample of 7 Wolf-Rayet galaxies could typically be well fitted by a thermal Raymond-Smith component with temperatures in the range kT = 0.3–1.0 keV (corresponding to few times 106 K). These authors concluded that a large fraction of the observed X-ray emission in these galaxies originated in a hot superbubble formed by the combined action of stellar winds from the massive, young stars in the central cluster. Strickland & Stevens (1999) showed with hydrodynamical simulations that the observed soft X-ray emission in NGC 5253 was consistent with the predictions for young superbubbles blown by the starburst. Other starburst galaxies showing thermal soft X-ray emission are: NGC 1569, with kT = 0.8 keV (Heckman et al. 1995); Arp 220, kT = 0.61 keV (Heckman et al. 1996) or Henize 2-10 with kT = 0.31 keV (Dickow et al. 1996) and Mrk 33 = Haro 2 (Summers et al. 2001), among others (see also Heckman et al. 1997).
We have computed the total release of mechanical energy from stellar winds following the prescriptions in Leitherer et al. (1992). The mechanical energy released by SN explosions has been taken from the solar metallicity SN simulations of Woosley & Weaver (1995) for SN II and from the simulations of Helium bare cores of Woosley et al. (1995) for WR stars. We have subtracted from the energy of each SN explosion the total energy emitted in the 0.02 - 10 keV band by the SNR during the adiabatic phase. It has a value in the einstein band of erg.
We have also assumed that a variable fraction of the total mechanical energy released will end up interacting with and heating the diffuse interstellar gas to an average temperature of 0.5 keV. As a first approximation we have thus considered a contribution to the X-ray emission from starbursts coming from a Raymond-Smith thermal plasma at a fixed temperature kT = 0.5 keV.
Different estimations of can be found in the literature based on hydrodynamical models, but they are quite dependent on the assumed input physic (see Strickland & Stevens 1999, 2000, for an extensive review). The standard bubble model of Castor et al. (1975), that assumes a constant energy input into the bubble, shows that only 20% of the energy injected into the ISM is used in the bubble expansion (i.e. ). On the other hand Strickland & Stevens (1999) find =0.05 from their hydrodynamical simulations (assuming also a constant energy input into the expanding bubble).
We have chosen an arbitrary value of =0.2 for the presentation of this work. But we want to stress that the actual value of should be derived by fitting the observational values on an object by object basis. It is interesting to note that a high value of leads to a high X-ray emission, but, since the total energy in the burst must be conserved, it also leads to a small radius for the expanding bubbles. Therefore, the comparison with observational data will only be consistent when both the X-ray emission and the structure of expanding bubbles are taken into account. The effect of changing the efficiency could be computed at any time using the relative values given in Table 1.
2.1.4 Other X-ray sources
-
•
High Mass X-ray Binaries (HMXRB): High Mass X-ray Binaries become X-ray “active” (permanent) after the primary star has collapsed in a compact companion, and when the secondary star enters the giant or supergiant phases, starting to accrete material onto the surface of the compact companion. HMXRB will become therefore active only after the first 4-5 Myr of evolution, depending on the upper mass limit of the IMF. The X-ray emission properties will be dependent on the radius of the compact companion. Assuming a radius of the compact companion of around 10 km, the bulk of the emission will be mainly in the hard X-ray band (2.5–10 keV) with a tail that will also emit in soft X-rays. The hard X-ray predictions of our models including binary systems and their statistical relevance will be presented in a forthcoming paper.
-
•
Pulsars in young SN remnants (YSNR): Van Bever & Vanbeveren (2000) show that the loss of rotational energy of young pulsars in the form of electromagnetic waves are another possible source of X-ray emission. This emission can be fitted by a Raymond-Smith model with a temperature kT around 2 keV. According to these authors, the total X-ray luminosities associated to these sources are around 1032 erg s-1 M (for a starburst with a mass normalization given by an IMF with a slope and mass range 10 –100 M⊙). This emission takes place only after the most massive stars have exploded as supernovae, and is negligible when compared with the total emission associated to both SNR and diffuse hot gas, even for rather low efficiency values. Furthermore, only a very small number of such objects is expected, so that their prediction is affected by very strong statistical fluctuations. For these reasons we have not considered this contribution in this work.
-
•
Low-mass X-ray (LMXRB) binaries and Compton scattering: Persic & Rephaeli (2002) compute the steady-state X-ray emission of star forming galaxies. In their work they include the emission produced by low-mass X-ray binaries, compton scattering and the emission of the compact nucleus in AGNs. They also include the contributions from the diffuse emission and HMXRB. Since our work aims to establish the contribution to the soft X-ray from star-forming regions, we have not included the emission of compact nuclei. We are also restricted to young ages ( Myr) and single stellar evolution, hence the contribution of LMXRB has not been considered. Finally, compton scattering is related to the electron density and the presence of magnetic fields and will emit mainly in the hard X-ray domain (see Persic & Rephaeli 2002, and references therein) and has not been included in the current computations.
As pointed out before, we have not considered these contributions, but we keep in mind that the emission from YSNR could be significant in starbursts devoid of interstellar gas, where no contribution from hot gas is present and that HMXRB may increase the emission in both soft and hard X-rays.
2.1.5 X-ray conversion factors
As far as the X-ray predictions are dependent on the assumed band, we have summarized in Table 1 the conversion factors for the two components discussed in this work normalized to the total X-ray luminosity (0.02-10 keV). Such conversion factors have been obtained by the integration of the assumed X-ray spectrum over the given band. The results for all the bands can be found in graphic and tabular form in our WWW server at http://www.laeff.esa.es/users/mcs/SED, but we will show here only the predictions for the X-ray luminosity in the rosat band, for which most observational data are available. In the table we also give the rosat bands needed for the computation of the rosat hardness ratio.
| Metallicity | rosat | einstein | ||||
|---|---|---|---|---|---|---|
| (0.07-0.4 keV) | (0.41-2.4 keV) | (0.41-1.0 keV) | (1.0-2.4 keV) | (0.07-2.4 keV) | (0.1-3.4 keV) | |
| SNR | ||||||
| 0.001 | 0.290 | 0.441 | 0.251 | 0.190 | 0.731 | 0.745 |
| 0.004 | 0.263 | 0.490 | 0.301 | 0.189 | 0.753 | 0.759 |
| 0.008 | 0.243 | 0.526 | 0.337 | 0.188 | 0.769 | 0.770 |
| 0.020 | 0.220 | 0.568 | 0.380 | 0.188 | 0.788 | 0.783 |
| 0.040 | 0.207 | 0.591 | 0.403 | 0.188 | 0.798 | 0.789 |
| Diffuse hot gas | ||||||
| 0.001 | 0.408 | 0.457 | 0.360 | 0.097 | 0.865 | 0.813 |
| 0.004 | 0.284 | 0.606 | 0.494 | 0.112 | 0.891 | 0.859 |
| 0.008 | 0.221 | 0.683 | 0.563 | 0.120 | 0.904 | 0.883 |
| 0.020 | 0.160 | 0.756 | 0.629 | 0.127 | 0.917 | 0.905 |
| 0.004 | 0.134 | 0.788 | 0.658 | 0.130 | 0.922 | 0.915 |
2.2 Influence on the ionization structure
We have also taken into account that X-ray emission will produce a relatively small fraction of ionizing photons (compared with those generated by massive stars). Nevertheless, such photons will be predominantly more energetic than the ones of stellar origin, and will affect the ionization structure of the nebular gas, and thus the relative emission of some lines, as we will discuss below. The number of ionizing photons between the ionizing edges of H and He are given in Table 2 for the two components considered, as obtained from the integration over the assumed spectrum of each component. In this case, we have normalized the values to the total luminosity emitted in the rosat band. Note that the normalization is different to the one used in Table 1.
As an example for any further use of this table, let us assume a Z=0.001 metallicity star forming region where the X-ray luminosity produced by SNR is erg s-1 and the X-ray luminosity produced by the diffuse hot gas is erg s-1, both in the rosat band. There will be an additional component in Q(H+) of and photons s-1 due to the X-ray spectrum from the SNR and the hot diffuse component respectively. Of course, these additional Q(H+) values are dependent on the assumed X-ray spectrum, but it gives us a first order approximation of how important the contributions of the X-rays sources to the ionizing flux are.
| Metallicity | Q(He++) | Q(He+) | Q(H+) |
|---|---|---|---|
| () | () | () | |
| SNR | |||
| 0.001 | 2.35 | 3.80 | 4.13 |
| 0.004 | 2.24 | 4.05 | 4.38 |
| 0.008 | 2.17 | 4.24 | 4.36 |
| 0.020 | 2.11 | 4.43 | 4.74 |
| 0.040 | 2.05 | 4.53 | 4.85 |
| Diffuse hot gas | |||
| 0.001 | 2.65 | 4.33 | 4.79 |
| 0.004 | 2.07 | 3.50 | 3.87 |
| 0.008 | 1.75 | 3.06 | 3.41 |
| 0.020 | 1.49 | 2.69 | 2.99 |
| 0.040 | 1.37 | 2.51 | 2.80 |
2.3 Evaluation of the dispersion
In the following paragraph we summarize how to calculate the dispersion due to the discreteness of the stellar population. We refer to Buzzoni (1989) and Cerviño et al. (2002, 2001) for further details.
The IMF gives the probability, , of finding a number of stars within a given mass range. Each corresponds to the mass binning used in analytical-IMF synthesis codes. If we assume that each follows a Poissonian distribution (Cerviño et al. 2002), the variance, of each is equal to the mean value of the distribution, . Let us assume now that each star has a property whose contribution to the integrated property is given by with a variance . The total variance of the observable is the sum of all the variances. The relative dispersion is:
| (5) |
where the last term gives us the definition of described by Buzzoni (1989). Note that is normalized to the total mass. is not a real number of stars, but is gives us an idea of how many effective sources contribute to any given observable. Cerviño et al. (2002) show that also defines the mean value of a Poissonian distribution that can be used to obtain the corresponding confidence levels of any observable in function of the amount of mass transformed into stars.
Let us stress that IMF fluctuations are present in Nature (the number of stars are always discrete), so, is not an evaluation of the errors of the synthesis models. It is an evaluation of the dispersion intrinsically present in real clusters, i.e. the dispersion is also an observable. This intrinsic dispersion must be taken into account when fitting observed quantities to model outputs before establishing any conclusion.
For differential quantities, like the SN rate or the mechanical power, the obtained quantities are the mean value averaged over the time step (0.1 Myr in our case). The corresponding dispersion shows the variation over such average mean value (Cerviño et al. 2001).

3 Predictions on soft X-ray emission
As discussed in the previous section, both supernova remnants and diffuse hot gas will be the main contributors to the soft X-ray emission if only single-stars are considered. Depending on the evolutionary state of the starburst, one or the other component will dominate the emission at a given energy. We show in the top panels of Fig. 1 the predicted X-ray emission in the rosat band as a function of metallicity for two cases: (a) X-ray emission produced by SNR plus hot gas, with in the left panel, and (b) the X-ray emission produced by SNR only (i.e., with ) in the right panel.
The X-ray emission depends on the star-forming region metallicity only during the first few Myr, when the emission is dominated by the reprocessing of mechanical energy, since stellar winds are strongly metallicity dependent. On the other hand, after around 5 Myr the effect of metallicity on the X-ray emission is small since the supernova rate is essentially independent of metallicity.
It is clear that the total X-ray intensity is strongly dependent on the associated value, as shown in the top panel of Fig. 3. It is remarkable that even a relatively low value = 0.05 is enough to produce significant X-ray emission, even during the first Myr of a starburst, when no other sources are yet active. This is especially interesting considering that most star-forming galaxies have been observed at ages between 3 and 7 Myr (Mas-Hesse & Kunth 1999). In general, a change in the reprocessing from 0.05 to 1 implies approximately one order of magnitude in total X-ray emission.
Since most starbursts seem to have formed massive stars according to an IMF with a slope close to Salpeter’s one (Mas-Hesse & Kunth 1999), and since their metallicities can be derived from the analysis of optical emission lines, it should be possible to derive a first order estimation of the average value by just comparing the predictions with the observed soft X-ray luminosities.
The effective mechanical energy and mechanical power remaining available to drive gas flows away are smaller than the total amounts generated by the starburst, since some fraction of the energy, parameterized by , is reprocessed into thermal emission, and does not contribute to accelerate the gas. If such effect is omitted, the age deduced from kinematical studies will result systematically lower than the one obtained from the global analysis of the starburst.
In Fig. 2 we show the mechanical energy and mechanical power and the corresponding effective mechanical energy and power when a value of is used for the X-ray emission for a solar metallicity burst. We also show these quantities when the correction due to the X-ray emission of the SNR is not taken into account (P).
Lower panels of Figs. 1, 3 and 2 show the value of , and . The right axis shows the amount of gas transformed into stars for the given IMF and mass limits needed to ensure a dispersion lower than 10%, denoted as M10%(LX), M10%(LK) and M10%(EK). We will use this notation for subsequent figures.


In the case of the X-ray luminosities and the mechanical power two regimes can be separated. At the beginning of the burst the dispersion is dominated by the stellar wind component, i.e. there is a large number of effective sources that are contributing to the luminosity. When the first SN explodes, the value of decreases abruptly: as far as the remnant of a single SN produces more X-ray emission than the stellar winds associated component, the effective number of sources decreases and the dispersion due to the discreteness of the stellar population becomes larger. It is also consistent with the fact that for evolved starburst the possible dispersion will be dominated by the occurrence of SN events, and so does the X-ray emission. In the case of the mechanical energy, the value of is larger (hence the dispersion lower) because it is an integrated quantity (see Cerviño et al. 2001, for more details).
3.1 Comparison with other works
There are at least two other studies predicting the soft X-ray emission in starburst galaxies: Silich et al. (2001) and Strickland & Stevens (1999, 2000). In both cases the X-ray emission is obtained by simulations of superbubbles and hydrodynamical models taking into account the time evolution of the kinetic luminosity.
In Silich et al. (2001), the X-ray luminosity is obtained from two components: the interior of the superbubble and the shell, with an analytical dependence of the metallicity on the radiative cooling function, . They show that the soft X-ray emission depends on the enrichment of the hot ISM by stellar winds and SN explosions. Nevertheless, their results are similar to the ones obtained in Strickland & Stevens (1999).
The study by Strickland & Stevens (1999) uses a superbubble model expanding in a vacuum medium (i.e. an external pressure equal to zero) and obtains the X-ray luminosity from the integration of the density structure and the radiative cooling function over the volume of the bubble. They find a correlation between the mechanical luminosity and the soft X-ray emission of with a time delay between both quantities (variations in occurs earlier than variations in ). They also present an extensive discussion of the factors affecting the computed X-ray emission, assuming superbubbles (see Strickland & Stevens (2000)). Their results (their Fig. 6) are quite similar to the ones we have obtained (c.f. Fig. 2 scaled to a M⊙ burst) with an efficiency of 5%, except for the time delay as we have explained above.
Additionally, 1-D hydrodynamical simulations computed by Plüschke (2001) taking into account the environment where the bubble expands (an ambient density of 40 atoms cm-3 is assumed in their models), show that the dissipation of is around 80% (which includes not only radiative cooling, but also the effects of mass-loading inside the bubbles). Note that such effects may change the time delay between and .
In summary, our approximation parameterized in terms of , although quite simplistic, provides a good first order approximation to the more detailed superbubble simulations.

3.2 The case of Mrk 33 = Haro 2
As an example, we have applied our models to Mrk 33. It is not the scope of this paper to perform a detailed analysis of the properties of this galaxy and it has been used only as a first order consistency check. We refer to Summers et al. (2001) for a more complete study using different constraints and synthesis models.
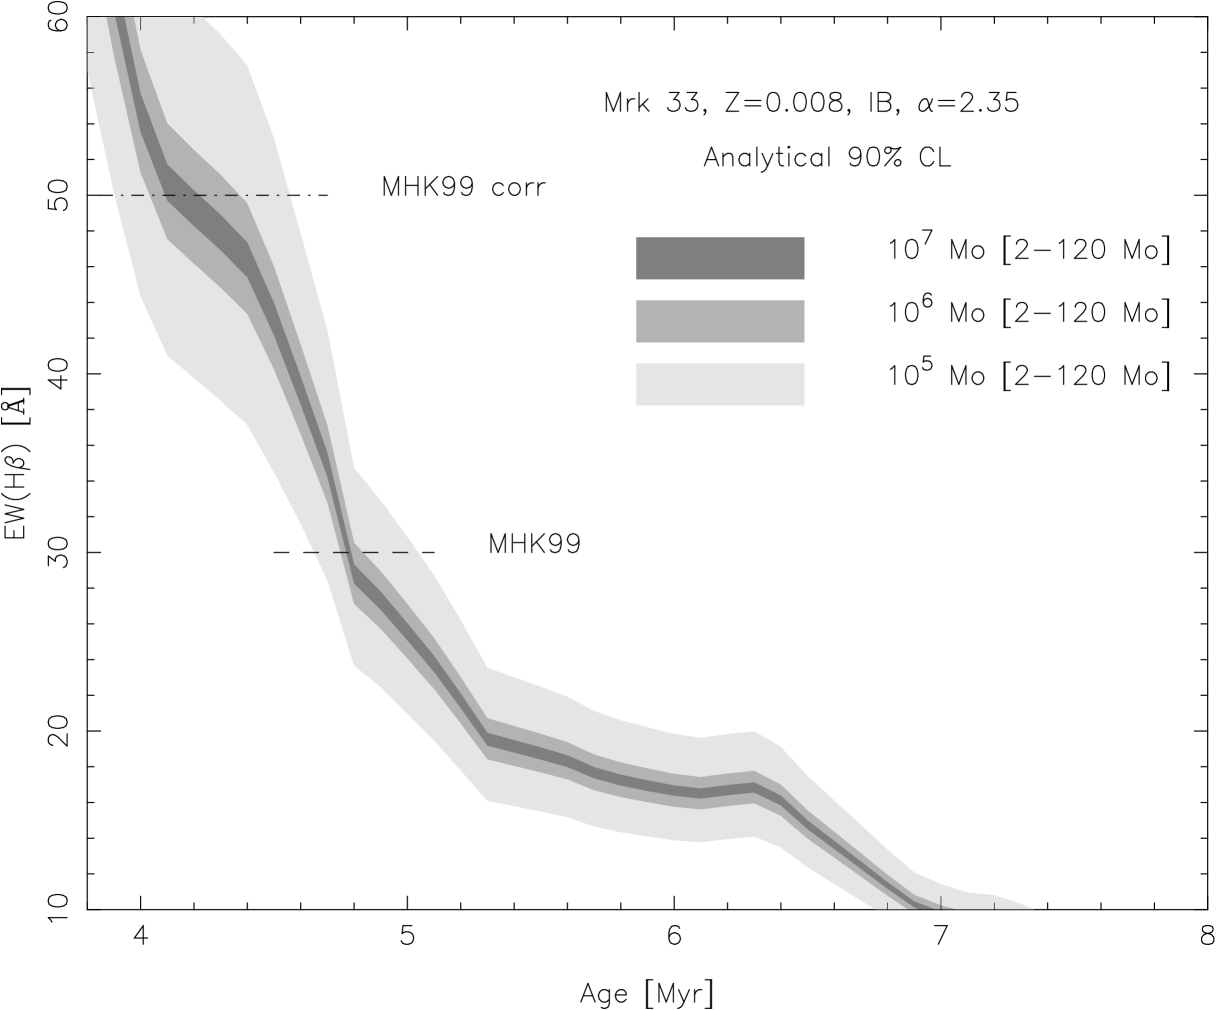
The first step to apply the model is to obtain an estimation of the age of the burst. For this we refer to the W(H) value used by Mas-Hesse & Kunth (1999), which was obtained through a large aperture and was corrected from the contamination by the underlying stellar population. We show in Fig. 4 the predictions of the models as a function of age, with the corresponding 90% confidence limits for different amounts of gas transformed into stars and a metallicity Z=0.008. The predicted W(H) values have been computed assuming that a fraction of 0.3 of ionizing photons are not absorbed by the gas and the other 0.7 is transformed in H luminosity following Case B recombination (see Mas-Hesse & Kunth 1999, for details).
As we can see in the figure, W(H) alone constrains the age of the starburst to around 4.2 Myr. By using a previous version of our set of models, Mas-Hesse & Kunth (1999) derived an age around 4.8 Myr. For our case, it should be enough to constrain the age of the starburst within the range 4 to 5 Myr, assuming an instantaneous burst.
The kinetic energy of the neutral expanding gas that is pushed out by the shell in this galaxy is (see Lequeux et al. 1995; Legrand et al. 1997) Ek(Hi)= (kpc) erg, where is the size of the expanding shell. Some possible values of have been proposed in the literature: (i) Legrand et al. (1997) derived an value of 1.23 kpc from the expanding Hα shell and using a distance of 19.5 Mpc (ii) Summers et al. (2001) found a extended X-ray source with an ellipsoidal shape and diameters of of 2.3 kpc and 1.9 kpc assuming a distance of 22 Mpc (i.e. kpc) and (iii). Also Summers et al. (2001) obtain an average radius 1.1 kpc from B band images. From this last study, we assume the same distance and a value of 1.1 kpc and so a Ek(Hi)= erg.
Finally, the observed soft X-ray luminosity in the rosat band ranges from 0.2 to 1.4 erg s-1. The first value corresponds to the HRI observations of Summers et al. (2001), while the second one was derived by Strickland & Stevens (1999) from PSPC data.
Our model predicts EK between and erg M at 4 and 5 Myr respectively, and LK between (at 4 Myr) and erg s-1 M (at 5 Myr). The uncertainty in LK is lower than 5% in a 90% confidence level and lower than 2% (also in the 90% confidence level) for EK assuming a mass transformed into stars, , larger than 106 M⊙ using a Salpeter IMF slope with mass limits from 2 to 120 M⊙
A first order estimation of and the mass of the cluster can be obtained using the following relations:
| (6) |
Note that, for a fixed value of , larger values of Ek produce larger values in , and lower values in LK produce larger values in .
Assuming a constant value along the evolution, it is possible to obtain values between 0.02 (at 4 Myr with HRI data and M⊙) and 0.31 (at 5 Myr with PSPC data and M⊙). On the other hand, ranges from M⊙ (at 5 Myr with HRI data and ) to M⊙ (at 4 Myr with PSPC data and ).
So, the observed values can be explained with a 4–5 Myr old burst with a mass transformed into stars of M⊙ (following a Salpeter IMF slope in the mass range 2 – 120 M⊙) and a value from 0.02 to 0.31.
In this simple approximation we have not considered observational errors on Ek, neither different treatments of the mass-loss rates in the evolutionary tracks nor different velocity laws in the computation of Ek and LK, which would presumably increase the range of possible values. So, a more careful analysis, based on a self-consistent comparison of the multiwavelength spectral energy distribution and a complete set of observables of Mrk 33 with the model predictions is necessary to derive any firmer conclusion.
4 Predictions on optical emission lines intensities: H and He ii
The H equivalent width has been used by many authors in the last years as a reliable indicator of the evolutionary status of a starburst, since it relates the most massive stellar population (main contributors to the gas ionization) with the total population in the cluster, which produces the optical continuum (see Copetti et al. 1986 or Mas-Hesse & Kunth 1999 as an example). Other emission lines have been proposed as age indicators, like O iii ones by Stasińska & Leitherer (1996). Additionally, the strong soft X-ray flux produced by the hot diffuse gas and SNR will contribute to harden the overall ionizing continuum, potentially affecting the ratios of different emission lines.

We show in Fig. 5 the evolution with time of W(H) as a function of the metallicity for a model where X-ray emission (neither SNR nor mechanical energy reprocessed in X-rays) is not taken into account (standard) and a model with a value of . It can be seen that the presence of hot gas may affect the predicted W(H) values after the first 6 Myr of evolution, i.e., when the ionizing continuum of the massive stars decreases222The evaluation of the differences in W(H) between models that include X-ray emission and standard ones depends on the metallicity and values. We refer to the data in our WWW server at http://www.laeff.esa.es/users/mcs/SED for precise comparisons.. A first implication of these results is that W(H) becomes a very uncertain age indicator for values below about 10 Å. A similar conclusion has been obtained by Van Bever et al. (1999) based only on the effect of binary systems, but in their case, the additional ionizing flux comes both from the donor star of the binary system, that becomes (depending on the mass-transfer scenario) a WR star, and from the gainer star, that becomes more massive hence hotter than before the mass-transfer episode. They obtain a higher value for a reliable use of W(H) (i.e. not dominated by binary systems) around 75 Å.
Additionally, the dispersion of W(H) when the X-ray emission is taken into account becomes larger than the one without such hot gas emission. It is due to the intrinsic uncertainty of the X-ray emission itself (i.e. the small number of effective sources). It also means that the age determination of systems with low W(H) values is an intrinsically difficult task, as far as the possible ionizing sources are not only massive stars, but also diffuse hot gas.
While the inclusion of the soft X-ray flux in the ionizing budget does not affect only weakly the total intensity of the H line, it can affect more significantly other emission lines with higher ionization potentials, like [O iii] 5007 Å. At 54.9 eV, the soft X-ray flux might become the dominant contribution to the ionizing continuum, affecting significantly the expected intensity of the line.
The nebular He ii 4686 Å emission line has been detected in few Star Forming Galaxies (SFG) (Conti 1991; Schaerer et al. 1999), but is apparently absent in most of them. The average ratio of the observed intensity of He ii over the intensity of H, I(He ii)/I(H), is around 0.02 (French 1980). Massive stars are not hot enough to produce the hard ionizing continuum required for such relatively large ratios, except perhaps during the WR phase, as discussed by Schaerer & Vacca (1998). Nevertheless, no clear correlation has been found between the detection of the line and the presence of WR stars in the region. Additional, harder contributions to the ionizing continuum are therefore required to explain the observed ratios.
We have explored the effects associated with the reprocessing of mechanical energy in the interstellar medium and the X-ray emission of SNR. The results are shown in Fig. 6.

The ionization by hard photons produced by the diffuse gas heated by the release of mechanical energy into the medium can lead to significantly higher values of the I(He ii)/I(H) ratio specially for low metallicity clusters. As has been shown by Schaerer & Vacca (1998), for solar metallicity starburst, a value of the ratio of 0.01 can be explained only with the presence of WR stars, but such value is never reached in low metallicity clusters. We show here that it is possible to obtain such ratio if the soft X-ray emission is included.
However there are some points we would like to note here:
-
•
The extension of the ionized region emitting the He ii 4686 Å line is generally much smaller than the region over which H is emitted, as shown by Maíz-Apellániz et al. (1998) in NGC 4214. To properly compare with the predictions of synthesis models, the observed He ii 4686 Å flux has to be divided by the H intensity integrated over the whole ionized area. Such integrated ratios can be smaller by almost an order of magnitude than the ratios measured just locally. Another illustrative example can be found in Luridiana et al. (1999) where the authors apply a photoionization model to NGC 2363 with the aim of explain with a single model all the observations of the region obtained by other authors using different apertures. Whereas the observed I(He ii)/I(H) ratios varies from 0.010 to 0.004, the global I(He ii)/I(H) ratio of the model that fit all the observations has a value of 0.001.
-
•
Our models compute the predicted soft X-ray emission assuming the released mechanical energy is reprocessed immediately into high energy photons. A more realistic scenario would imply that the mechanical energy is first accumulated in the form of energetic gas outflows, being released in the form of soft X-rays only when this expanding gas interacts with static interstellar clouds. Therefore, at some stages, the soft X-ray contributions to the ionizing continuum could be stronger than values predicted by our models.
-
•
The hard ionizing flux intrinsically has a big dispersion. Its value is controlled by a small number of effective sources (WR stars, hot gas clouds or binary systems), hence suffers from severe statistic problems.
In order to support the last items, we show in Fig. 7 the 90% confidence limits obtained from the (I(He ii)/I(H)) value for a cluster with a metallicity Z=0.001 and different amount of gas transformed into stars.
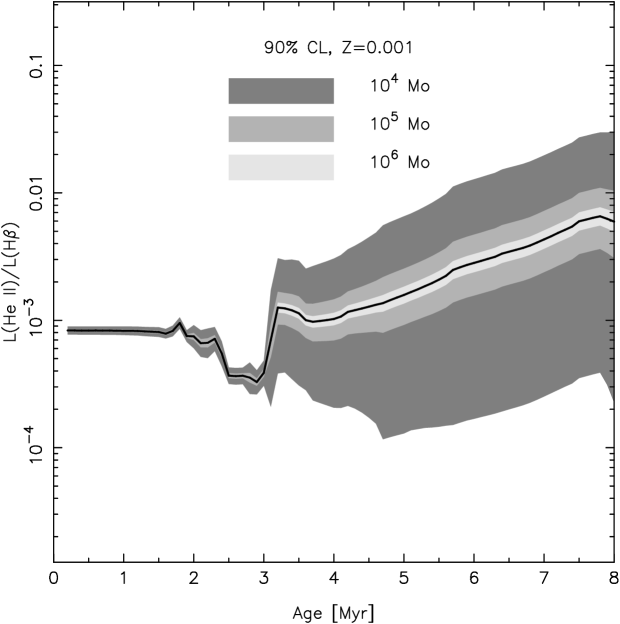
We therefore conclude that the additional hard ionizing photons produced by the diffuse gas can explain, at least partially, the intensities of He ii 4686 Å observed in low metallicity star forming regions. However, at this point it is impossible to establish the source(s) of the He ii 4686 Å. From a theoretical point of view, it is necessary to include other sources of X-ray emission that were not considered in this work, and establish their statistical relevance. From the observational point of view, more observations in different wavelengths domains are needed to constrain the sampling effects due to the discreteness of the stellar population. They must be unaffected by additional aperture effect biases.
5 Star-formation processes in Seyfert galaxies
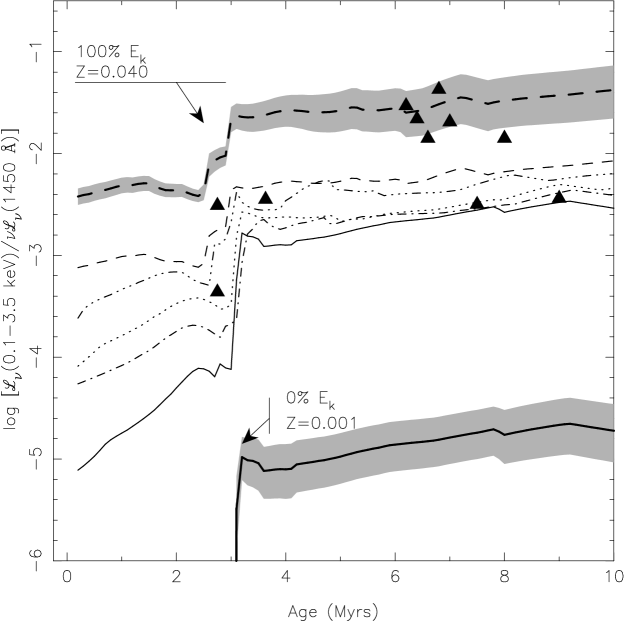
We have compared the predictions of our models with the multiwavelength data for a sample of AGNs (QSO, Seyfert 1 and Seyfert 2) and SFGs compiled by Mas-Hesse et al. (1995). We show in Fig. 8 the predicted evolution of the Lν(0.1 – 3.5 keV) over Lν(1450 Å) ratio for =0.2 and different metallicities. The model predictions correspond to a Salpeter IMF. We have also plotted the highest (0.040 metallicity with =1) and the lowest (0.001 metallicity with =0 including the SNR component only) values of the ratio, and the corresponding 90%CL for a 105 M⊙ cluster, so that, for a given age, both solid lines (and bands) represent the upper and lower limits we should expect associated to a star-formation episode. Data points are from SFG in Mas-Hesse et al. (1995) compilation. We have determined the ages of the plotted objects from the W(H) values taken from the literature, but it can be seen that in any case the results are weakly dependent on the assumed age. UV data have not been corrected for internal extinction, so that the plotted ratios have to be taken as upper values and should be indeed intrinsically lower by factors between 2 and 5, approximately (Mas-Hesse & Kunth 1999).
From Fig. 8 we see that almost all galaxies fall within the predictions of synthesis models. It is important to stress that some conversion of mechanical energy into X-rays is always required. Otherwise the models would severely underestimate the observed X-ray/UV ratios. Additionally, some galaxies fall outside the model limits. It can be due to statistical effects and/or the presence of binary systems that will increase the X-ray emission and/or the underestimation of the observed UV flux due to extinction effects. We want to point out that the effect of the extinction in our sample has not been considered. Even a moderate extinction would significantly affect the UV continuum, putting so the X-ray/UV ratio within the model limits without additional X-ray sources.
Note that our models compute only the persistent X-ray emission form single-stellar populations. Transient sources like Be/X-ray binaries and SN explosions may increase the X-ray emission in these galaxies, but only during very short periods of time. In the case of Be/X-ray binaries the component may be highly variable and would affect only the soft X-ray emission.

In order to disentangle the relative contribution of (circum-)nuclear star-formation processes to the total energy budget of low activity AGNs, we have compared their Lν(0.1 – 3.5 keV) over Lν(1450 Å) ratios with the predictions of our synthesis models. We show in Fig. 9 the corresponding histograms for the Sey 1, Sey 2 and SFGs taken from the Mas-Hesse et al. (1995) sample. The vertical line corresponds to the maximum value predicted by the models, as shown in Fig. 8.
The segregation of Sey 1 and star-forming galaxies becomes evident at first glance: while most of the SFGs in the sample fall below the predicted upper value, all Seyfert 1 galaxies show clearly higher values, by one to two orders of magnitude. Therefore, while the physical processes assumed to take place in star-forming galaxies may explain their observational properties, other high energy sources are required in the case of Seyferts 1, as expected.
The case for Seyfert 2 galaxies is more interesting: while some of them are located on the plot in the region associated to starbursts, some others show a clear X-ray excess with respect to star-formation dominated objects. The presence of star-formation regions in or around the nuclei of some Seyfert 2 galaxies has become evident in the last years. Heckman et al. (1997) showed that around 70% of the UV continuum in some Seyfert 2 galaxies were contributed by young, massive stars, with only a small contribution being associated to the nuclear active source. Colina et al. (1997) estimated that only 1-10% of the UV flux in 4 Seyfert 2 galaxies imaged with the HST was originated by the nuclear source, while the rest was due to young hot stars recently formed around the nuclei. The contribution of star-forming regions to the budget energy distribution of AGNs was also pointed out some years ago by Mas-Hesse et al. (1995) based in multivawelength analysis of these type of galaxies, and by Cid-Fernandes & Terlevich (1995).
Our results show that not only the UV continuum seems to be strongly contaminated by the emission associated to starburst episodes in Seyfert 2 galaxies, but also their soft X-ray emission. This result is consistent with the scenario assumed for Seyfert 2 galaxies, since the opaque torus surrounding the nucleus would hide not only the UV emission associated to the active source but also a significant part of its soft X-ray emission due to absorption by neutral Hydrogen. For example, a detailed analysis of the UV and X-ray emission of NGC 1068 shows that a significant fraction of its soft X-ray emission could originate from the starburst episodes present around its nucleus. On the other hand, the hard X-ray flux would be underestimated by our models by more than two orders of magnitude, indicating that it is mostly contributed by the active source (Jiménez-Bailón et al., in preparation). A more extended analysis of some Seyfert 2 galaxies will be presented elsewhere.
6 Conclusions
In this work we have explored the X-ray emission originated in a star-forming region with only single stellar populations. The mechanical energy injected into the interstellar medium by stellar winds and supernova explosions will heat the diffuse gas to very high temperatures, and will be finally reprocessed into soft X-ray emission. We have found that the X-ray emission observed in starburst galaxies can be well explained assuming that a moderate fraction of the mechanical energy is finally reprocessed into X-ray emission. The rest of the mechanical energy released leads to the expansion of the gas, creating bubbles and gas flows at galactic scales. An interesting implication is that the age deduced from kinematical studies will result systematically lower than the one obtained from the analysis of the emission line spectrum if the heating of the gas and the X-ray emission is not taken into account. Additionally, the inclusion of X-ray transient systems, like SN explosions and Be/X-ray binaries showing bursts of X-ray emission, may lead to some degree of variability in the high energy emission of starburst galaxies.
We have computed the expected intensity of the nebular He ii 4686 Å, including the additional ionization of the gas by the soft X-ray emission originated in the diffuse gas. The observational values of the He ii/H ratios can be reproduced by our models assuming moderate efficiencies (about 20%) in the reprocessing of mechanical energies into X-ray emission. Alternatively, the mechanical energy reprocessing could not be a continuous process. This energy released by the massive stars could be “accumulated” in the form of accelerated gas flows, which would release all this accumulated energy only when the outflowing gas interacts with the static interstellar medium. Under this scenario the soft X-ray emission originated by the shocked gas would provide enough additional ionizing power to explain the observed He ii/H ratios. We have also shown that such ratios have a high intrinsic dispersion and that a deeper statistical study is necessary to investigate the source of the nebular He ii 4686 Å line.
We have compared the predicted soft X-ray emission with observational values for a sample of star-forming and Seyfert galaxies, aiming to disentangle the contribution of star-formation episodes to the total energy budget of low activity galaxies. We have found that while the high energy emission of Seyfert 1 galaxies is clearly above the predictions of starburst models, both the UV and soft X-ray emissions of many Seyfert 2 galaxies are apparently associated mostly to the (circum-)nuclear starburst episodes known to be present in these objects. The active source in Seyfert 2 galaxies would dominate therefore only at harder X-rays.
Acknowledgements.
We want to acknowledge the referee, Onno Pols, for his valuable sugestions that have allowed to improve the clarity of this paper. Useful comments have been provided by María de Santos and Pedro Rodríguez-Pascual. MC wants to acknowledge Daniel Schaerer for useful comments about the models and evolutionary tracks, Valentina Luridiana for useful comments about the manuscript, Roland Diehl and Stephan Plüschke for coments about superbubble evolution and Grayna Stasińska for very useful comments about the dispersion in the emission lines. MC wants to acknowledge the Instituto de Astrofísica de Andalucía for logistic support. We want also to thank Eduardo Fernandes Vieira and Carlos Rodrigo Blanco for useful comments. This work has been supported by Spanish CICYT ESP-95-0389-C02-02. MC has been supported by an INTA “Rafael Calvo Rodés” predoctoral grant, an ESA postdoctoral grant and a MPE grant.References
- Arnault et al. (1989) Arnault, Ph., Kunth, D., and Schild,H. 1989, A&A 224, 73
- Aschenbach (1998) Aschenbach, B. 1998, IAU Coll. 101, Cambridge University Press, p. 99
- Buzzoni (1989) Buzzoni, A. 1989, ApJS 71, 871
- Castor et al. (1975) Castor, J., Weaver, R. and McCray, R. 1975, ApJ, 200, L107
- Cerviño & Mas-Hesse (1994) Cerviño, M.,and Mas-Hesse, J.M. 1994, A&A 284, 749 (CMH)
- Cerviño et al. (2000a) Cerviño, M., Knödlseder, J., Schaerer, D., von Ballmoos, P. & Meynet, G. 2000, A&A 363, 970
- Cerviño et al. (2000b) Cerviño, M., Luridiana, V. and Castander, F., 2000b, A&A letters 360, L5
- Cerviño et al. (2002) Cerviño, M., Vals-Gabaud, D., Luridiana, V., and Mas-Hesse, J.M., 2002, A&A 381, 51
- Cerviño et al. (2001) Cerviño, M., Gómez-Flechoso, M.A., Castander, F.J., Schaerer, D., Mollá, M., Knödlseder, J., & Luridiana, V. 2001, A&A 376, 422
- Chlebowski et al. (1989) Chlebowski, T., Harnden, F.R., and Sciortino, S. 1989, ApJ 341, 427
- Chlebowski & Garmany (1991) Chlebowski, T., and Garmany, C.D. 1991, ApJ 368, 241
- Chu & Mac Low (1990) Chu, Y.-H., and Mac Low, M.-M. 1990, ApJ 365, 510
- Cid-Fernandes & Terlevich (1995) Cid-Fernandes, R., and Terlevich, R. 1995, MNRAS 272, 423
- Colina et al. (1997) Colina, L., García-Vargas, M.L., Mas-Hesse, J.M., Alberdi, A., and Krabbe, A. 1997, ApJ 488, L71
- Conti (1991) Conti, P.S. 1991, ApJ 377, 115
- Copetti et al. (1986) Copetti, M.V.F., Pastoriza, M.G., and Dottori, M.A. 1986, A&A 156, 111
- Cox (1972) Cox, D.P. 1972, ApJ 178, 169
- Dickel et al. (1990) Dickel, J., Norton, L., and Gensheimer, P. 1990 IAU Coll. 115, p.168
- Dickow et al. (1996) Dickow, R., Hensler, G., and Junkes, N. 1996, The interplay between massive star formation, the IMS and Galaxy Evolution D. Kunth, B. Guiderdoni, M. Heydari-Malayeri and T.X. Thuan (eds.) Editions frontieres, p.383
- French (1980) French, H.B. 1980, ApJ 240, 41
- González-Delgado et al. (1998) González-Delgado, R.M., Heckman, T., Leitherer, C., Meurer, G. Krolik, J., Wilson, A.S., Kinney, A., and Koratkar, A. 1998, ApJ 505, 174
- Heckman et al. (1995) Heckman, T.M., Dahlem, M., Lehnert, M., Fabbiano, G., Gilmore, D., and Waller, W.H. 1995, ApJ 448, 98
- Heckman et al. (1996) Heckman, T.M., Dahlem, M., Eales, S.A., Fabbiano, G., and Weaver, K. 1996, ApJ 457, 616
- Heckman et al. (1997) Heckman, T.M., González-Delgado, R.M., Leitherer, C., Meurer, G.R., Krolik, J., Wilson, A.S., Koratkar, A., and Kinney, A. 1997, ApJ 482, 114
- Kennicutt (1992) Kennicutt, R.C.Jr. 1992 ApJ 388, 310
- Kunth & Joubert (1985) Kunth, D. and Joubert, M. 1985, A&A 142, 411
- Kurucz (1991) Kurucz, R.L. 1991 in Stellar Atmospheres: Beyond Classical Limits ed. L. Crivellari, I. Hubeny & D. G. Hummer (Dordrecht: Kluwer), 441
- Legrand et al. (1997) Legrand, F., Kunth, D., Mas-Hesse, J.M. and Lequeux J., 1997, A&A 326, 929
- Leitherer et al. (1992) Leitherer, C., Robert, C. and Drissen, L. 1992, ApJ 401, 596
- Lequeux et al. (1995) Lequeux, J., Kunth, D., Mas-Hesse, J.M. and Sargent, W.L.W. 1985, A&A 301, 18
- Luridiana et al. (1999) Luridiana, V., Peombert, M., and Leitherer, C. 1999, ApJ 527, 110
- Maíz-Apellániz et al. (1998) Maíz-Apellániz, J., Mas-Hesse, J.M., Muñoz-Tuñón, C., Vílchez, J.M., and Castañeda, H.O. 1998 A&A 329, 409
- Mas-Hesse & Kunth (1991) Mas-Hesse, J.M., and Kunth, D. 1991, A&ASS 88, 399 (MHK)
- Mas-Hesse (1992) Mas-Hesse, J.M. 1992, A&A 253, 49
- Mas-Hesse et al. (1995) Mas-Hesse, J.M., Rodríguez-Pascual, P.M., Sanz-Fernandéz de Córdoba, L., Mirabel, I.F., Wamsteker, W., Makino, F., and Otani, C. 1995, A&A 298, 22
- Mas-Hesse & Kunth (1999) Mas-Hesse, J.M. and Kunth, D. 1998 A&A 349, 765
- Meynet et al. (1994) Meynet, G., Maeder, A., Schaller, G., Schaerer, D. and Charbonnel, C. 1994, A&AS 103, 97
- Persic & Rephaeli (2002) Persic, M. and Rephaeli, Y. 2002 A&A 382, 843
- Plüschke (2001) Plüschke, S. 2001, Ph.D. thesis, MPE), Germany
- Raymond & Smith (1977) Raymond, J.C., and Smith, B.W. 1997, ApJS 35, 419
- Schaerer & De Koter (1997) Schaerer, D., De Koter, A. 1997, A&A 322, 598
- Schaerer & Vacca (1998) Schaerer, D., and Vacca, W.D. 1998, ApJ 497, 618
- Schaerer et al. (1999) Schaerer, D., Contini, T. and Pindao, M. 1999, ApJS 136, 35
- Schaller et al. (1992) Schaller, G., Schaerer, D., Meynet, G., and Maeder, A. 1992, A&AS 96, 269
- Schmutz et al. (1992) Schmutz, W., Leitherer, C. & Gruenwald, R. 1992, PASP 104, 1164
- Silich et al. (2001) Silich, S.A., Tenorio-Tagle,G., Terlevich, R., Terlevich, E. and Netzer, H. 2001, MNRAS 324, 191
- Stasińska & Leitherer (1996) Stasińska, G., and Leitherer, C. 1996, ApJS 107, 661
- Stevens & Strickland (1998a) Stevens, I.R., and Strickland, D.K. 1998a, MNRAS 294, 523
- Stevens & Strickland (1998b) Stevens, I.R., and Strickland, D.K. 1998b, MNRAS 301, 215
- Strickland & Stevens (1999) Strickland, D.K., and Stevens, I.R. 1999, MNRAS 306, 43
- Strickland & Stevens (2000) Strickland, D.K., and Stevens, I.R. 2000, MNRAS 314, 511
- Summers et al. (2001) Summers, L.K., Stevens, I.R., and Strickland, D.K. 2001, MNRAS 327, 385
- Van Bever et al. (1999) Van Bever, J., Belkus, H., Vanbeveren, D., and van Rensbergen, W. 1999, New Astronomy 4, 173
- Van Bever & Vanbeveren (2000) Van Bever, J. and Vanbeveren, D. 2000, A&A 358, 462
- Wang & Helfand (1991) Wang, Q.D., and Helfand, D.J. 1991, ApJ 370, 541
- Wang (1999) Wang, Q.D. 1999, ApJ, 510, L139
- Woltjer (1972) Woltjer, L. 1972, ARA&A, 10, 129
- Woosley et al. (1995) Woosley, S.E., Langer, N., and Weaver, T., 1995, ApJ 448, 315
- Woosley & Weaver (1995) Woosley, S.E., and Weaver, T., 1995, ApJS 101, 181