Improved Astrometry and Photometry for the Luyten Catalog. II. Faint Stars and the Revised Catalog
Abstract
We complete construction of a catalog containing improved astrometry and new optical/infrared photometry for the vast majority of NLTT stars lying in the overlap of regions covered by POSS I and by the second incremental 2MASS release, approximately 44% of the sky. The epoch 2000 positions are typically accurate to 130 mas, the proper motions to , and the colors to 0.25 mag. Relative proper motions of binary components are meaured to . The false identification rate is for and substantially less at brighter magnitudes. These improvements permit the construction of a reduced proper motion diagram that, for the first time, allows one to classify NLTT stars into main-sequence (MS) stars, subdwarfs (SDs), and white dwarfs (WDs). We in turn use this diagram to analyze the properties of both our catalog and the NLTT catalog on which it is based. In sharp contrast to popular belief, we find that NLTT incompleteness in the plane is almost completely concentrated in MS stars, and that SDs and WDs are detected almost uniformly over the sky . Our catalog will therefore provide a powerful tool to probe these populations statistically, as well as to reliably identify individual SDs and WDs.
1 Introduction
In Paper I (Gould & Salim, 2002), we discussed the motivation for improving the astrometry and the photometry of the high proper-motion () stars in the New Luyten Two Tenths (NLTT) Catalog (Luyten, 1979, 1980), and we outlined our basic strategy for obtaining these improvements: at the bright end, match NLTT star to entries in the Hipparcos (ESA, 1997), Tycho-2 (Høg et al., 2000), and Starnet (Röser, 1996) catalogs and, at the faint end, find counterparts of USNO-A (Monet, 1996, 1998) stars in 2MASS (Skrutskie et al., 1997) whose position offsets are predicted by the proper motions listed in NLTT. We carried out the bright-end search and used the results to characterize the position and proper-motion (PPM) errors of the NLTT.
Here we complete the catalog (in the regions covered by the first 2MASS release and the first Palomar Observatory Sky Survey – POSS I) by carrying out the faint-end search, and we integrate the results of both searches. This paper therefore has three interrelated goals. First, to give a comprehensive account of how the catalog was constructed and of the various tests we performed to determine the accuracy of our identifications and our proper-motion measurements. Second, to characterize the properties of the original NLTT catalog, now that much better astrometry and photometry are available for a large fraction of its stars. Third, to characterize the properties of the catalog we have constructed, including its precision and its completeness relative to NLTT. We expect that the importance of the first and third goals are obvious to the reader, but the reasons for characterizing the NLTT just at the time when it is being superseded may not be.
First, in constructing the present catalog, we made heavy use of all aspects of NLTT including not only its positions, proper motions, and photometry, but also its extensive notes on binaries. Our approach to carrying out this work was heavily influenced by our assessment of NLTT’s properties, and hence ours catalog’s construction and limitations cannot be fully understood without a knowledge of these properties. Second, the publication of NLTT was a watershed in the history of astronomy: the lengthy list of papers that we cited in Paper I comprise but a tiny fraction of the literature that is based directly or indirectly on NLTT. A good understanding of the NLTT’s properties will be useful in assessing which of the conclusions drawn by these papers can be relied upon, and which require further refinement. Third, more work revising the NLTT remains to be done. For technical reasons that will be described below, our catalog will cover only the portion of the sky . And, of course, as of now it is restricted to the of sky covered by the 2MASS second incremental release. Hence, for the present, the original NLTT remains the best source of information for 23,000 of its 59,000 stars.
2 Strategy for Matching NLTT to USNO-A and 2MASS
2.1 Error Characterization
In Paper I, we showed that, at least at the bright end, NLTT position errors have several characteristic scales. For the majority of stars, the positions are measured to a precision of , although they are recorded only to 1 s of time in RA and of arc in DEC111About are recorded to worse precision: 6 s of time and of arc. See below.. For most of the remainder, the intrinsic measurement errors are although, again, the errors in the tabulated values are somewhat increased by decimal truncation. However, there is also a “halo” of position errors extending out to several arcmin, as well as a handful of outliers with much greater errors. The proper motion errors were found to be “correlated” with the position errors in the sense that the stars with the better position measurements also have better proper motion errors (), while those with worse positions have somewhat larger proper motion errors (). These characteristics motivated a basically two-tiered approach to matching bright NLTT stars with the PPM catalogs, and it will also motivate a two-tiered approach here.
2.2 Scope of the Faint Search
As mentioned in Paper I, we wish to push our “faint” search as bright as possible, thereby maximizing overlap with the bright search. While we expect that the overwhelming majority of the bright-search matches between NLTT and the three PPM catalogs (Hipparcos, Tycho-2, Starnet) are genuine, there is an important path to false matches. The true counterpart of the NLTT star may not be in any of the three PPM catalogs. Then, even though the real star may (most likely does) have a PPM that is very close to its NLTT values, our bright-star approach is to search farther and farther from the NLTT PPM in these catalogs. Eventually, we may find a barely acceptable match in these catalogs. Such cases will be easily uncovered by cross-checking the bright and faint searches.
However, we cannot push our faint-star approach of matching counterparts from USNO-A and 2MASS too bright because bright stars are increasingly saturated in the POSS plates that were scanned to construct USNO-A, leading to increasingly unreliable PPMs and even identifications.
We therefore begin the “faint” search by removing from consideration all stars that were matched to Hipparcos in the first two (“rectangle” and “circle”) searches carried out in Paper I. The Hipparcos completeness limit assures us that essentially all the very bright stars in NLTT are accounted for in this way. Moreover, the high-proper motion stars that entered the Hipparcos input catalog beyond its magnitude limit were drawn almost entirely from NLTT. (This is confirmed by the fact that in Paper I, essentially all Hipparcos high proper-motion stars were successfully matched to NLTT. By contrast, for Tycho-2, whose magnitude range strongly overlaps that of Hipparcos but was not constructed from an input catalog, there were several hundred non-matches.) Hence, the probability that the “best” match of a Hipparcos star to NLTT is a false match is very low. However, from the faint search we do not exclude Hipparcos stars that were matched using our more aggressive strategies, in order to have an additional check on the robustness of these identifications.
Next, we restrict our search to portions of the sky covered by the (circa 1950) POSS I survey (), since our entire approach fails farther south. USNO-A is a positional (and photometric) catalog, which is constructed by matching blue and red photographic plates. In order to minimize the number of artifacts masquerading as stars, USNO-A requires blue and red detections with position differences less than . Hence, in the non-POSS I areas of the sky, where the blue and red plates were taken many years apart, all stars with sufficiently high proper motion will necessarily be absent. For example, if the plates were taken 8 years apart, then the catalog will not contain any stars with . This does not pose any problem for regions covered by POSS I because its blue and red plates were taken sequentially. Farther south, however, the plate epochs differ by of order a decade. There is a further wrinkle here. The first version of the USNO-A catalog, USNO-A1 (USNO-A1.0), is constructed by scanning POSS I plates all the way to their southern limit () and supplements POSS I with additional southern surveys only south of this limit. However, USNO-A2 (USNO-A2.0), which has somewhat better precision, exploits southern catalogs in place of POSS I for the region . Hence, we conduct our search using USNO-A2 wherever possible, but supplement this with USNO-A1 where necessary.
2.3 The “Rectangle”
We divide the search into two principle stages, which we dub the “rectangle” and the “circle”. In the rectangle stage, we first identify all USNO-A stars (NLTT candidates) that lie within a rectangle222We consider genuine USNO stars throughout: entries added from Tycho are ignored. centered on the position predicted by using the reported NLTT proper motion to propagate the (epoch 1950) NLTT catalogued position to the epoch of the POSS plate underlying USNO-A. We then predict the position of the 2MASS counterpart of each such USNO-A star under the assumption that its proper motion is as given by NLTT. We use a map of 2MASS coverage to determine if the star should lie within the 47% of the sky covered by the second 2MASS incremental release and, if it should, what the exact 2MASS epoch is at that position. We then query the 2MASS data base for all stars lying within of this position. The size of this error circle is influenced primarily by the errors in NLTT proper motions, which are expected from Paper I to be about for stars in the rectangle. Since the difference in epochs is typically about 45 years, this translates to a error in predicted position in each dimension, far larger than the mas and mas position errors in 2MASS and USNO-A, respectively. A circle will therefore capture all but the extreme outliers. Ideally, only the USNO-A candidate actually corresponding to the NLTT star will have a 2MASS counterpart because static stars will not match to anything in 2MASS. In general, this query can have 3 possible outcomes, and we can therefore define 3 classes of stars: non-matches, unique matches, and multiple matches.
2.4 Unique Matches
Unique matches are those NLTT stars for which our procedure generates one and only one 2MASS counterpart. Because the area covered by the rectangle is quite small, the overwhelming majority of unique matches should be genuine, even though we have not yet imposed any magnitude constraint on the selection procedure. We can therefore use the unique matches to study the color-color relations of counterparts in NLTT, USNO-A, and 2MASS. First, we find from the overlap of USNO-A1 and USNO-A2 stars that the mags are not on the same system in the two versions of the catalog, which deviate by up to 1 mag. We obtain
| (1) |
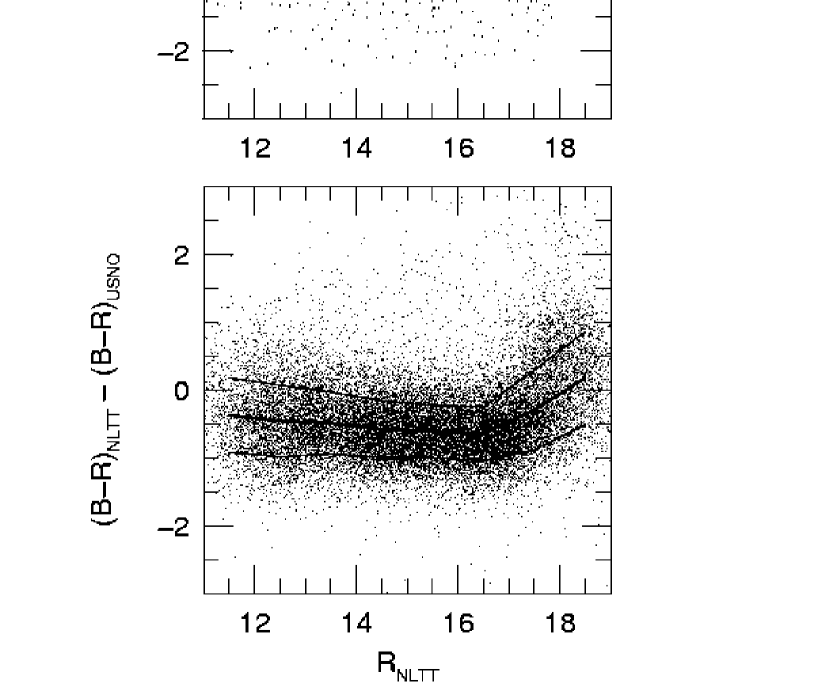
and otherwise. Henceforth, when we write it refers to magnitudes converted to the USNO-A2 system. However, in the actual catalog we report the original USNO-A1 magnitudes for stars identified in that catalog. Next we compare USNO and NLTT photometry. Figure 1 shows this comparison (for our full catalog, not just the rectangle matches) as a function of . Clearly, there are strong nonlinearities. We model these by,
| (2) |
and for , and by
| (3) |
Note that is called “photographic magnitude” in NLTT.
Finally, we obtain very rough optical/IR color-color relations between USNO and 2MASS bands,
| (4) |
These last relations have a huge, 0.8 mag, scatter, and are not even continuous. They nonetheless are extremely useful in assessing the quality of candidate matches.
2.5 Multiple Matches
Each multiple match is investigated and resolved by hand. The primary cause of multiple matches is common proper motion (CPM) binaries. Sometimes there are two UNSO-A stars that each match to the same two 2MASS stars. In such cases, there is always a NLTT CPM binary. This is because USNO-A does not resolve binaries with separations , whereas Luyten was able to resolve these easily by eye. Hence these cases are always resolved unambiguously by making use of the NLTT supplementary notes on CPM binaries. More frequently, there are two 2MASS stars matched to one USNO-A “star”, which is actually an unresolved binary. In the great majority of these cases, NLTT shows a CPM binary, so these are also easily resolved. In such cases, however, we cannot use the USNO-A position to obtain a reliable new proper motion since it is a blend of two stars. For such stars, our catalog has an improved 2000-epoch position and new and photometry, but not an improved proper motion nor better visual photometry (which is obtained from USNO). In some two dozen cases, we resolve the multiple match by finding a probable CPM binary that Luyten missed. Some of these binary candidates can be confirmed by investigating POSS I and POSS II images, but in most cases the companion is too faint in the optical band or is blended in the POSS images because the separation is of order or less. We will present these new binary companions in a future paper on NLTT binaries. Finally, for each resolved multiple match, as well as for each unique match, we compare the and mags reported by USNO with the values that would be predicted on the basis of NLTT and of 2MASS photometry using the color-color relations established in § 2.4. Even though these relations have large errors, they still help to identify wrong matches because random pairs of unrelated stars are likely to differ by many magnitudes, so by this standard even measurements with 0.8 mag errors can be very effective. The outliers are regarded as suspicious and put aside, while the remainder are accepted.
2.6 Rectangle Non-matches
Operationally, there are two classes of non-matches: 1) there are no USNO-A stars in the rectangle or 2) there are such stars but they all fail to match with 2MASS stars. Class (1) can occur because A) the NLTT position is in error by more than the size of the rectangle (as we showed in Paper I is the case for a sizeable minority of NLTT stars), or B) USNO failed to detect the star. Class (2) can occur because A) the NLTT position is in error and there just happens to be an unrelated USNO star in the rectangle, B) the USNO star is the correct match but 2MASS has failed to detect the star, or C) the USNO star is correct but the NLTT proper motion is so far off that the 2MASS counterpart lies outside the error circle. We ultimately attempt to distinguish among these five causes in § 4 but for the moment assume that that the correct USNO match lies outside the rectangle and continue our search for it in the circle in § 2.7.
2.7 The “Circle”
We now remove from consideration all NLTT stars that were successfully matched to USNO-A stars in the rectangle. The great majority of the remainder are unmatched. However, a small number were matched in the rectangle search, but are regarded as questionable matches because they are photometric outliers as determined using the relations in § 2.4. We search for USNO-A/2MASS counterparts to both classes of stars by probing a circle of radius in USNO-A centered on the NLTT position (updated using the NLTT proper motion to the epoch of the USNO-A POSS plate). Because the area being probed is now 350 times larger than in the rectangle search, the probability of false matches is proportionately larger. We therefore take several steps to reduce such false matches.
First, we demand that . These are approximately limits, as we established in § 2.4. (Some NLTT stars do not contain an entry for , in which case we us mags.) Second, when we query the 2MASS data base at the 2MASS-epoch position, we ask whether the 2MASS star has any USNO-A stars within and if so what the separation and mags of the closest one are. If the 2MASS star is associated with a USNO-A star at approximately the same position, we do not immediately eliminate the 2MASS star, but rather flag it. If the association is real, the 2MASS star could not be the genuine counterpart of the NLTT star because its proper motion would be , far below the NLTT threshold. However, the association might be due to chance proximity of a random field star. At high latitude, the probability of such a chance alignment is low, but in the difficult fields of the Galactic plane, it is not. We also do a reverse check: we ask whether there are 2MASS stars associated with USNO candidates (assuming no proper motion) within . The presence of a 2MASS star near the USNO 1950-epoch positon will also indicate that the USNO candidate is not a NLTT star.
For a large fraction of the difficult cases, we directly consult the digitized sky survey (DSS). This normally contains images from two well-separated epochs (POSS I and II), and thus usually allows one to spot the high proper-motion star. However, for the southern zones (approximately coincident with our USNO-A1 areas), the two DSS epochs are very close in time, making it extremely difficult to spot moving stars. In some cases, we therefore consult the USNO web site, which contains digitized POSS I, but the cycle time for such searches is about 20 minutes, so this cannot be done in every case. This mostly affects regions very close to the Galactic center.
The multiple matches are more complex than in the rectangle case. We again have large numbers of CPM binaries. These are usually easier to untangle than in the rectangle case because they are typically farther apart and so are resolved in USNO. It is then only necessary to check that the relative orientation of the 2MASS/USNO stars is the same as that given by the NLTT notes. However, there are now a large number of spurious matches. In a handful of cases, these turn out to be CPM companions of NLTT stars that were not found by Luyten. We will present these in a forthcoming paper. Unlike the CPM binaries found in the rectangle, these are mostly well enough separated that they are resolved in USNO. The great majority of the spurious matches are pairs of unrelated USNO-A/2MASS stars. We track these down using a variety of photometric and astrometric indicators and by consulting DSS, as discussed above.
2.8 Rectangle and Circle Summary
The entire procedure described above is carried out separately for USNO-A2 () and for USNO-A1 (). In each case, we demand that the entry originate from POSS I. The two catalogs are then combined, giving precedence to USNO-A2 when a match is found in both. In practice, we find a fairly sharp boundary at . Table 1 shows the number of matches in the four categories (rectangles,circles)(unique,resolved), for each of the two USNO catalogs, A1 and A2. Of the 23,681 USNO/2MASS matches, 18,442 (78%) lie inside the rectangle. The overwhelming majority of these are unique matches, and even the 3% that had multiple matches were relatively easy to resolve. Note that even for the majority of cases in which the star lay in the circle, there was only one USNO/2MASS pair whose separation was consistent with the NLTT proper motion. Thus, the high quality of the NLTT PPMs, combined with the paucity of stars over most of the sky, allowed us to match over 20,000 stars in two catalogs with very different passbands, at widely separated epochs, with “only” about a 1000 problem cases.
However, these cases, which were mostly concentrated in Galactic plane, were often quite difficult to resolve. As is well-known, optical and infrared images of the plane are each extremely crowded, but often not with the same objects, and this fact generally gave rise to dozens, sometimes more than 100, false matches for a single NLTT entry. The correct match had to be laboriously identified from among these. Thus, our method, which works amazingly well away from the plane, tends to become extremely bogged down within it. An alternative approach to finding proper motion stars in the plane, albeit one that would miss many red stars, would be to compare blue plates in which the majority of background stars would be removed. In 9.2 we will see that that is exactly what Luyten did!
3 Comparison with PPM
Before trying to deal with the residual nonmatches from the rectangle/circle search, we first reconcile our results with the search for matches with PPM catalogs (bright stars), which was described in Paper I. Disagreements will yield clues to possible problems with each of the two approaches as well as an estimate of the false identification rate for cases in which the NLTT star is identified in only one of the two methods, which constitute the vast majority.
We begin by examining the 27 cases for which a USNO star was found in the rectangle with no counterpart being found in 2MASS, but for which the NLTT star was identified in a PPM catalog. In 23 of these 27, the USNO identification was correct. For 18, the 2MASS match failed because the NLTT proper motion error was larger than , and therefore put the 2MASS counterpart outside the error circle. For the remaining five, the star was not in 2MASS despite the fact that it was in an area nominally covered by the 2MASS release. In the remaining 4 cases, the USNO identification was incorrect. In three of these, the USNO/NLTT magnitude differences were too large to make a plausible match (but recall that the reason for permitting such large differences is the prospective confirmation from a 2MASS counterpart, which in this case is absent). That is, among the 24 cases for which the NLTT/USNO rectangle match seemed plausible, in 23 cases it was correct. The fact that there are few false USNO/NLTT matches in the rectangle, even when there is no identifiable 2MASS counterpart, is the basis for the aggressive effort to identify nonmatches that we describe in § 4.
Next we examine the 1922 cases for which the NLTT star was identified in both the PPM and USNO/2MASS searches. In 53 of these, the two methods identified different stars. However, 28 of these 53 involved problems with the mis-identification of binary components, all of which would have come to light and been corrected when we examine CPM binaries in § 4.4, even if they had not been in this small overlap sample. Hence, we focus on the remaining 25 cases.
Ten of these 25 were caused by problems in PPM. For one, a bad Starnet proper motion for the correct optical star led to the identification of the wrong 2MASS counterpart. In all nine others, the true optical star was too faint to appear in the PPM catalogs, and another match was found as the search criteria were gradually degraded. This is exactly the problem that was foreseen for this method. For the areas of the sky that are covered by our faint search, this problem was “automatically” corrected by this comparison. However, since our faint search has been carried out only in the overlap of the 2MASS release with POSS I, which covers 44% of the sky, we expect that there remain about such wrong identifications over the rest of the sky. Eventually, when all of 2MASS is released, the those with will be spotted. However, this will leave the remaining 23% of the sky unchecked in which, we extrapolate, there are only 5 false identifications.
The other 15 cases were caused by problems with the USNO/2MASS search. In 6 cases, a USNO star was found inside the rectangle and a 2MASS counterpart was found to this star, but there was actually a much better match outside the rectangle. This is the major potential difficulty with our method: if we find what looks like a reasonable match in the rectangle, we do not look farther. Otherwise our search would become unwieldy. For four of these six, the USNO/2MASS magnitude discrepancy was large. Based on this finding, we eventually removed all matches for which this discrepancy exceeds 3 mag. In another 6 cases, USNO did not contain the correct star and so the search found another star and managed to match it with a 2MASS star. However, all 6 cases are eliminated by our subsequently adopted cut on USNO/2MASS magnitude discrepancies. In two cases, NLTT position or proper-motion transcription errors led to the identification of a spurious USNO/2MASS pair, and in one case we chose the wrong one of two neighboring 2MASS stars as the counterpart of the correctly identified USNO star.
That is, after implementing our cut on USNO/2MASS magnitude discrepancies, there were only 5 out of 1922 cases, where we obtained a false identification.
Finally, there are 80 stars that were found in Tycho-2 or Starnet but not in the USNO/2MASS search. Of these, 15 are unresolved binaries. Another 34 result from severe (usually transcription) errors in NLTT: either they lie outside the USNO search circle (16) or they had very large proper-motion errors (18). Another 7 are so bright that they fail to appear in USNO, and 9 others are in the dense Galactic center fields where we have an especially difficult time identifying stars. Three others had various miscellaneous causes and the remaining 12 had no identifiable cause. The binaries would be caught in the investigation summarized in § 4.4. In § 4, we describe our method to recover most of the stars with large proper motion errors. Bright stars are not a problem beyond the magnitude range of the PPM surveys. The remaining 40 cases constitute somewhat over 2% of the 1800 Tycho-2+Starnet matches with USNO/2MASS.
In brief, based on this comparison of the results of the PPM search and the USNO/2MASS search, we believe that our false identification rate is well below 1% and we anticipate that we will fail to match about 2–3% of NLTT stars (until we reach the flux levels where USNO and 2MASS become seriously incomplete).
4 Additional Matches
Based on our analysis of the cases in which the PPM search found the NLTT star but the USNO/2MASS search did not, we conduct four additional types of searches, which we dub “annulus”, “2MASS-only”, “USNO-only”, and “CPM”. The first is aimed at finding 2MASS counterparts to USNO stars in cases for which the NLTT proper motion is seriously in error, including the possibility that there is a transcription error in the direction of proper motion. Hence the search is conducted in an annulus around the position of the unmatched USNO star.
The second and third searches are designed for cases in which the star is, for some reason, absent from USNO or 2MASS. A major cause of missed stars in these catalogs is simply that they are too faint. Since NLTT contains a substantial number of stars to and 2MASS is complete roughly to , some blue stars with will be lost. Fortunately, while there are a substantial number of stars with in NLTT, the vast majority of them are intrinsically bright main-sequence stars or subdwarfs and so, given the proper motion limit , are not affected by the 2MASS magnitude limit. However, some subdwarfs and many white dwarfs are affected.
USNO requires that a star be identified on both the blue and red plates, and so misses faint stars of extreme color, primarily faint red stars, which are found mainly at the bottom of the main sequence. However, it should be noted that both USNO and 2MASS occassionally miss much brighter stars, primarily because of saturation by or confusion with a neighboring star, but sometimes for no reason that we can identify. That is, occassionally we find an isolated, reasonably bright star on the images that is simply not in the catalog. Although the fraction of such cases is small, this small fraction is multiplied by 23,000 in our search.
The last search is for stars that NLTT identifies as CPM companions to stars that we have identified in either the USNO/2MASS or PPM search. As we will show in § 7.4, NLTT relative astrometry of these pairs is usually very accurate, even in cases for which its absolute astrometry is poor. Hence these companions are usually easy to find. This search technique can therefore provide an independent measurement of the false identification rate in our overall USNO/2MASS search. This is very important because it is possible that the low (0.3%) misidentification rate that we found in § 3 could have been a result of the fact that we were testing only the brightest of the USNO/2MASS stars.
The most important step we take to avoid contamination in the first three searches is to essentially restrict them to the rectangle where, as discussed in § 3, contamination is very low. Stars whose NLTT position is outside the rectangle will therefore not be identified in these searches.
4.1 The Annulus
In the PPM search described in Paper I, we found many examples of transcription errors of all types in NLTT, including in the position angle of the proper motion. We therefore search for 2MASS stars in an annulus around the position of all USNO counterparts lying within the NLTT rectangle but without previous 2MASS matches. To also allow for a substantial error in the NLTT value for the amplitude of the proper motion, , we set the inner and outer and outer radii of the annulus at . Here and are the respective epochs of the 2MASS and USNO observations. Queries of the 2MASS database allow one to ask for the nearest USNO star within . We accept 2MASS stars only if they do not have a plausible USNO counterpart as determined from the consistency of the optical/IR colors of the two catalog objects relative to the predictions of equation (4) and their relative position offset. We also check that the USNO rectangle star does not have a plausible 2MASS counterpart at small separation, which would also indicate that it is not a proper motion star. Occassionally we find a 2MASS counterpart to the USNO star near the outer edge of the search radius which, given the year baseline, could only be a real counterpart if the proper motion were . In this case we permit the identification provided that the position angle is reasonably consistent with NLTT. In total, we find 50 stars in the annulus, or 0.2%, substantially smaller than the 1% (18/1800) that were identified in the overlap with Tycho-2+Starnet in § 3. This may be because the PPM search was more aggressive than the one we have conducted here (since it could make use of additional proper-motion information).
4.2 2MASS-Only Identifications
When no USNO/2MASS match is found either in the circle or the rectangle, and when there is no USNO candidate within the rectangle, we hypothesize that the NLTT position is correct to within the precision of the rectangle, but that the star is absent from USNO. We therefore predict the position of the star at the 2MASS epoch assuming that the NLTT 1950 position and proper motion are correct. We then search for 2MASS counterparts of the NLTT star in a radius of around this position to allow for NLTT PPM errors. As in the annulus search, we reject 2MASS stars that have plausible USNO counterparts. Of course, the result of this search yields only a position and IR photometry, but not a new proper motion. In all, this search yields 862 2MASS-only identifications.
4.3 USNO-Only Identifications
When a valid USNO counterpart (one without an associated 2MASS star having consistent optical/IR colors and lying within a few arcsec) of the NLTT star is found within the rectangle, but it is not matched with a 2MASS star either in the original search or the annulus search, we assume that the star is absent from 2MASS and accept the USNO/NLTT identification, provided that the USNO/NLTT magnitudes are consistent. In these cases, we obtain a new position and new optical photometry, but no new proper motion. In all, this search yields 409 USNO-only identifications. We argue in § 9.3 that most of these stars are WDs.
4.4 Common Proper Motion Companions
The notes to NLTT contain references to more than 2400 pairs that Luyten considered to be CPM binaries or possible binaries. Unfortunately, it would require substantial advances in artificial intelligence software to extract all of this information in a completely automated way. The biggest single problem is that, for some reason, Luyten refused to name a large numbers of the objects in his catalog. In these cases, he will have a note to one star such as “comp. to prec. star”. Sometimes the companion will be the preceeding star, but very often it will be several preceeding, or occassionally following. Often, when there is a reference to a named star, the meaning of the reference is clear only from context. In brief, it seemed impossible to make sense of these references in an automated way. Mercifully, for stellar pairs that Luyten believed to be CPM binaries, he almost always recorded the same proper motion for both components, even when (as we will show in § 7.5) he was able to measure the difference. This permitted us to adopt a different approach.
First, we create our own naming system: each NLTT star is named for its sequential number in the elctronic version of the catalog, from 1 to 58,845. Next, we run a program to find all notes that might plausibly be interpreted as indicating that the star is a component of a binary or multiple system. Normally, these contain a separation and position angle relative to a primary, but sometimes they are more ambiguous. We then find all NLTT stars within one degree of the noted star that have identical NLTT proper motions (magnitude and position angle). If any of these stars had been identified in either the PPM or USNO/2MASS searches, we print out the catalog entries as well as all the notes that are associated with all of these stars. If two or more of these stars have been identified, we also print out the separations and position angles of all pairs. We then review this output, tracking down discrepancies when we have two or more identifications and our relative astrometry is in conflict with NLTT’s, and we interactively query the 2MASS data base to search for additional matches when the companion is not already in our data base. After updating our catalog with these results, we run a second program that finds only those notes that it can parse well enough to determine a predicted separation and position angle. It assumes that this vector separation applies to all pairs of NLTT stars with the same proper motion and lying within 1 degree. If our catalog contains entry pairs that disagree with this separation by more than 20% or with the position angle by more than , or if we do not have an entry for one component but do have an entry with 2MASS identification for the other, it flags this system. All such flagged systems are reviewed and the 2MASS data base is searched for unmatched companions.
This search yields 137 CPM companion identifications, of which 59 are corrections to previously incorrect 2MASS identifications. Of these 59, 47 are components of binaries for which our USNO/2MASS search found the same star for both components. Our algorithm is prone to such errors because it treats each component separately, and we intended to sort out these discrepancies at the time we reviewed all binary matches. They therefore do not represent real mismatches. However, the remaining 12 are genuine misidentifications: if these stars, which were treated by our algorithm as individuals, did not happen to belong to CPM binaries, we would never have recognized the error. Since, there are a total of 1235 stars in CPM binaries that were matched to USNO/2MASS, this represents a false-identification rate of about 1%. Alternatively, one might want to consider only those stars in CPM binaries with separations greater than in order to probe a sample that is not severely affected by confusion with a nearby high-proper motion source. This would be a fairer proxy to the conditions that the algorithm faced for the majority of single stars. In this case, we get 6 misidentifications out of 784 stars. Or, for a more conservative , we get 4 misidentifications out of 442 stars. That is, our estimated misidentification rate is consistently 1%. This rate is about three times higher than the 0.3% rate we estimated from comparison with PPM stars. Most likely, this is because brighter stars are rarer, and hence the possibility that a random unrelated USNO/2MASS pair will mimic a given high-proper star is smaller. In any event, we consider a 1% misidentification rate to be quite good.
Since the CPM search was conducted after the search for 2MASS-only stars, we can use it to check the reliability of the 2MASS-only identifications. There are 34 2MASS-only stars that lie in CPM binaries in addition to the 137 companion identifications discussed above. The relative positions of all 34 stars are consistent with the values in NLTT, and in this sense all 34 “pass the test”. However, of these 34, 26 are from 13 CPM pairs both components of which are identified only in 2MASS. Since we processed both stars from a pair simultaneously, we had knowledge of their CPM nature and offsets, and so these 26 do not constitute the a fair test. The remaining 8 stars are companions of independently identified NLTT stars, and so are a good proxy for single stars. The statistical significance of this test is modest because of small number statistics, but at least it has the right sign. One of the 8 is a companion to a USNO-only star, which does not have an independent proper motion. The remaining 7 are additional CPM companions each of whose proper motions can be inferred from that of its companion. This brings the total of such CPM companions to 144.
5 Description of Catalog
The catalog contains information grouped in six sections, 1) summary, 2) NLTT, 3) source identifications, 4) USNO, 5) 2MASS, 6) binaries, plus the last column which is an internal reference for debugging.
5.1 Summary Information
This section contains 11 entries: 1) the NLTT number (drawn consequentively from 1 to 58,845), 2) a letter code ‘A’, ‘B’, or ‘C’ if the NLTT “star” has been resolved into several sources, 3) (2000, epoch and equinox), 4) (2000), 5) , 6) , 7) , 8) (all four in arcsec yr-1), 9) , 10) , 11) 3-digit source code.
The three digits of the source code refer to the sources of the position, proper motion, and photometry. 1 = Hipparcos, 2 = Tycho-2, 3 = Tycho Double Star Catalog (TDSC, Fabricius et al. 2002), 4 = Starnet, 5 = USNO/2MASS, 6 = NLTT, 7 = USNO (for position) or common proper motion companion (for proper motion). More specifically, “555” means 2MASS based position, USNO based photometry, and USNO/2MASS based proper motion.
The (2000) position has been evolved forward from whatever epoch it was measured using the adopted proper motion. When the positon source is Hipparcos, Tycho-2, or TDSC, the position is given in degrees to 6 digits, otherwise to 5 digits. For proper motions derived from a PPM catalog, the errors are adopted from that catalog. Proper motions from USNO/2MASS determinations have an estimated error of is accordance with the results from § 7.1, below. NLTT proper motions are as found in § 8.1. CPM binary companions (without other astrometry) are not assigned an error, and zeros are entered into the error fields.
As described in Paper I, refers to the Johnson entry for Hipparcos, Tycho for Tycho-2 and TDSC, and Guide-star catalog for Starnet. The conversion from USNO photometry is given by Salim & Gould (2000),
| (5) |
We remind the reader that for USNO-A1 photometry, we first convert to USNO-A2 using equation (1) before applying equation (5). When NLTT photometry is used, is evaluated using equations (2) and (3) to convert to USNO mags, and then applying equation (5). In the rare cases for which NLTT photometry is employed and one of the two bands is not reported, a color of is assumed. No effort has been made to “de-combine” photometry in the case of unresolved binaries. For example, if a binary is resolved into two stars in 2MASS, but is unresolved in USNO, then different band measurements will be reported for the two stars, but both with have the same, combined-light photometry. The color reported in field 10 will be the simple difference of these two numbers. Similarly, if the NLTT “star” is resolved by TDSC but not 2MASS, then the light will be partitioned between the two stars but not the light. Finally, note that if no band photometry is available (whether because of saturation, faintness, or the star being in an area outside the second incremental 2MASS release) is given as
When multiple sources of information are available, the priority for what is presented in the summary is as follows. Positions: 3,1,2,5,4,7,6; Proper Motions: 3,2,1,5,4,7,6; Photometry: 3,1,2,5,4,6.
As discussed in Paper I, Tycho-2 proper motions are given precedence over Hipparcos primarily because they better reflect the long-term motion when the stars are affected by internal binary motions, but also because at faint magnitudes they are generally more precise. When Hipparcos proper motions are given, it is often because the star is so faint that it does not show up in Tycho. In this case, the nominal Hipparcos errors are often quite large and true errors can be even larger. We found a handful of cases by chance in which the Hipparcos proper motion was grossly in error and we removed the Hipparcos entry and substituted the USNO/2MASS value. However, we made no systematic effort to identify bad Hipparcos proper motions.
Only stars for which we are providing additional information are recorded in the catalog. There are 36,020 entries for 35,662 NLTT stars including a total of 723 entries for 361 NLTT “stars” that have been resolved in TDSC.
5.2 NLTT Information
The next 6 columns give information taken from NLTT, namely 12) (2000), 13) (2000), 14) , 15) , 16) , 17) . The coordinates and proper motions are precessed from the original 1950 equinox to 2000, and the position is updated to 2000 epoch using the NLTT proper motion.
5.3 Source Information
The next 2 columns give source information. Column 18 is the Hipparcos number (0 if not in Hipparcos). Column 19 is the identifier from TDSC, Tycho-2, or Starnet, whichever was used to determine the position in columns 3 and 4. When the position comes from Hipparcos, 2MASS, or USNO, or NLTT, “null” is entered in this field with one exception: when a Starnet measurement has been superseded by a 2MASS measurement, the Starnet identifier has been retained for ease of recovery of this source. It can easily be determined that the summary information comes from 2MASS because the first digit in field 11 will be a “5”.
5.4 USNO Information
The next six fields give USNO information: 20) Integer RA, 21) Integer DEC, 22) , 23) , 24) USNO Epoch, 25) 3-digit search-history code. The Integer RA and DEC together serve as a unique USNO identifier since that is the form RA and DEC are given in the original USNO-A1 and USNO-A2 releases. They can also be converted into degree and (at the USNO epoch) using the formulae: = (Integer RA)/360000, = (Integer DEC). Regarding the 3-digit search history code, the first digit tells which USNO catalog the entry is from: 1 = USNO-A1, 2 = USNO-A2. The second tells whether the USNO source was found in the rectangle (1) or the circle (2). The third tells whether it was a unique match (1), or had to be resolved by hand from among several possible matches (2). If there is no USNO information, all of these fields are set to zero.
5.5 2MASS Information
The next six fields contain 2MASS information: 26) , 27) (both at 2MASS Epoch), 28) , 29) , 30) , 31) 2MASS Epoch. If no 2MASS data are available, all fields are replaced by zeros. If there are 2MASS data, but not for a particular magnitude measurement, that value is replaced by .
5.6 Binary Information
The next six fields contain information about binarity: 31) binarity indicator, 32) NLTT number of binary companion, 33) NLTT estimated separation, 34) NLTT estimated position angle, 35) our estimated separation, 36) our estimated position angle. Regarding the binarity indicator, 0 means NLTT does not regard this as a binary. Otherwise, it is a NLTT binary and the indicator is set according to whether the companion is (2) or is not (1) in our catalog. The NLTT estimates of the separation position angle come from the NLTT Notes. Our estimates come from the difference of the 2000 positions of the two stars. In cases for which the companion is not in our catalog, the fields with “our” separation and position angle are replaced by values found from the difference of the NLTT coordinates (i.e., fields 12 and 13). As discussed in § 4.4, the companion numbers are based on what we think is obviously what Luyten intended, rather than what was literally written down. However, no effort has been made to clean up any other transcription errors, even when these are equally obvious. No binary information is recorded in these fields about NLTT “stars” that were resolved by TDSC. Rather, the reader should recognize each of those binaries from the upper case letter appended to its NLTT number (column 2).
The final column (37) is an integer that is used in the program that assembles the catalog from the various subcatalogs that are described in Paper I and in § 2 and § 4 of this paper. It is useful mainly to us, but for completeness: 1 = PPM+2MASS, 2 = USNO/2MASS, 3 = CPM, 4 (not used), 5 = 2MASS-only, 6 = PPM (no 2MASS), 7 = Annulus match, 8 = USNO-only.
The Fortran format statement for the catalog record is: (i5,a1,2f11.6,2f8.4,2f7.4,2f6.2,1x,3i1,2f10.5,2f8.4,2f5.1,i7,1x,a12, 2i10,2f5.1,f9.3,i2,2i1,2f10.5,3f7.3,f9.3,i2,i6,f7.1,f6.1,f7.1,f6.1,i2)
6 Reduced Proper Motion Diagram
Perhaps the single most important product of a proper motion survey is the reduced proper motion (RPM) diagram. In addition to its general utility for separating out different populations of stars, the RPM diagram will prove extremely useful for characterizing the properties both of the NLTT catalog and of the catalog we are presenting here. In Figure 2, we plot the band RPM,
| (6) |
against color for respectively high-latitude and low-latitude stars in our catalog. In each region of the sky, the subdwarfs (SDs) are clearly separated from the main sequence (MS) and the white dwarfs (WDs), but the divisions are at slightly different places because stars seen toward the poles tend to be moving faster. We make a linear interpolation between the two diagrams (noting that the first has and the second, ) and arrive at a single discriminator , by which we classify stars as a function of their position in the RPM diagram and their Galactic latitude,
| (7) |
The classification is:
| (8) |
Notice, for example, that in the high-latitude diagram is the equation of the upper separator line, while is the equation of the lower one. We will use equations (7) and (8) to extract subsamples from different stellar populations throughout the rest of this paper. As we have elsewhere shown (Salim & Gould, 2002), it was not possible to do this with the original NLTT RPM diagram.
Figure 3 shows the distribution of in the color range for 3 ranges of Galactic latitude and for all combined. The diagram shows clear peaks for the MS and the SDs with FWHM of about 3 magnitudes and 2 magnitudes respectively. An important question that we will address in § 8 is: to what extent is this width intrinsic to and to what extent is it due to measurement error? The figure shows that the separation between the MS and the SDs is not perfect. If one wanted a very clean sample of SDs, one would choose (or perhaps slightly higher), rather than . Or alternatively, one could use a more sophisticated approach that made use of both components of the proper motion and both Galactic coordinates. However, for purposes of studying the properies of the catalog, this level of cleanness is not required, and we will simply divide up the sample according to the conventions of equation (8).
7 Characteristics of NLTT
Here we use our improved measurements of NLTT stars to characterize the precision of its positions, proper motions, photometry, and binary separations, as well as the reality of its CPM identifications. We defer issues of completeness to § 9.
7.1 Positions
Figure 4 shows the differences between the 1950 epoch positions of NLTT and those predicted based on the 2000 positions and proper motions in our catalog. It is restricted to faint () stars to maximize the potential contrast with Figures 1 and 2 from Paper I, which show the same quantities for bright NLTT stars found in Tycho-2. In fact, there is no qualitative difference between the bright and faint position errors. The majority of the residuals are roughly uniformly distributed in a rectangle whose dimensions are set by the decimal truncation of the NLTT entries. The “fuzziness” of the rectangle edges gives an estimate of the underlying measurement errors. As was true of the Paper I bright sample, this is about . Figure 4b shows that the heavily populated rectangle is surrounded by a diffuse halo extending out to at least , which was the limit of our faint search in most cases. Nevertheless, taken as a whole, the positions are extremely good. These good positions played a critical role in our ability to identify the vast majority of NLTT stars in USNO and 2MASS in an automatic fashion. Note that the claim by Bakos, Sahu, & Nemeth (2002) that the typical LHS (subset of NLTT) position errors are larger than is manifestly not true.
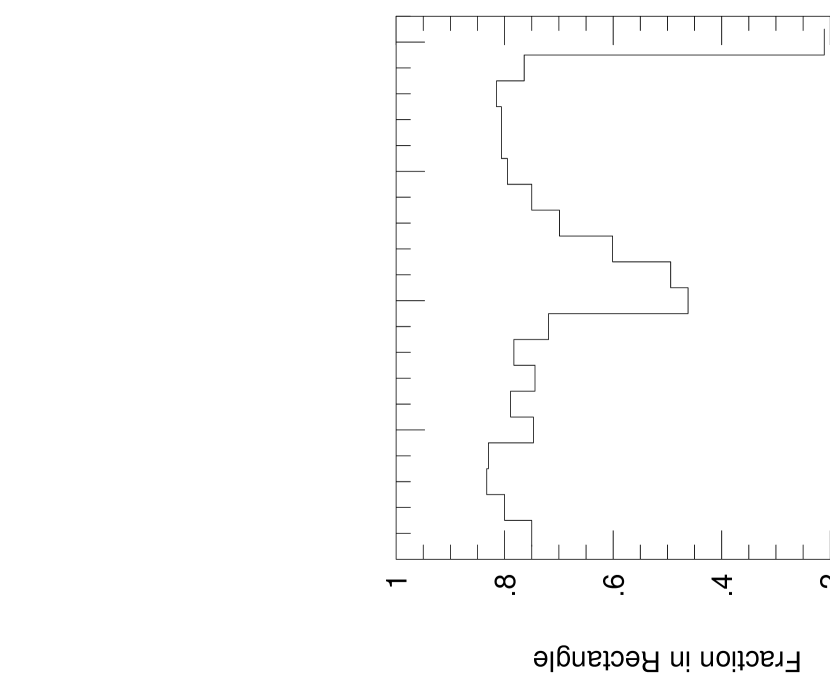
We further investigate the magnitude dependence of the NLTT position errors in Figure 5, which shows the fraction of NLTT stars whose actual position lies within a rectangle of dimensions and centered on the NLTT recorded position. The first term in each dimension is the imprecision created by decimal truncation and the second allows for measurement errors at each edge of the rectangle. The fraction remains mostly constant at about 80% over 19 magnitudes, except for a pronounced feature suddenly dipping to 45% at and then gradually climbing back to 80% at . We speculate that the brighter stars were already well studied and that Luyten made use of literature data on these. For the remainder of the stars he made his own measurements from plates. Saturation badly affects such measurements at , but gradually ameliorates at fainter mags.
Figure 6 shows the rectangle fraction as a function of declination. This figure has a number of important features. Over most of the sky, , the fraction is roughly 80%. As expected, it drops to essentially zero for where NLTT records positions only to 6 seconds of time and of arc. Less expected, however, are the rapid dropoffs for and . The former dropoff has significant negative consequences for the prospects of extending our catalog to the south, , as we discuss in § 10.
7.2 Proper motions
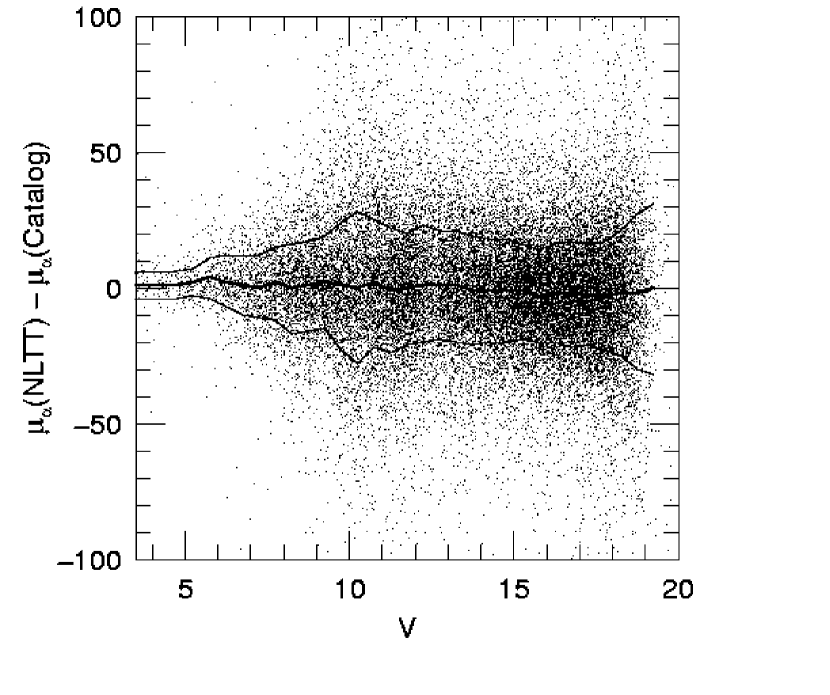
Figure 7 shows the differences between proper motions in the direction as given by NLTT and our values. The diagram for the direction looks extremely similar and is not shown. Binaries with separations closer than are excluded from this plot because our measurements, at least, can be corrupted due to blending. The bracketing lines show the scatter (with outliers excluded). At bright magnitudes, NLTT errors are extremely small, then rise typically to . However, there is a curious “bump” of higher errors at , which is reminiscent of the degradation in positions (see § 7.1) and which may have the same cause. At the very faintest mags, , the errors deteriorate toward .
The fraction of outliers excluded from the fit is fairly constant at , which is much higher that would be characteristic Gaussian noise. These outliers may be due to transcription errors in NLTT, misidentifications of NLTT stars by us, or possibly other causes. Whatever the cause, the reader should not apply Gaussian norms to the interpretation of the tails of this error distribution.
7.3 Photometry
Figure 1 shows the differences between NLTT and USNO photographic magnitudes and colors as a function of magitude. The scatter is typically 0.4-0.5 mag in both diagrams, except that the color scatter deteriorates to 0.7 mag at the faint end. This scatter, which is mostly contributed by NLTT, partly accounts for the poor performance of the NLTT reduced proper motion (RPM) diagram in discriminating among different stellar populations However, as we have shown (Salim & Gould, 2002), even the RPM diagram constructed with superior USNO photometry does not distinguish main-sequence stars from subdwarfs. The fundamental problem is the shortness of the photographic color baseline.
7.4 Binary Relative Astrometry
Figure 8 shows the difference in 339 separation vectors between binary components as given by NLTT versus our astrometry. The sample is restricted to separations to avoid problems in our astrometry due to confusion, and to avoid the regime in which NLTT errors induced by truncation of the position angle (given to integer degree) become larger than the errors induced by the truncation of the separation (given to integer arcsec). The inset shows that this relative astrometry is usually very good, better than . A number of the large outliers are due to transciption errors in NLTT. This highly precise relative astrometry permitted us to reliably identify NLTT CPM components even when USNO data were missing.
7.5 Reality of NLTT CPM Binaries
Our improved proper motions permit us to better determine the reality of the CPM binaries listed in the NLTT notes. Figure 9 shows the differences in component proper motions for 468 NLTT binaries with separations (again, to avoid problems with our astrometry due to confusion).
Of course, one does not expect the components of CPM binaries to have exactly the same proper motion. First they have orbital motion, which for face-on circular orbits induces a relative motion , where is the distance, is the total mass, is the angular separation, with units of pc, , arcsec, and years. Even if they had the same physical velocity, their proper motions would differ because the components are at different distances and because we see different components of motion projected on the sky. The order of these differences combined is , in radians. We add these orbital and projection effects in quadrature and show them as error bars in Figure 9. We estimate distances using the brighter (but non-WD) component. We classify it as a SD or MS star according to equation (8), and then assign it an absolute magnitude or in the respective cases. In addition, there is a error (see § 8.2) in our relative proper-motion measurements that must be added in quadrature to the errors shown in the figure. We have not done this to avoid overwhelming the intrinsic scatter. Also, we have not placed any error bars on the points lying below (i.e., ) to avoid clutter and because in our view these CPM identifications can be accepted with good confidence.
The figure shows that the overwhelming majority of NLTT CPM binaries with separations are real, but that close to half of those with are unrelated optical pairs. In fact, a number of these with proper motion differences could have been excluded by Luyten at the level given his precision in each direction and for each component. However, he evidently decided to err on the side of not missing potential CPM binaries.
8 Characteristics of New Catalog
The new data that we provide for NLTT stars dramatically reduces their astrometric and photometric errors. Here we characterize these errors.
8.1 Proper Motions Errors: Wide Angle
Once bright stars are identified with PPM catalog stars, they acquire the proper motions, and with them the proper motion errors, given in those catalogs. These vary but are generally of order a few . Faint-star proper motions are obtained by taking the difference of 2MASS and USNO positions. Again, these vary in quality but typically have errors of order 130 and 250 mas respectively. Given the year baseline, we expect proper motion errors of order . Nevertheless, one would like an independent experimental confirmation of this estimate.
To obtain this, we compare in Figure 10 our USNO/2MASS proper motions with Tycho-2 proper motions for 1179 stars for which we have measurements from both. We exclude for this purpose binaries closer than because, as we have emphasized several times, they can be corrupted by blending. The scatter, which is dominated by USNO/2MASS errors, is high at bright magnitudes and then plateaus at at about in each component. The poorer quality for bright stars is due to the problems that USNO astrometry has in dealing with saturated stars. Because we do not use USNO/2MASS proper motions for bright stars, our primary interest is in the asymptotic behavior of the error envelope toward faint magntitudes. Taking an average over the bins and taking account of the small contribution to the scatter due to Tycho-2 errors, we find average errors of
| (9) |
in each direction. These error bars are calculated excluding outliers, which constitute almost 5% of the points. Thus, as in the case of NLTT, these proper-motion errors have strong non-Gaussian tails.
8.2 Proper Motions Errors: Narrow Angle
USNO astrometry, which dominates the proper-motion error budget, is more accurate on small scales than large scales. On scales of several degrees it suffers from errors in the plate solutions while on smaller scales it is limited by centroiding errors. For some applications, notably studying the reality of binaries or their internal motions (see § 7.5), it is the small scale errors that are relevant.
To determine these narrow-angle errors, we plot in Figure 11 the difference in the proper motions of the two components of 52 SD binaries (both components have , see eqs. [7] and [8]) with separations . We choose SDs because they are more distant, which in turn implies that these binaries will have wide physical separations (and so be relatively unaffected by internal motions) without being widely separated on the sky (and so prone to contamination by optical binaries – see Fig. 9). In a proper-motion selected sample, the mean distance is proportional to the mean transverse speed, which is of order five times larger for SDs than MS stars. The figure shows a tight clustering of points with two outliers at , which are either not physical binaries or have extremely bad proper-motion measurements. After excluding these, we obtain a scatter in the two directions of and . Since each results from the combination of two proper motions measurements, we derive a narrow-angle proper-motion error of
| (10) |
Hence, the rms error in the magnitude of the proper motion difference of a binary is , which was the value we adopted in analyzing Figure 9.
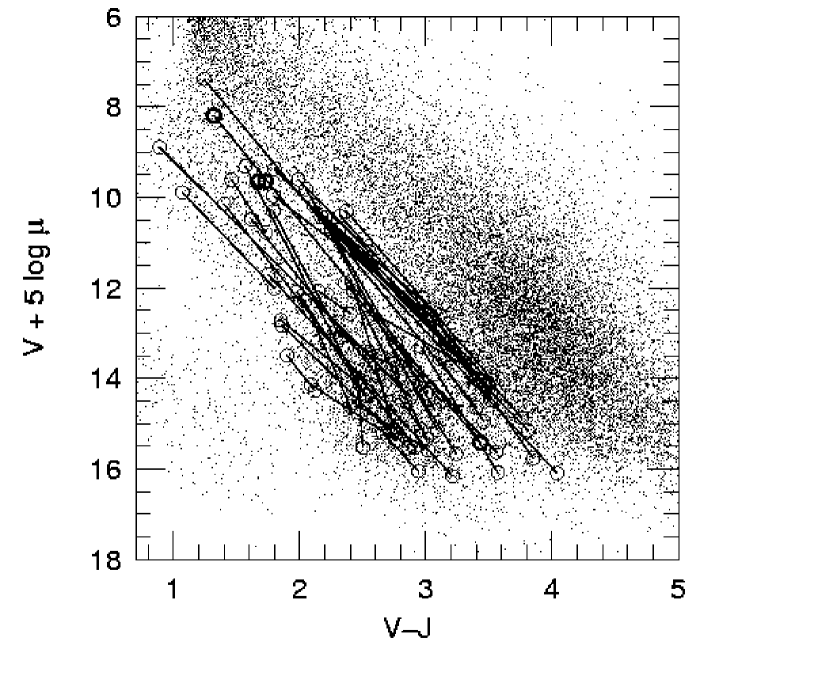
Figure 12 shows these 52 binaries on a RPM diagram, together with solid lines connecting the two components. Note that in the great majority of cases, the two components lie about equal distances below the MS, as would be expected for two stars of similar chemical composition and transverse velocity but different luminosities. This also applies to the two outliers from Figure 9 (shown as bold circles), so they may in fact be genuine pairs with very large proper-motion errors.
8.3 Photometry Errors and the RPM Diagram
To understand how measurement errors affect the RPM diagram (Fig. 2) we focus on the discriminant . The form of given in equation (7) is not conducive to this analysis because appears in both axes, the color and the RPM . Hence, we first rewrite this equation as
| (11) |
The standard against which we must measure the errors in is the width of the narrower (SD) peak, which is about 2 mag FWHM, corresponding to about 0.85 mag Gaussian half-width. At the proper-motion limit of NLTT (), the proper motion errors reported in § 8.1, induce an error in of 0.07 mag, which is completely negligible on this scale. Indeed, even the NLTT proper-motion errors, which are more than 3 times larger, would not contribute significantly.
For the overwhelming majority of our stars, the band photometry errors are 0.02–0.03 mag. Even at 0.1 mag (which applies to only about 1% of the stars), the errors would not be significant relative to width of the SD distribution.
Because bright stars are saturated in 2MASS, the great majority of stars with RPM measurements derive their data from USNO’s photographic photometry. For these, the errors are approximately 0.25 which, from equation (11) induces an error in of 0.53 mag. This does provide a significant, albeit nondominant contributiion to the width. If it could be removed, for example by obtaining CCD photometry for all NLTT stars, the width of the SD distribution would be reduced by about 20%.
8.4 Position Errors
For some applications, notably the search for nearby-star microlensing candidates (Salim & Gould, 2000), the position errors are the most important. For the fainter stars , our positions come from 2MASS and have a typical accuracy of mas as of about 1998. These will deteriorate (in quadrature) at a rate of about due to accumalated proper motion error.
9 Completeness
We have deferred the problem of assessing the completeness of both NLTT and our catalog to this point because the analyses of the two are interrelated.
9.1 Completeness of Revised Relative to Original NLTT
Figure 13a shows the total number of NLTT stars as a function of together with the total number of these in our catalog found by 1) PPM searches alone, 2) all techniques. The “bump” and “dip” at is an artifact of the NLTT photometry system and does not appear in other passbands. Figure 13b gives the fractional incompleteness, and breaks down our catalog entries into five cumulative classes: 1) PPM only, 2) … + USNO/2MASS, 3) … + CPM, 4) … + 2MASS-only, 5) … + USNO-only. For purposes of this plot, we consider only stars in 2MASS-covered areas. These are defined as stars that have an identified 2MASS counterpart, or for USNO-only stars, whose known position lies in a 2MASS area, or for NLTT-only stars, whose NLTT position lies in a 2MASS area. The figures show: first that our PPM search is seemlessly integrated with our faint searches; second, that we recover about 97% of NLTT stars down to and 95% at , beyond which NLTT itself is becoming quite incomplete; third that the auxiliary searches (CPM, 2MASS-only, USNO-only) account for only a few percent of our detections for , but then the fraction rises to about one half.
9.2 Relative Completeness of NLTT vs. Galactic Latitude
To further investigate problems of completeness, we must first establish over what range of Galactic latitudes the underlying NLTT survey is homogeneous. That is, whatever level of completeness it actually achieves as a function of magnitude, how uniform is its coverage over the sky? We showed in Paper I by direct comparison with Hipparcos and Tycho-2, that at bright magnitudes NLTT is close to 100% complete for , but that its completeness falls to 75% close to the plane, even for these bright stars. For the faint stars we do not have an independent compilation of proper motions, so we cannot directly establish the absolute completeness of the catalog. (We will carry out an indirect absolute measurement in a forthcoming paper.) However, by making use of both the RPM discriminator (eq. [7]) and the much greater dynamic range of the full catalog presented here, we can give a much more detailed picture of the relative completeness as a function of various variables.
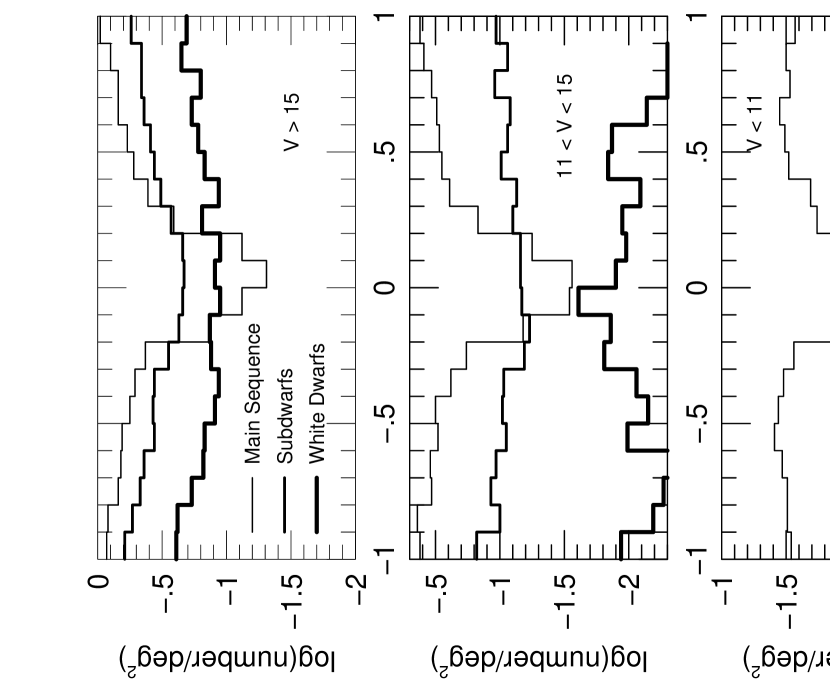
Figure 14 shows the number of WDs, SDs, and MS stars per square degree as a function of Galactic latitude, for three different magnitude ranges. We classify the stars using equations (7) and (8), which of course means that stars lacking photometry will not appear in these plots. To determine the surface density (stars deg-2), we calculate the fraction of each latitude bin that is covered by the 2MASS release and that lies to the north of our cutoff in declination. (To allow for the somewhat ragged boundary of USNO-A1/POSS I coverage near , we set this cutoff at .) However, we do not attempt to compensate for stars that fail to appear in 2MASS due either to saturation, faintness, or other causes. For the fraction of these is only . On the other hand, bright stars are virtually absent from these plots due to saturation, and saturation remains to some detectable degree until . This effect should not influence the relative number of stars as a function of Galactic latitude, which is the main point of Figure 14. In any event, completeness questions at the bright end are more effectively investigated by the techniques of Paper I (see especially, Fig. 5). They are included here mainly as a point of reference. The very faintest blue stars from NLTT will be missing from these plots because of the 2MASS flux threshold.
The results shown in Figure 14 are quite unexpected. One often hears of the severe incompleteness of NLTT close to the Galactic plane, but the real story is more complex: NLTT is substantially less complete in the plane, but only for MS stars. By contrast, NLTT coverage of SDs is near uniform over the sky and its coverage of WDs appears to be completely uniform. For MS stars, there is an evident dropoff in counts over the interval in all three magnitude ranges. It is not very pronounced for bright stars, but one already knows from Paper I that NLTT is more than 85% complete averaged over this range. However, it is quite pronounced in the other two ranges, falling by a factor over only in each case. One also notices a more gradual decline in the MS density going from high to low latitudes. For example, in the faintest bin, it falls by a factor between the poles and . A priori, one does not know if this is due to a genuine change in density or to an extension of the obvious imcompleteness near the plane to higher latitudes. In our further analysis, we will adopt the former explanation for two reasons. First, one does expect a general trend of this sort because a large fraction of the fainter MS stars entering a proper-motion limited sample are from the old disk. These have on average substantially higher transverse speeds seen towards the poles than in the plane because of asymmetric drift, and are therefore selected over a larger volume. Second, as we now discuss, this trend is also seen in SDs where it is expected on similar grounds, but this time without the problem of “contamination” from a slower population.
There are too few SDs in the bright bin to draw any meaningful conclusion. In the middle bin , the SD distribution appears to be almost completely flat, in very striking contrast to the MS distribution in the same magnitude range. In particular, near the plane where the MS density suffers a factor 10 decline, the SD distribution is virtually flat and if it declines, does so by at most a few tens of percent. The fact that the MS counts gradually rise toward the poles while the SD counts do not is easily explained. For a population of characteristic transverse speed , a survey will saturate its proper-motion limit only for stars with brigher than,
| (12) |
For SDs with surveyed at to the NLTT limit , this corresponds to . There are very few subdwarfs at these bright magnitudes that could “take advantage” of the higher transverse velocities seen toward the poles. On the other hand, for typical MS speeds, , the limit is . Since this is close to the peak of the MS luminosity function (LF), a large fraction of MS stars are seen more readily toward the poles than the plane. The same effect explains the patterns seen in the faintest bin which, as we will see in § 9.3, contains a substantial number of stars to . The limit imposed by equation (12) for subdwarfs at this magnitude is , which includes a large fraction of the SD LF. Similarly, we expect the effect to be even stronger for MS stars in the faintest bin than the middle bin, because now the whole peak of the MS LF is included. On the other hand, in the brightest bin, the limit for MS stars is which includes a very small fraction of the MS LF. We therefore expect the slope to be small, and it is.
There are significant numbers of WDs only in the faintest bin. Since WDs in NLTT mostly have the same kinematics as the MS, the limit imposed by equation (12) is . Many WDs satisfy this constraint, so we expect to find more WDs near the poles, which is actually the case. Note that in the faintest bin, neither the WDs nor the SDs show any significant tendency to drop off close to the plane.
Thus, a consistent picture emerges from Figure 14: MS completeness is very severely affected by proximity to the plane but SD and WD completeness are barely affected at all. The most plausible explanation for this is that while Galactic-plane fields are extremely crowded and therefore in general subject to confusion, blue stars are no more common in the plane than anywhere else. Hence, by focusing on blue objects in the plane, Luyten was able to recover most high-proper motion SDs and WDs, even while he lost the overwhelming majority () of the MS stars.
9.3 Properties of Revised NLTT at High Latitude
We now investigate the properties of our catalog over the regions of the sky that are not affected by the severe incompleteness of MS stars near the plane. In Figure 15a, we show the (logarithm of the) number of WDs, SDs and MSs as a function of . To minimize the problems of incompleteness near the plane, we have restricted these counts to regions or . As before, we include only areas covered by the 2MASS release and . These restrictions apply to 38.0% of the sky. Also shown is a bold histogram of the stars in our catalog that lie in this 38% of sky but were absent from 2MASS (possibly due to saturation), as well as a solid histogram of NLTT stars in this region that we failed to recover. Figure 15b shows the cumulative number at each magnitude, progressively including WDs, SDs, MS stars, stars without 2MASS data, and NLTT stars missing from our catalog. The uppermost curve (all NLTT stars) turns over sharply at , which would seem to indicate the onset of substantial incompleteness at this magnitude. However, the upper panel shows that this assessment ignores significant subtleties.
First note that the MS curve flattens and turns over at , as does the WD curve, but that the SD curve continues to rise to . A plausible explanation for these divergent behaviors is that completeness does not begin to drop off rapidly until past , but that the MS and WD counts are adversely impacted by other effects. At faint magnitudes, the former are just running out of stars. Recall from equation (12) that at the proper motion limit , MS stars with transverse speeds have absolute magnitudes . Hence, for the survey is probing the LF beyond its peak where there are a declining number of stars. We suspect that the WD are becoming too faint to show up in 2MASS and so they are not being classified as such by our optical/IR discriminant, . At fainter magnitudes, they are too faint even for USNO, and so are not being recovered by our catalog at all.
To test this idea, we classify USNO-only stars using the RPM diagram. We have previously shown (Salim & Gould 2002, see Fig. 4) that this diagram discriminates quite well between WDs and other stars, but does not discriminate effectively between SDs and MS stars. Based on the USNO RPM diagram, we classify USNO-only stars as WDs if they satisfy
| (13) |
The NLTT RPM can also be used to classify WDs (Salim & Gould, 2002). Although on a star-for-star basis, this classification is less reliable than the one base on the USNO RPM diagram, and substantially less reliable than the one based on the RPM diagram that we mostly use here, it should be adequate to address the statistical questions posed in this section. Using Figure 3 from Salim & Gould (2002), we derive,
| (14) |
Figure 16 is similar to Figure 15a, except that it reflects the reclassification of the USNO-only and NLTT-only stars. The bold curve now shows the total of all the WDs, while the histograms show the non2MASS/nonWDs and NLTT-only/nonWDs. Also shown are two curves that give the RPM-classified WDs (same as WD curve in Fig. 15a), and the sum of this curve and the USNO-only WDs. This diagram has several important features. First, it shows that the WD counts continue rising to , actually slight past the end of the SD rise. Hence, it seems likely that the SD turnover at is due to a real decline in the LF at faint magnitudes, just as was the case for the MS. Second, while we do not know what the unclassified USNO-only and NLTT-only stars are at the faint end, their combined counts are a factor 10 below the SD counts, and even farther below the MS counts. Hence, however they are classified, they cannot alter the qualitative picture presented by this diagram.
These results imply that our catalog can be used to study the statistical properties of a large sample of subdwarfs down to . We have initiated such a study and will report our results soon.
10 Going South?
Once the full 2MASS catalog is released, it will be relatively straightforward to extend our catalog to the other 33% of the sky that lies north of . However, the prospects for extending it to the south are less promising. First, as we discussed in § 2.2, the great majority of NLTT stars are missing from USNO-A. In the north, even when a NLTT star was missing from USNO-A, we were frequently able to recover it by looking for the 2MASS counterpart at the position predicted by assuming that the star was inside the NLTT rectangle and that the NLTT proper motion was approximately correct. See § 4.2. However, the reason that this method was effective is that over most of the northern sky, the star does actually lie in the rectangle about 80% of the time. From Figure 6, one sees that progressively fewer stars are in the rectangle in the south, and virtually none are for . Moreover, a 2MASS-only identification yields a position and infrared photometry, which are useful for many applications, but not a proper motion. At present only 13% of the area is covered by the 2MASS release, but the above factors lead us to believe that after full release, our technique will not be very effective in this region. In any event, NLTT is generally limited to in the South and the brighter stars among these are already covered by our PPM search.
11 Conclusion
The catalog presented here gives improved astrometry and photometry for the great majority of stars in the NLTT that lie in the overlap of the areas covered by the second incremental 2MASS release and those covered by POSS I (basically ). In addition, essentially all bright NLTT stars over the whole sky have been located in PPM catalogs and, whenever possible, the close binaries among them have been resolved using TDSC. We recover essentially 100% of NLTT stars , about 97% for , and a declining fraction thereafter. Most of the faint stars that we do not recover are WDs, which are too faint and too blue to show up in one or both of USNO-A or 2MASS, the two catalogs that we combine to obtain our astrometry and photometry. The catalog contains a total of 36,020 entries for 35,662 NLTT stars including a total of 723 entries for 361 NLTT “stars” that have been resolved in TDSC. Of these 36,020 entries, 1353 () contain new positions and photometry but not new proper motions because they have been identified in only USNO-A or 2MASS, but not both.
The new positions are accurate to 130 mas. The new proper motions are accurate to , more than a 3-fold improvement over NLTT. Narrow angle proper motions are accurate to . The catalog provides a powerful powerful means to investigate SDs, WDs, faint MS stars as well as CPM binaries.
References
- Bakos, Sahu, & Nemeth (2002) Bakos, G. A., Sahu, K. C., & Nemeth, P. 2002, Accepted for Publication in ApJS, astro-ph/0202164.
- ESA (1997) European Space Agency (ESA). 1997, The Hipparcos and Tycho Catalogues (SP-1200; Noordwijk: ESA)
- Gould & Salim (2002) Gould, A. & Salim, S. 2002 ApJ, submitted
- Fabricius et al. (2002) Fabricius, C., Høg, E., Makarov, V. V., Mason, B. D., Wycoff, G. L., & Urban, S. E. 2002, A&A, 384, 180.
- Høg et al. (2000) Høg, E. et al. 2000, A&A, 355, L27.
- Luyten (1979, 1980) Luyten, W. J. 1979, 1980, New Luyten Catalogue of Stars with Proper Motions Larger than Two Tenths of an Arcsecond (Minneapolis: University of Minnesota Press)
- Monet (1996) Monet, D. G. 1996, American Astronomical Society Meeting, 188, 5404.
- Monet (1998) Monet, D. G. 1998, American Astronomical Society Meeting, 193, 112003
- Röser (1996) Röser, S. 1996, IAU Symp. 172: Dynamics, Ephemerides, and Astrometry of the Solar System, 172, 481.
- Salim & Gould (2000) Salim, S. & Gould, A. 2000, ApJ, 539, 241
- Salim & Gould (2002) Salim, S. & Gould, A. 2002, ApJLetters, submitted
- Skrutskie et al. (1997) Skrutskie, M. F. et al. 1997, in The Impact of Large-Scale Near-IR Sky Survey, ed. F. Garzon et al (Kluwer: Dordrecht), p. 187


| rectangles | circles | total | |||
|---|---|---|---|---|---|
| unique | resolved | unique | resolved | ||
| USNO-A1 | 2426 | 78 | 517 | 174 | 3195 |
| USNO-A2 | 15404 | 534 | 3574 | 974 | 20486 |
| total | 17830 | 612 | 4091 | 1148 | 23681 |