Chandra view of the dynamically young cluster of galaxies A1367 I. small-scale structures
Abstract
The 40 ks Chandra ACIS-S observation of A1367 provides new insights into small-scale structures and point sources in this dynamically young cluster. Here we concentrate on small-scale extended structures. A ridge-like structure around the center (“the ridge”) is significant in the Chandra image. The ridge, with a projected length of 8 arcmin (or 300 h kpc), is elongated from northwest (NW) to southeast (SE), as is the X-ray surface brightness distribution on much larger scales ( 2 h Mpc). The ridge is cooler than its western and southern surroundings while the differences from its eastern and northern surroundings are small. We also searched for small-scale structures with sizes arcmin. Nine extended features, with sizes from 0.5′ to 1.5′, were detected at significance levels above 4 . Five of the nine features are located in the ridge and form local crests. The nine extended features can be divided into two types. Those associated with galaxies (NGC 3860B, NGC 3860 and UGC 6697) are significantly cooler than their surroundings (0.3 - 0.9 keV vs. 3 - 4.5 keV). The masses of their host galaxies are sufficient to bind the extended gas. These extended features are probably related to thermal halos or galactic superwinds of their host galaxies. The existence of these relatively cold halos imply that galaxy coronae can survive in cluster environment (e.g., Vikhlinin et al. 2001). Features of the second type are not apparently associated with galaxies. Their temperatures may not be significantly different from those of their surroundings. This class of extended features may be related to the ridge. We consider several possibilities for the ridge and the second type of extended features. The merging scenario is preferred.
1 Introduction
Clusters of galaxies exhibit a range of X-ray morphologies from regular and relaxed to irregular and dynamically young (Forman & Jones 1982). Irregular clusters with no X-ray dominant galaxy are generally considered dynamically young systems. Studies of such dynamically young systems, in combination with studies of more evolved clusters, are very important for understanding cluster evolution and its impact on the evolution of galaxies (and vice versa). A1367, with its cool gas temperature (3-4 keV; e.g., Donnelly et al. 1998; D98 hereafter), high fraction of spiral galaxies, irregular X-ray distribution and low central galaxy density, is the prototype of such a dynamically young system (Bahcall 1977; Jones et al. 1979; Bechtold et al. 1983; B83 hereafter). It is a nearby (z=0.022) X-ray-bright cluster. Thus, detailed X-ray studies can be performed and the results will be very important for understanding dynamically young clusters.
Based on the Einstein HRI (EHRI hereafter) observations, B83 found fifteen 1′ scale emission features in A1367 with luminosities of several times 1041 ergs s-1 (0.5 - 4.5 keV). Most features seemed to be associated with galaxies and were attributed to hot galactic coronae (B83). However, Canizares, Fabbiano & Trinchieri (1987) noted that most early-type galaxies identified in A1367 by B83 have X-ray luminosities that exceed those of other galaxies with similar optical luminosities by nearly two orders of magnitude. Thus, they suggested that those regions found by B83 might be due to clumpiness in the ICM and should not be identified with galaxy halos. Grebenev et al. (1995; G95 hereafter) applied a wavelet analysis to both ROSAT PSPC and EHRI data. They detected 8 more extended features mainly from the PSPC observation (in a larger field of view - FOV), though they only detected 8 of 15 extended features claimed by B83. Lazzati et al. (1998; L98 hereafter) performed their own wavelet analysis on the same PSPC data. Their results do not show many extended features ( 7) and they only detected 4 of 11 extended features found by G95. All three analyses found extended features that are not apparently associated with galaxies though their nature is still vague.
Here we present the analysis of the recent Chandra observation of A1367. With Chandra’s superior spatial resolution ( 0.5′′ at the aimpoint) and better sensitivity than previous missions, we can better understand these extended features. In this paper, we concentrate on the small-scale structures. The analysis of point sources (including those corresponding to the member galaxies) will be presented in paper II (Sun & Murray 2002). The Chandra data reduction is described in 2; the detection of the extended features is in 3; 4 describes the Chandra temperature map; 5 discusses the central ridge and a surface brightness discontinuity at its southern end; 6 and 7 discuss extended features; and 8 is the discussion while 9 is the summary. Throughout this paper we assume H0 = 50 km s-1 Mpc-1 and q0 = 0.5. These cosmological parameters correspond to a linear scale of 0.62 kpc/arcsec at the cluster redshift. All luminosities, densities and masses scale as h, h and h respectively.
2 Chandra observation & data reduction
A1367 was observed on February 26, 2000 by Chandra with the Advanced CCD Imaging Spectrometer (ACIS). The observation was taken by the ACIS-S instrument using chips 2-3 and 5-8. The roll angle of the observation was chosen in such a way that the ACIS-S chips lay along the SE-NW elongation of the cluster. The focal plane temperature was -120 C. The total exposure was 40.2 ks. The data were telemetered in Faint mode and ASCA grades 1, 5 and 7 were excluded. Known bad columns, hot pixels, and chip node boundaries were also excluded. This observation contains three particle background flares that were excluded based on the X-ray light curves from the outer parts of the field. The back-illuminated (BI) chips and front-illuminated (FI) chips were filtered separately since they have different background levels (see Markevitch et al. 2000 for details). The streak events in the S4 chip were removed by DESTREAK in CIAO. The effective exposures were 37.8 ks for the S1 and S3 chips, 37.4 ks for the S2 and S4 chips, and 39.0 ks for the I2 and I3 chips. Absolute positions of X-ray sources were carefully checked using optical identifications. A small boresight error of 2′′ in the original data was corrected. The derived positions are accurate to 0.5′′ near the aimpoint, with larger errors further out.
We generally used local background when we analyzed small-scale structures. However, the blank field background data relevant to this observation (Markevitch et al. 2000) were also used in some cases (e.g., temperature map). The renormalization factors at the time of observation (S1, 3: 1.08; S2, 4: 1.06; I2, 3: 1.11) were applied to the produced background (http://asc.harvard.edu/~maxim/axaf/acisbg/ ). Since vignetting is dependent on energy, we divided the 0.5 - 5 keV energy band into six narrow bands and applied exposure corrections to the narrow-band images. Weighting spectra were also applied in producing exposure maps (the weighting spectrum differs from chip to chip based on the spectral fit to the integrated spectrum of each chip). The ARFs were calculated by weighting the mirror effective area in the region with the observed cluster brightness distribution in the 0.5 - 2.0 keV energy band. The spatial nonuniformity of the CCD quantum efficiency (QEU map) was included in the ARF calculation. An additional position-independent correction factor of 0.93 for the FI chip quantum efficiency below 1.8 keV was also used to account for the difference between ACIS-S3 and FI chips (Vikhlinin 2000). The RMF were calculated by weighting the standard set of matrices within the region by the observed cluster brightness distribution.
The calibration data used correspond to CALDB 2.9 from Chandra X-ray Center (CXC). The errors in this paper are 90% confidence intervals unless specified. The solar abundance table (photospheric measure) by Anders & Grevesse (1989) was used. A galactic absorption of 2.21020 cm-2 and the cluster redshift of 0.022 were used in the spectral fits and computations unless they are specified.
3 Detection of extended features
Previous papers on the analyses of EHRI and ROSAT PSPC data claimed 26 extended sources in this cluster: B83 - 15, G95 - 16 and L98 - 7 (4 of L98 sources are only candidates). The FWHMs of these sources range from 0.5′ to 3′ and their luminosities are generally around 1041 ergs s-1 in the 0.5 - 5.0 keV band. However, of these 26 sources only two are detected in all three papers, although G95 analyzed the same EHRI data as B83 and L98 analyzed the same PSPC data as G95 (see Table 2 for details). The superior spatial resolution and high sensitivity of Chandra, in principle, allow us to examine these extended features and search for new ones. The sensitivity of Chandra for detecting extended sources depends on the assumed source size, the assumed spectrum and the position in the CCD chips. For a thermal thin plasma spectrum (MEKAL) with 1 keV temperature and a solar abundance, and for source sizes from 0.5 to 1.5 arcmin in radius, the sensitivity for this observation is 0.7 - 3.5 1040 ergs s-1 (0.5 - 5.0 keV) across the field. Therefore we should be able to detect all previously reported extended sources if they are in the field.
3.1 Methods
We generated images in the energy bands 0.5 - 2 and 0.5 - 5 keV. The former was made to match the energy band of ROSAT while the latter includes hard X-ray data. All properties of the detected sources are derived from the 0.5 - 5 keV image, while the 0.5 - 2 keV image was used to compare with the previous ROSAT results. Background was subtracted based on the blank field observations and exposure corrections were applied. Before searching for small-scale structures, all point sources were identified (WAVDETECT) and confirmed by comparison with the local point spread functions (PSFs) generated by MKPSF in CIAO. Point sources were then replaced by their surrounding averages.
To detect small-scale structures two methods were applied. The first is wavelet decomposition (Vikhlinin, Forman & Jones 1997). Previous application of this technique on ROSAT data of the Coma cluster revealed an extended structure difficult to be found by normal ways (Vikhlinin et al. 1997), which is later confirmed by XMM-Newton observations (Arnaud et al. 2001). The scales we used correspond to 1, 2, 4, … 32, 64 times the image pixel size (3.9344′′ per pixel; scale 1 - 7 henceforth). The detection threshold was set at 4.5 (correponding to 1 false detection in a 512512 image). No sources were detected on scales 1 and 2, which means that point sources have been excluded efficiently. On scale 7 there is only global cluster emission. Some structures appear on scales 3 - 6.
The second method is as follows. Gaussian smoothing was performed to point-source-extracted images with different values of 1, 2, 3, … 8 pixels (3.9344′′ per pixel). In each smoothed image, the possible small-scale structures were first picked out by eye. Aperture photometry was performed in the photon image to check the significance of potential sources (the definition of S/N is given in Table 1 and the detection threshold is set at 4 ). On the scale of 8′ ( 300 h kpc), a central ridge-like structure (Fig. 1, 2 and 3) is quite significant. This structure lies along the SE-NW direction with a dimension of about 38′ and its SE end twists toward the east. On smaller scales, some small structures with sizes around 1′ were revealed. We excluded features that may be related to the possible residual streak pattern in the S4 chip and the gaps of the CCD chips. The results of these two methods agree. Nine extended features with sizes from 0.5′ to 1.5′ were detected.
We measured the position, size, and net count of each feature. Positions were determined from the average of the peaks of each feature in the smoothed image and the wavelet reconstructed image (they agree within 5′′). The radial profiles of these features were obtained (e.g., Fig. 4). These features are all detected in the wavelet reconstructed images on scales of 5 or less. Thus, the images on scales of 6 and larger can be taken as the local background. The flattening of the radial profile at some radius (e.g., Fig. 4) can also be used to estimate the background. Background levels determined by these two methods are consistent. Then we measured the 50% encircled energy average radii (EEAR) of these feature to characterize their extension. When we calculate the significance and net count of each feature, the radius of the region is chosen to be twice 50% EEAR. The results, with uncertainties, are listed in Table 1.
3.2 The extended features detected by Chandra
In Table 1, we list the nine extended features detected by Chandra using the methods described in 3.1. Six have been previously detected (Table 2), while the other three are newly detected in this observation (C2, C5 and C6; see Fig. 2 and 3). Source Gp17 found by G95 may include C2. Chandra sources C5 and C6 are too faint to be picked out by previous observations. There is a detector feature across C6 so that it is the most poorly determined one. The extended nature of these sources is presented in Fig. 4, 5, and 9. In Fig. 4, the radial profiles of C1, C7 and C8 are shown. C1 is shown since it lies farthest from the aimpoint, while C7 and C8 are shown because they are associated with galaxies. Radial profiles of C2 - C6 are all similar to that of C1. The angular extension of C1 - C9 vs. PSFs is shown in Fig. 5. The X-ray contours of C9, as well as the local PSF, are shown in Fig. 9.
In summary, this observation detected 9 extended features on scales of 1 arcmin in A1367. Three are associated with galaxies: C7 - NGC 3860B; C8 - NGC 3860; C9 - UGC 6697. Based on the DSS II image, the other six (C1 - C6) are not associated with galaxies. There are several member galaxies nearby (e.g., a member galaxy lies 1′ east of C1 and another galaxy lies between C2 and C3; see Fig. 2b), but all have an offset of at least 0.5′ (or about 20 kpc) from the centers of C1 - C6. The galaxies with small boxes in Fig. 2b (right panel) include all known member galaxies in the field and generally have B magnitudes less than 16.5, but are not as bright as those associated with C7 - C9. Therefore, we can divide these 9 extended features into two categories: features without associated galaxies (C1 - C6) and features with associated galaxies (C7 - C9). They are discussed separately in 6 and 7.
3.3 The extended features detected by Einstein and ROSAT
We also checked extended features claimed in previous papers (B83, G95 and L98). It was found that 18 of 26 extended features claimed by previous analyses of EHRI and ROSAT PSPC data (B83, G95 and L98) are in the Chandra FOV. Images in the same energy bands as those of EHRI and PSPC were generated. All 18 sources were examined. However, as shown in Table 2, only 6 are confirmed to be extended features in this Chandra observation. Four are point sources or their combination, and 8 are not detected. In the following we discuss the previous EHRI and PSPC detections separately.
For the EHRI observations, only 2 of 12 extended features reported by B83 and the same 2 of 8 reported by G95 are confirmed by Chandra. Moreover, 7 of 12 reported by B83 and 3 of 8 reported by G95 (7 in total since 3 are the same) are not even detected in this Chandra observation. The EHRI sources without Chandra detections were also not detected in the PSPC analyses (G95 and L98). For the three EHRI extended features that are actually point sources or their combination, point sources plus a fluctuation of the cluster emission can explain the previous results. For the PSPC observation, 5 of 9 extended features detected by G95 and 3 of 4 detected by L98 are confirmed by Chandra, while the others are point-like sources or their combination, except Gp27 by G95, which is not detected by Chandra but is also not detected by L98. The confirmed PSPC extended sources generally lie at small off-axis angles (where PSFs are still good), while those not detected as extended features are generally at larger off-axis angles where the PSFs degrade.
In summary, most of the EHRI extended features in the field are not confirmed by Chandra while approximately half of the PSPC extended features in the field are confirmed. The following factors could contribute to the differences between the previous results and Chandra results: relatively poor photon statistics of EHRI, unclear systematic uncertainty in the EHRI observations of A1367, relatively poor spatial resolution of PSPC, and degradation of PSPC PSFs at large off-axis angles.
4 The Chandra temperature map
A temperature map was made based on this observation though it covers only a part of A1367. We divided the field into 42 regions based on photon statistics. The temperature uncertainty in each region is generally less than 15%. The regions with point sources and extended features associated with galaxies (C7 - C9) were excluded. We fitted the 0.75 - 8.5 keV spectra and fixed the absorption to the galactic value. A MEKAL model was used and the abundance was a free parameter in the spectral fit. The results are shown in Fig. 6.
The Chandra temperature map confirms the ASCA result (D98) that the NW subcluster has a higher temperature than the SE subcluster. There are temperature variations across the field. Along the NW-SE direction, temperatures generally decrease from the NW subcluster to the center of the SE subcluster. The ridge is located around the coolest part. Temperatures again increase from the ridge to further SE. Although the Chandra temperature map only covers a part of A1367, it shows several relatively hot regions (15 ,29 and 30) that may indicate interaction (especially 29 and 30).
5 The central ridge
The central ridge is the most striking spatial feature revealed by this observation. This observation also reveals five extended features (C1 - C5) within the ridge forming five local crests. The temperature map (Fig. 6) shows that the the ridge is located around the coolest part of the cluster. We also fitted the integrated spectrum of the whole ridge and compared its temperature with those of the surrounding regions at the east, north, west and south of the ridge. It was found that the ridge has a lower temperature (3.2 keV) than its western and southern surroundings (3.90.3 keV and 4.1 keV respectively), but the same temperature as its eastern and northern surroundings (3.30.2 keV and 3.5 keV respectively).
On the scale of about 2 h Mpc, the PSPC isophotes can be divided into two parts: a SE part and a NW part (e.g., D98). Fig. 2a shows that the outer contours of the SE part are rather spherically symmetrical if we do not include those elongated to the NW. D98 performed a -model fit to this part (excluding parts contaminated by the NW part). The fit is acceptable but there is a significant excess around the center. We performed an independent -model fit to the outer parts of the SE subcluster to examine the central excess. First the outer part contours are used to determine the center, which is 11h44m49.s8, 1942 28(the cross in Fig. 7). The regions we chose are from 6.5′ to 30′ centered at the position mentioned above. To exclude the contamination from the NW subcluster only the azimuths ranging from 35 to 225 were included (with the angle measured counterclockwise from north). The derived core radius is 13.32.2 arcmin and is 0.840.11. We then subtracted this spherically symmetrical component from the PSPC image of the whole cluster. The residual (Fig. 7) clearly shows the central ridge and the NW subcluster. The SE subcluster has been well subtracted (generally within 3- fluctuation of the background). The small-scale features are generally point sources (marked in Fig. 7) and some extended features. This result implies that the ridge is a central excess in the SE subcluster.
In Fig. 1, 2 and 3, the surface brightness distribution is relatively sharp at the southern end of the central ridge, or the south of C1 and C2. We measured the surface brightness profile across that feature (Fig. 8). The regions chosen are shown in Fig. 3. Since we intentionally exclude C1 and C2, the region does not include the whole discontinuity region. However, the discontinuity feature is significant, as shown in Fig. 8. It may imply a dynamical process, e.g. a shock or a cold front. However, current data do not allow us to constrain temperatures well at each immediate side of the discontinuity.
6 The extended features without associated galaxies
Of the nine extended features detected by Chandra, C1 - C6 are especially interesting since they are not apparently associated with galaxies. C1 - C5 appear to be aligned, forming five local crests along the central ridge. The temperatures and abundances of these extended features may help us understand their nature. Limited by the photon statistics, we fit the spectra of C1 - C5 together since they are all located within the central ridge. The spectrum of the region surrounding C1 - C5 was also extracted and normalized by area. We took it as the background. The best-fit temperature is 2.3 keV and the abundance is 0.9. If the spectrum of the surrounding was normalized by the predicted value from the -model fit (D98), the results change little. The spectrum of the surrounding region was also fitted. The best-fit temperature and abundance is 3.40.2 keV and 0.41 respectively. Thus, current data do not imply any significant difference in temperature between the extended features and their surroundings. The spectrum of C6 does not suggest a soft component like those in C7 - C9 (5) but the current data do not allow us to constrain the temperature well.
Next we attempt to estimate the physical parameters of those features. For C1 - C5, the spectrum of each feature was obtained, and fitted by a MEKAL model with the temperature and abundance fixed at the best-fit values obtained above (2.3 and 0.9 respectively). From the normalization obtained, we can derive the mean proton density and the gas mass assuming a constant-density sphere. For C6, we simply assumed the same spectrum as that of C1 - C5. The results, as well as the uncertainties, are listed in Table 1.
Thus, the statistics of the current data are not sufficient to constrain the physical parameters of C1 - C6. The integrated C1 - C5 spectrum implies a temperature around 2.5 keV (with about 1 keV error), not significantly different from their surroundings. Their X-ray luminosities are all around 1040 - 1041 ergs s-1. The average proton densities and the gas masses are 10-3 cm-3 and 109 M⊙ respectively.
7 The extended features associated with galaxies
Three extended features were found to be associated with galaxies: NGC 3860 (C8), NGC 3860B (C7) and UGC 6697 (C9) as shown in Fig. 2b and 9. Their properties are listed in Table 3. Seven other member galaxies detected as point-like sources are discussed in paper II.
7.1 Sa galaxy - NGC 3860
This Chandra observation reveals two X-ray components in NGC 3860 (C8), a bright central source and a faint diffuse extension (Fig. 4). The central source is unresolved and its X-ray luminosity is about 10 times larger than that of the diffuse extension. The detailed analysis of this point-like source will be addressed in paper II. Only 110 counts were collected from the diffuse component during the observation. Its spectrum was extracted. The surroundings were taken as the background. The net spectrum can be fitted well by a MEKAL model with a temperature 0.70.2 keV and the luminosity is 1.31040 ergs s-1 (0.5 - 5 keV).
This soft component may be the thermal halo of NGC 3860. Thermal halos in spiral galaxies with temperatures from 0.2 to 0.6 keV have been reported in several nearby spirals based on ROSAT observations (M83 by Ehle et al. 1998; NGC 4258 by Vogler & Pietsch 1999; M81 by Immler & Wang 2001). The luminosities reported in those sources are similar to that of NGC 3860 and the temperatures are consistent. The observed X-ray luminosity of the soft component in NGC 3860 also agrees well with the predicted one scaled from its optical blue luminosity based on LX - LB correlation of field galaxies (e.g., Brown & Bregman 1998).
7.2 Starburst galaxies - NGC 3860B & UGC 6697
NGC 3860B is a starburst galaxy, based on its bright H emission and irregular morphology (private communication with S. Sakai). It appears extended in this observation with a diameter of 0.5′ (Fig. 4). The peak of the X-ray emission is about 0.1′ SW of the optical center. Only about 120 net counts from this source are collected during the observation. If the surroundings were taken as the background, the derived temperature is 0.50.2 keV with the abundance fixed at solar. The derived Lx is 3.01040ergs s-1 (0.5 - 5 keV).
UGC 6697 is a luminous peculiar galaxy with an asymmetrical optical appearance. H and ultraviolet observations revealed that it was a starburst galaxy (Kennicutt et al. 1984; Donas et al. 1990). A radio “trail” on the NW side was detected by Gavazzi & Jaffe (1987). It has been suggested that UGC 6697 is undergoing a dynamical interaction with the ICM assuming the galaxy is moving toward the SE (Gavazzi et al. 1995). Fruscione & Gavazzi (1990) also reported X-ray emission from this galaxy and attributed it to discrete X-ray sources associated with young stars.
In this Chandra observation, UGC 6697 is located in the S1 chip and is 17′ from the aimpoint (the 50% EEAR of PSF there is 17′′). However, as shown in Fig. 9, it is clearly resolved. The X-rays follow the optical light and the SE part is brighter than the NW part. About 800 counts from this source were collected during this observation. Its spectrum was extracted and the background was taken from the surroundings. A thermal thin plasma (MEKAL) model can fit the data well (T=0.70 keV; =15.7/20) but the abundance is very low ( 0.1, 3). Additional components, like a power law or another MEKAL, do not improve the fit significantly. The low heavy element abundance found in UGC 6697 is probably artificial, related to the relatively poor photon statistics. The derived X-ray luminosity is about 1.81041 ergs s-1 (0.5 - 5 keV), which makes UGC 6697 an X-ray luminous starburst galaxy.
Both spectra of NGC 3860B and UGC 6697 show thermal components with temperatures of 0.3 - 0.9 keV and their luminosities roughly scale with their LB. Such thermal components with similar temperatures were also reported by Zezas, Georgantopoulos & Ward (1998) for NGC 3310 and NGC 3690 ( 0.8 keV), and by Dahlem, Weaver & Heckman (1998) for some nearby starburst galaxies (0.65 - 0.9 keV). The observed X-ray to optical luminosity ratios of NGC 3860B and UGC 6697 also agree with those of nearby starbursts (e.g., Dahlem et al. 1998). It has been suggested that during the starburst phase galaxies emit X-rays much more intensely than normal galaxies. The possible explanation of the thermal components involves a galactic superwind, integrated emission from supernova remnants and integrated emission of the young stars (e.g., Rephaeli, Gruber & Persic 1995).
8 Discussion
The Chandra observation of A1367 shows complicated structures around its center: a ridge-like structure and some extended features. For features not associated with galaxies, even in the absence of thermal evaporation losses, ram pressure stripping and Rayleigh-Taylor instabilities may destroy them within 107 - 108 yrs (Nittmann, Falle & Gaskell 1982; Sarazin 1986). We present several possibilities for the nature of these features.
a) Background clusters
One may argue that some features are background clusters at sufficiently high redshift that the galaxies are too faint to show up in a shallow optical exposure. However, based on the log N - log S relation for clusters (e.g., Rosati et al. 1995; Kitayama, Sasaki & Suto 1998), we expect to see approximately 0.2 clusters at flux levels higher than 1.010-14 ergs s-1 cm-2 (0.5 - 2 keV) in the 1010′ field (the flux of the faintest extended feature - C5 - is about 1.410-14 ergs s-1 cm-2). Thus, the probability of seeing two (or three) clusters when 0.2 are expected is 1.610-2 (or 1.110-3). Moreover, five of six features (C1 - C5) seem to be located in the ridge and are aligned with each other, rather than distributed randomly as expected for background clusters. Thus, we conclude that the possibility for one or more features to be background clusters is very small.
b) Features with no galaxies sustained by dark matter halos with little light
C1 - C6 can be supported by massive dark matter halos corresponding to very faint galaxies. The masses needed to sustain gas clouds from thermal diffusion can be estimated as the following. The assumed dark matter halos are required to have masses high enough that GMmH/R 3/2 kT, where R and T are the sizes and the temperature of the feature respectively. Thus, M 6.71011 (T/1 keV) (R/20 kpc). First we check the binding masses needed for C7 - C9. Since we know there are member galaxies associated with them, their total masses can be estimated by assuming M/L = 7(M/L)⊙. The results are presented in Table 3. It is clear that the total masses of the three galaxies are all larger than the masses needed to bind their corresponding extended features. We estimated the binding masses needed for C1 - C6. The results are 1 - 3 1012 M⊙, which is 10 times larger than the total mass of any member galaxy close to C1 - C6 unless the nearby member galaxies have a large mass-to-light ratio of 50. However, the alignment of C1 - C5 is not easy to explain and their similar temperatures to their surroundings imply that they are more likely to be inhomogeneities in the cluster medium.
c) Recently stripped galaxy halos
Takeda, Nulsen & Fabian (1984) suggested some galaxyless extended features reported by B83 might be the blobs of the stripped gas. Based on the results in Nittmann et al. (1982), they estimated that such blobs can survive for about 108 years before being destroyed by Rayleigh-Taylor instabilities. Toniazzo & Schindler (2001) pointed out that these gas halos would be accelerated radially by the cluster potential gradient. Based on the expression they gave for the distance traveled by the gas blobs, we estimate that the blobs will travel about 50 - 150 kpc radially inward before being destroyed. Within 50 - 150 kpc of C1 - C6, there are not many known member galaxies (Fig. 2b). Moreover, it is known from the above discussion that it is difficult to explain each of C1 - C5 by gas stripping of only one galaxy. This scenario also has problem to explain the alignment of C1 - C5.
d) The fragmented core of a merging component
As shown in Fig. 2, on the scale of about 2 h Mpc, the X-ray emission is largely flattened along the SE-NW direction and it can be divided into two parts spatially: one larger part at the SE near the peak of the cluster X-ray emission, and the other smaller part at the NW where there is a clear galaxy concentration centered at NGC 3842. Nevertheless, the galaxy distribution in the SE does not show any condensation near the X-ray center. D98 performed -model fits to these two components and constructed a temperature map based on ASCA data. They suggested an ongoing merging along the SE-NW direction with two subclusters corresponding to the two parts mentioned. This Chandra observation reveals a ridge around the center elongated in the same direction as that of the flattened X-ray emission on a scale of about 2 h Mpc. Five of six extended features with no associated galaxy (C1 - C5) lie along the ridge and form five crests within it, while C6 is still close to the ridge. The ridge may have originally been the core of a subcluster. It is elongated along the merging direction because of the interaction with another subcluster. Instabilities (e.g., Kelvin Helmholtz instability) make it fragment into clumps we now observe (C1 - C5, possibly C6). The discontinuity found at the southern end of the ridge suggests motion of the ridge toward the SE. If this is true, the ridge could not be the core of the SE subcluster since its core is supposed to move to the NW in the interaction with the NW subcluster. Moreover, the shape of the ridge implies it has been distorted to a very large extent, by ram pressure stripping or tidal forces. This is possible for an infalling gas cloud, but not likely for the core of the larger SE subcluster at the very early stage of merging. It is difficult to relate the ridge with the NW subcluster since they are separated spatially (Fig. 2 and 7) and the NW subcluster peaks around a galaxy concentration centered at NGC 3842. Therefore, the ridge would have to be a new merging component, perhaps a compact precursor of the NW subcluster penetrating the SE subcluster. When it passes the SE subcluster, it is elongated and fragmented by ram pressure stripping or tidal force. Simulations show that at the early stage of cluster evolution, clusters may accrete smaller subclusters along filaments (summarized by Bertschinger 1998). Similar examples in X-ray and optical are presented by West (1998) for Coma and Durret et al. (1998) for A85. More observations in wider fields will be helpful to clarify the nature of the ridge.
9 Summary
1) A ridge-like structure was detected around the center of the cluster. The ridge, with a projected size of 38′, is elongated along the SE-NW direction similar to the cluster X-ray emission on scales of 2 h Mpc. It is cooler than its western and southern surroundings. A discontinuity of surface brightness was found at the southern end of the ridge. Although the statistics of the current data do not allow us to constrain the temperature change across this discontinuity, it suggests a motion of the ridge toward the SE. We prefer the ridge is a separate merging component, like a precursor of the NW subcluster.
2) Nine extended features (C1 - C9) were found. They can be divided into two types. Features of the first type (C7 - C9) are associated with galaxies NGC 3860, NGC 3860B and UGC 6697 respectively. Each of their spectra can be fitted well by a single MEKAL model with a temperature of 0.3 - 0.9 keV, while the surrounding ICM is much hotter with temperatures of 3 - 4.5 keV. They are probably thermal halos (especially for C8) and galactic superwind (especially for C7 and C9) of their host galaxies. This implies that thermal halos can survive in cluster environment.
3) Features of the second type are not obviously associated with galaxies. C1 - C5 are aligned and form five crests within the ridge. The temperatures of these features are not significantly different from those of their surroundings. Their luminosities are around 1041 ergs s-1 (0.5 - 5.0 keV) and the gas masses are several times 109 M⊙. Unlike features of the first type, the masses needed to bind them are about 10 times larger than the masses of any nearby member galaxy. In view of their tight spatial correspondence with the central ridge, we suggest they are fragmented clumps of the ridge.
4) The Chandra temperature map confirms that the NW subcluster is relatively hotter than the SE subcluster. It shows some temperature variations and several interesting relatively hot regions.
5) Previously claimed “extended features” were checked. For 18 previously claimed “extended features” in the field, only 6 were confirmed in this observation. The others are either point-like sources, or their combination, or not detected. We conclude that previous observations, especially the one by EHRI, overestimate the number of extended features in this cluster because of the limitations of those instruments.
References
- (1)
- (2) Anders, E., & Grevesse N. 1989, Geochimica et Cosmochimica Acta, 53, 197
- (3)
- (4) Arnaud, M. et al. 2001, A&A, 365, L67
- (5)
- (6) Bahcall, N. A. 1977, ARA&A, 15, 505
- (7)
- (8) Bechtold, J., Forman, W., Giacconi, R., Jones, C., Schwarz, J., Tucker, W., Van Speybroeck, L. 1983, ApJ, 265, 26 (B83)
- (9)
- (10) Bertschinger, E. 1998, ARA&A, 36, 599
- (11)
- (12) Brown, B. A., Bregman, J. N. 1998, 495, L75
- (13)
- (14) Canizares, C. R., Fabbiano, G., Trinchieri, G. 1987, ApJ, 312, 503
- (15)
- (16) Dahlem, M., Weaver, K. A., Heckman, T. M. 1998, ApJS, 118, 401
- (17)
- (18) Donnelly, R. H., Markevitch, M., Forman, W., Jones, C., David, L. P., Churazov, E., Gilfanov, M. 1998, ApJ, 500, 138 (D98)
- (19)
- (20) Donas, J., Buat, V., Milliard, B., & Laget, M. 1990, A&A, 235, 60
- (21)
- (22) Durret, F., Forman, W., Gerbal, D., Jones, C., & Vikhlinin, A. 1998, A&A, 335, 41
- (23)
- (24) Ehle, M., Pietsch, W., Beck, R., Klein, U. 1998, A&A, 329, 39
- (25)
- (26) Forman, W., Jones, C. 1982, ARA&A, 20, 547
- (27)
- (28) Fruscione, A., Gavazzi, G. 1990, A&A, 230, 293
- (29)
- (30) Gavazzi, G., Jaffe, W. 1987, A&A, 186, L1
- (31)
- (32) Gavazzi, G., Contursi, A. 1994, AJ, 108, 24
- (33)
- (34) Gavazzi, G. et al. 1995, A&A, 304, 325
- (35)
- (36) Grebenev, S. A., Forman, W., Jones, C., Murray, S. S. 1995, ApJ, 445, 607 (G95)
- (37)
- (38) Immler, S., Wang, Q. D. 2001, ApJ, 554, 202
- (39)
- (40) Jones, C., Mandel, E., Schwarz, J., Forman, W., Murray, S. S., Harnden, F. R., Jr. 1979, ApJ, 234, L21
- (41)
- (42) Kennicutt, R. C., Bothun, G. D., Schommer, R. A. 1984, AJ, 89, 1279
- (43)
- (44) Kitayama, T., Sasaki, S., & Suto, Y. 1998, PASJ, 50, 1
- (45)
- (46) Lazzati, D., Campana, S., Rosati, P., Chincarini, G., Giacconi, R. 1998, A&A, 1998, 331, 41 (L98)
- (47)
- (48) Markevitch, M. et al. 2000, ApJ, 541, 542
- (49)
- (50) Nittmann, J., Falle, S. A. E. G., & Gaskell, P. H. 1982, MNRAS, 201, 833
- (51)
- (52) Rephaeli, Y., Gruber, D., & Persic, M. 1995, A&A, 91, 300
- (53)
- (54) Rosati, P. et al. 1995, ApJ, 445, L11
- (55)
- (56) Sarazin, C. L. 1986, Rev. Mod. Phys. 58, 1
- (57)
- (58) Sun, M., & Murray, S. S. 2002, ApJ, submitted (paper II; astro-ph/0202431)
- (59)
- (60) Takeda, H., Nulsen, P. E. J., & Fabian, A. C. 1984, MNRAS, 208, 261
- (61)
- (62) Toniazzo, T., & Schindler, S. 2001, MNRAS, 325, 509
- (63)
- (64) Vikhlinin, A., Forman, W., Jones, C. 1997, 474, L7
- (65)
- (66) Vikhlinin, A. 2000, Chandra calibration memo, http://asc.harvard.edu/cal/Links/Acis/acis/Cal_prods/qe/12_01_00/
- (67)
- (68) Vikhlinin, A., Markevitch, M., Forman, W., & Jones, C. 2001, ApJL, 555, 87
- (69)
- (70) Vogler, A., & Pietsch, W. 1999, A&A, 352, 64
- (71)
- (72) West, M. J. 1998, Proc. Workshop “A new vision of an old cluster: untangling Coma Berebices”, Marseille, June, 17-20, 1997, Eds. Mazure et al.
- (73)
- (74) Zezas, A. L., Georgantopoulos, I., Ward, M. J., 1998, MNRAS, 301, 915
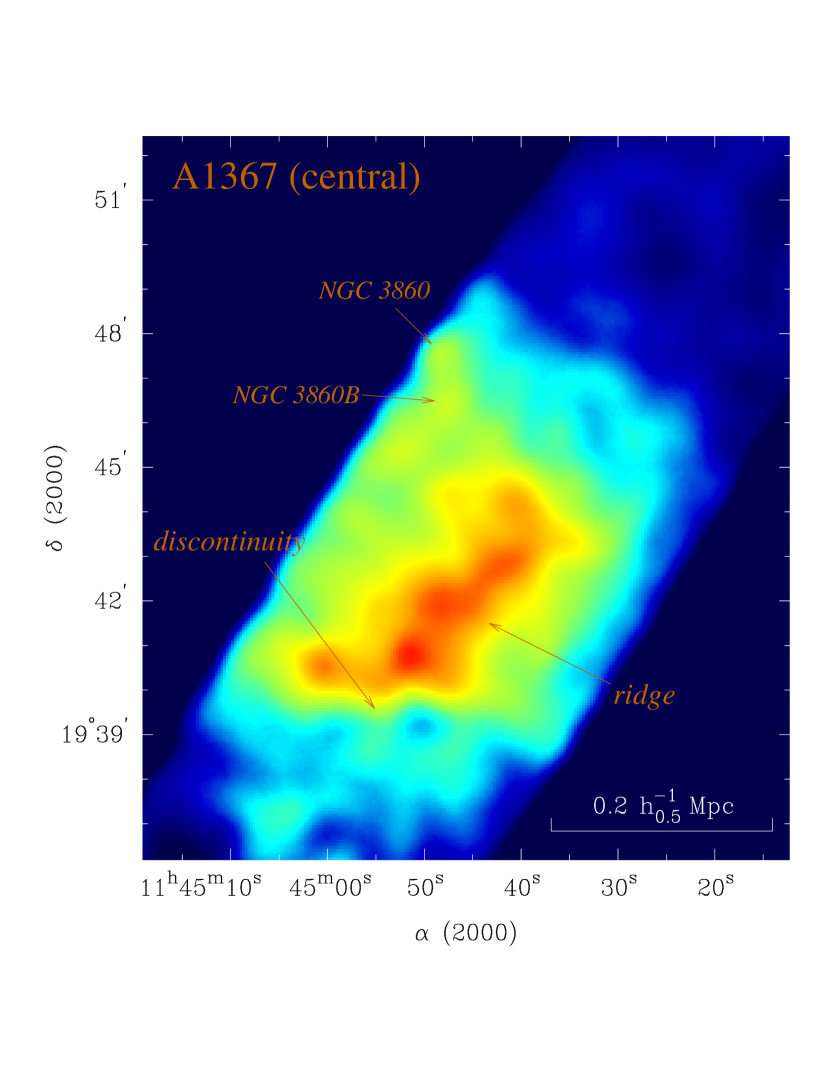
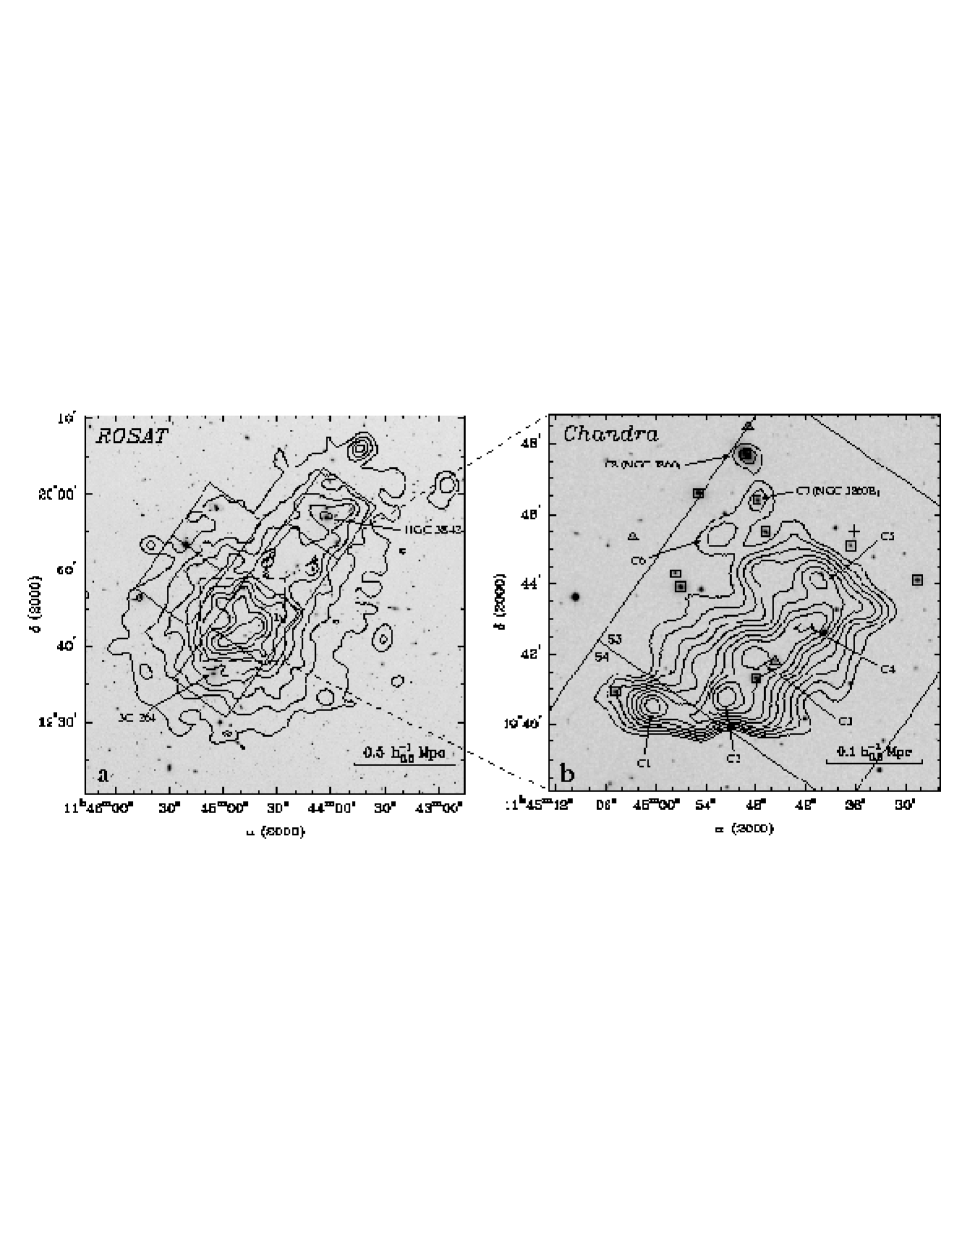
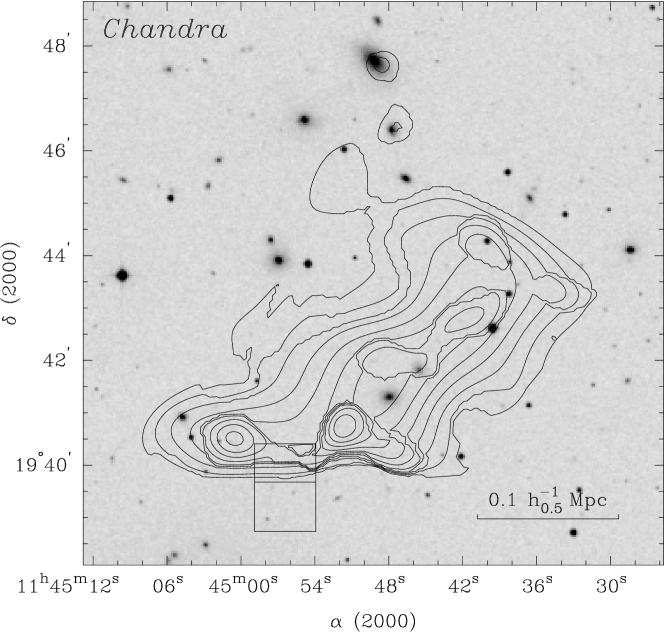


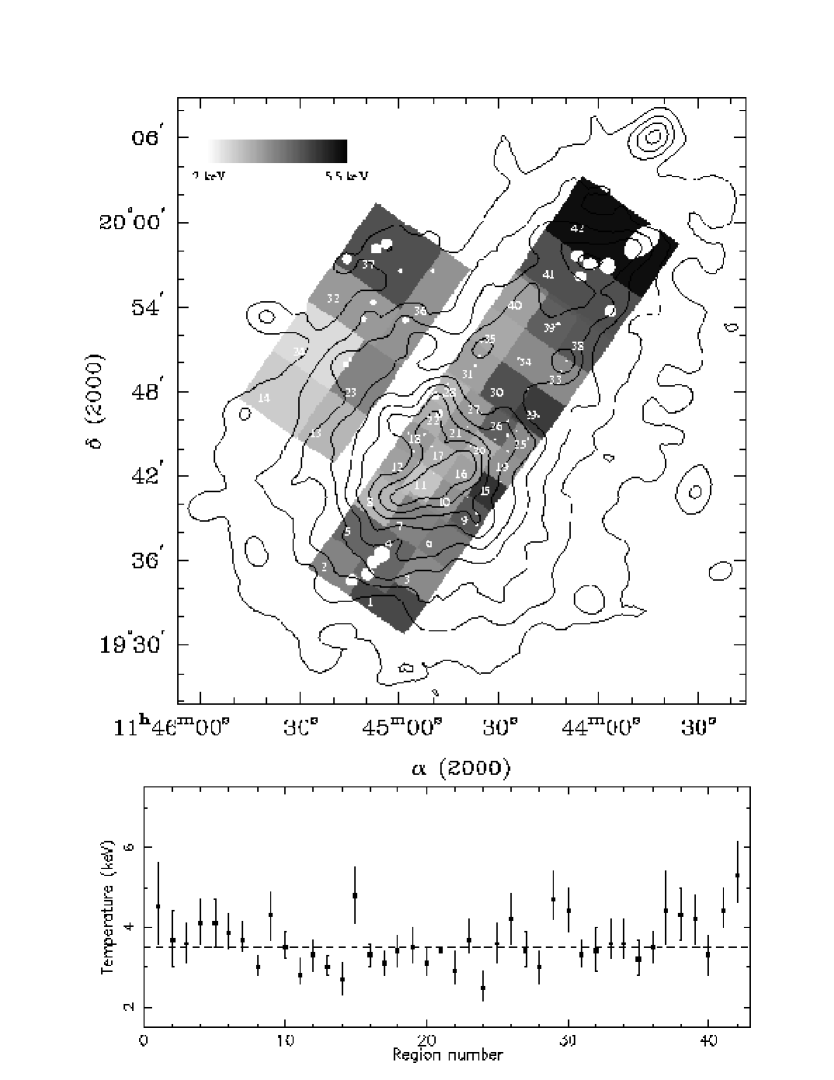
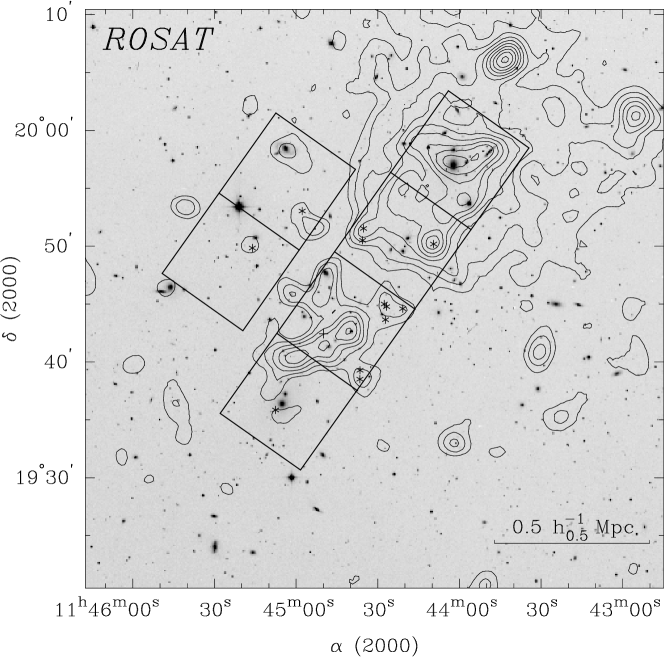

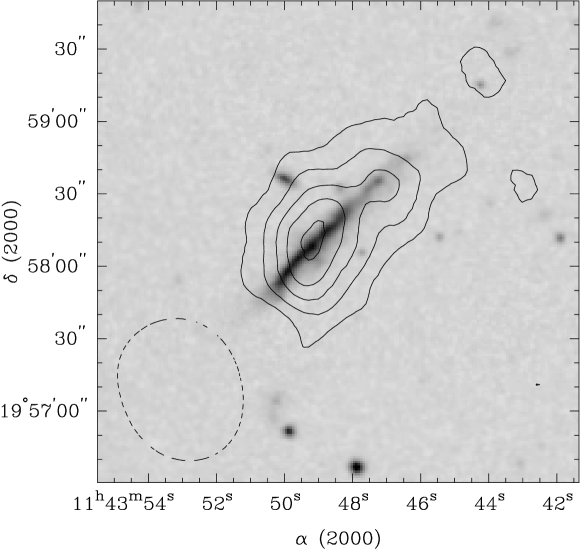
TABLE 1
Chandra Extended Sourcesa
| # | R.A.b | DEC.b | Sizec | S/Nd | Countse | Tf | L | h | Mgasi | Commentj |
| (J2000) | (J2000) | (′′) | () | (keV) | (1041 ergs s-1) | (10-3 cm-3) | (109 M⊙) | |||
| C1 | 11:45:00.4 | 19:40:32 | 21 | 6.7 | 24633 | (2.3) | 1.1 | 1.8 | 3.6 | Gp21 |
| C2 | 11:44:51.5 | 19:40:44 | 22 | 7.2 | 33542 | (2.3) | 1.1 | 1.8 | 4.0 | part of Gp17 |
| C3 | 11:44:48.3 | 19:41:52 | 25 | 5.0 | 25248 | (2.3) | 0.9 | 1.5 | 5.2 | Gp17 |
| C4 | 11:44:41.8 | 19:42:48 | 28 | 6.3 | 33247 | (2.3) | 1.0 | 1.4 | 6.4 | Gp14 |
| C5 | 11:44:40.3 | 19:44:07 | 19 | 4.3 | 16534 | (2.3) | 0.5 | 1.6 | 2.4 | |
| C6k | 11:44:52.3 | 19:45:23 | 17 | 4.0 | 12730 | (2.3) | 0.4 | 1.5 | 1.6 | |
| C7l | 11:44:47.5 | 19:46:21 | 7 | 5.4 | 12425 | 0.3 - 0.8 | 0.3 | 4.6 | 0.3 | Gp18*, NGC 3860 B |
| C8l | 11:44:49.0 | 19:47:41 | 8 | 5.1 | 11222 | 0.5 - 0.9 | 0.1 | 4.0 | 0.2 | Gp18, NGC 3860 |
| C9l | 11:43:48.7 | 19:58:10 | 231 | 18.9 | 80332 | 0.6 - 0.9 | 1.8 | 12.4m | 4.5m | Gp4, UGC 6697 |
a Detected in the Chandra image in the 0.5 - 5 keV energy band. The sizes, signal-to-noise ratios, and net counts of the features were also derived based on the image in the 0.5 - 5 keV energy band.
b The positions were determined by the peaks of those extended features in the smoothed image and wavelet reconstructed image. The uncertainty is 5′′.
c Here source sizes are defined as 50% EEAR, deriving from the radial profiles of sources. Three background uncertainties have been included in the errors. The regions that we used to measure the significance and net counts, as well as extracting spectra, are circles with radii of twice 50% EEAR measured.
d We define S/N as S / , where S is the signal and B is the background. Background is taken from the surroundings. The detection threshold is set at 4 . The uncertainties of S/N, from the uncertainties on the background, are less than 10%.
e The net counts are measured from apertures with sizes of twice 50% EEAR listed on the left. Background is taken from the immediate surroundings. The errors listed are the uncertainty from 1 errors of the background.
f Temperatures inside the brackets are fixed. 2.3 keV is the best-fit temperature of integrated C1 - C5 spectrum (the 90% confidence regime is 1.8 - 3.7 keV). For simplicity, we assumed a same spectrum of C6 to C1 - C5 since it is hard to constrain its spectrum. For C7 - C9, since they are relatively cool, their temperatures can be constrained better.
g In the 0.5 - 5 keV energy band. Except C6, uncertainties on Lx from temperature and abundance are at most 20%. However, the uncertainties from the background can reach up to 35%. For C6, the uncertainty can be as large as 50%.
h Estimated from the best-fit normalization and assumed a sphere with constant density. The uncertainties from background and the fits can be up to 30%. For C6, the density can be changed by a factor of 2 under different assumption.
i Except C6, uncertainties can be up to 30%. For C6, the gas mass can be changed by a factor of 2 under different assumption.
j Gp# means the PSPC source # in G95.
k There is a detector feature across C6 so that it is the most poorly determined one.
l To derive the luminosities, densities and gas masses of C7 - C9, their redshifts rather than the cluster redshift were used. Since the diffuse X-rays from C7 - C9 may not all come from their thermal halos, the listed densities and gas masses may be over-estimates.
m Since C9 is far from the aimpoint, it is hard to constrain the physical size of C9. Here we just assumed an optical size of 1.60.5′.
TABLE 2
Extended Sources claimed by previous worka
| Source IDb | Lx (1041 ergs s-1)f | Chandra resultg | |||
| B83c | G95d | L98e | B83 | G95 | |
| Be2 | Ge7 (p), Gp10 (p) | Lp26 (p) | - | -, - | bright point source 4 (50% EEAR of PSF: 4′′) |
| Be3 | Ge9, - | - | - | 1.3, - | No detection, 3 upper limit: 1.21040 ergs s-1 |
| Be4 | -, - | - | 1.5 | -, - | No detection |
| Be5 | Ge14, Gp11* | - | 3.7 | 0.95, | bright point source 1 and fainter one (CGCG 097-109) |
| Be6 | Ge17, Gp12 | Lp10 | - | 2.2, 1.8 | bright point source 2 and 3 |
| Be7 | Ge19, - | - | 4.6 | 1.9, - | No detection, 3 upper limit: 1.81040 ergs s-1 |
| Be8 | Ge22, Gp18 (p) | Lp16 | 2.9 | 2.0, - | bright nucleus source and extended feature of NGC 3860 (C8) |
| Be9 | Ge21, Gp17 | - | 6.5 | 1.3, 7.7 | extended feature C3, part of Gp17 may include C2 |
| Be12 | -, - | - | - | -, - | No detection |
| Be13 | Ge16, - | - | 3.7 | 1.5, - | No detection, 3 upper limit: 1.51040 ergs s-1 |
| Be14 | Ge26 (p) | - | - | -, - | No detection |
| Be15 | -, - | - | 3.5 | -, - | No detection |
| - | -, Gp14 | Lp11 | - | -, 3.6 | extended feature C4 |
| - | -, Gp18*h | - | - | -, 6.9 | extended feature C7 (NGC 3860B) |
| - | -, Gp21 | - | - | -, 1.7 | extended feature C1 |
| - | Ge25 (p), Gp23 | Lp9 (p) | - | -, 2.4 | NGC 3861 and 3861B (all point-like; 50% EEAR of PSF: 12′′) |
| - | -, Gp27 | - | - | -, 0.74 | No detection, 3 upper limit: 1.61040 ergs s-1 |
| - | -, Gp4 (p) | Lp7 | - | -, - | UGC 6697 (C9), extended along the optical elongation |
a Only those previously claimed extended sources in the field are included (18 of 26) and unless pointed out, all sources are extended. B83 means Bechtold et al. (1983); G95 means Grebenev et al. (1995); L98 means Lazzati et al. (1998).
b ‘-’ means no detection, and ‘(p)’ means point source.
c Source number in B83 (based on EHRI data); the first letter of the source ID indicates the author and ‘e’ means EHRI. The number represents the order of the source in Table 4 of B83.
d Source number in G95 (based on PSPC data and same EHRI data as those used in B83); similarly, the first letter of the source ID represents the author, while ‘e’ means EHRI and ‘p’ means PSPC. The number refers to that in Table 1 and 3 of G95.
e Source number in L98 (based on the same PSPC data as those used in G95); the number come from Table 2 of L98.
f In the 0.5 - 5 keV energy band. We converted the luminosities listed in B83 and G95 from their energy bands to the 0.5 - 5 keV band and use h=0.5. ‘-’ means no value was provided in the paper.
g The source number in Fig. 2a; for the extended features confirmed by Chandra (sources represented by ’c’), we list the results in Table 1. The 3 upper limit (0.5 - 5 keV) depends on the assumed spectrum and source size. Here we assumed 1 keV thermal plasma (MEKAL) with a solar abundance (as G95) and used the sizes determined by G95. For such kind of sources with typical sizes 0.5′ - 1.5′, the 3 upper limits are 1 - 4 1040 ergs s-1 (0.5 - 5 keV), which are also dependent on positions on the detector. For B83 sources not recognized as extended sources in both G95 and L98, we do not list the 3 upper limits.
h Gp18* was attributed to Be7/8 in G95, but they are different based on the published positions.
TABLE 3
Member galaxies detected as X-ray extended featuresa
| Name | Type | Velocity | Log (LB/L⊙) | Radiob | Infrared | X-rayc | #d | Total masse | Binding massf |
| (km/s) | (1011 M⊙) | (1011 M⊙) | |||||||
| NGC 3860 | Sa | 55958 | 10.72 | 76 | IRAS 11422+2003 | Ge22, Gp18 | 1, C8 | 3.7 | 1.8 |
| NGC 3860B | Irr | 82939 | 10.53 | 75 | - | Gp18* | 2, C7 | 2.4 | 2.1 |
| UGC 6697 | Irr | 67252 | 11.00 | 58 | IRAS 11412+2014 | Gp4 | 9, C9 | 7 | 3.8 |
a The velocity and LB of the galaxies are from NED.
b The source number in Gavazzi & Contursi (1994)
c The source number in G95
d The source number in Fig. 2a and Table 1
e The total mass is estimated by assuming M/L = 7(M/L)⊙.
f The binding mass needed to trap the thermal halos observed. It is estimated by the expression in 7. The sizes of sources are obtained from Table 1 and their temperatures are assumed to be 0.75 keV. All estimated binding masses are less than the estimated total masses.