Physical structure of the protoplanetary nebula CRL 618. I. Optical long-slit spectroscopy and imaging
Abstract
In this paper (paper I) we present optical long-slit spectroscopy and imaging of the protoplanetary nebula CRL 618 (catalog ). The optical lobes of CRL 618 consist of shock-excited gas, which emits many recombination and forbidden lines, and dust, which scatters light from the innermost regions. From the analysis of the scattered H emission, we derive a nebular inclination of =24°6°. The spectrum of the innermost part of the east lobe (visible as a bright, compact nebulosity close to the star in the H image) is remarkably different from that of the shocked lobes but similar to that of the inner H II region, suggesting that this region represents the outermost parts of the latter. We find a non-linear radial variation of the gas velocity along the lobes. The largest projected LSR velocities ( 80 km s-1) are measured at the tips of the lobes, where the direct images show the presence of compact bow-shaped structures. The velocity of the shocks in CRL 618 is in the range 75-200 km s-1, as derived from diagnostic line ratios and line profiles. We report a brightening (weakening) of [O III]5007Å ([O I]6300Å) over the last 10 years that may indicate a recent increase in the speed of the exciting shocks. From the analysis of the spatial variation of the nebular extinction, we find a large density contrast between the material inside the lobes and beyond them: the optical lobes seem to be ‘cavities’ excavated in the AGB envelope by interaction with a more tenuous post-AGB wind. The electron density, with a mean value 5103-104 cm-3, shows significant fluctuations but no systematic decrease along the lobes, in agreement with most line emission arising in a thin shell of shocked material (the lobe walls) rather than in the post-AGB wind filling the interior of the lobes. The masses of atomic and ionized gas, respectively, in the east (west) lobe are 1.310-4 (710-5 ) and 610-5 (410-5 ). The shocks in CRL 618 are in a radiative regime and may lead in the future to the evolution of the optically-emitting lobes into a fast, bipolar molecular outflow. The time required by the dense, shocked gas to cool down significantly is 2 yr, which is substantially lower than the kinematical age of the lobes ( 180 yr). This result suggests that a fast wind is currently active in CRL 618 and keeps shocking the circumstellar material.
1 Introduction
The physical mechanisms responsible for the onset of bipolarity and polar acceleration in planetary nebulae (PNe) are already active in the first stages of the evolution beyond the Asymptotic Giant Branch (AGB), i.e. in proto-Planetary Nebulae (PPNe, also called post-AGB objects). Therefore, PPNe and young PNe hold the key for understanding the complex and fast ( 103 yr) nebular evolution from the AGB towards the PN phase. Such evolution is believed (by an increasing number of astronomers) to be governed by the interaction between fast, collimated winds or jets, ejected in the late-AGB or early post-AGB phase, and the spherical and slowly expanding circumstellar envelope (CSE) resulted from the star mass-loss process during the AGB (see Sahai & Trauger, 1998; Kastner, Soker, and Rappaport, 2000).
CRL 618 (catalog ) (= RAFGL 618 (catalog ) = IRAS 04395+3601 (catalog ) = Westbrook Nebula (catalog )) is a well studied PPN which has very recently started its post-AGB journey (only 200 yr ago, e.g. Kwok & Bignell, 1984) and is rapidly evolving towards the PN stage. Most of the circumstellar matter in CRL 618 is still in the form of molecular gas. This component, with a total mass of 1.5, consists of: (1) a spherical and extended ( 20″) envelope expanding at 17.5 km s-1 (Knapp & Morris, 1985; Bujarrabal et al., 1988, 2001; Bachiller et al., 1988; Hajian, Phillips, & Terzian, 1996; Phillips et al., 1992); and (2) an inner, compact bipolar outflow moving away from the star at velocities 200 km s-1 (Cernicharo et al., 1989; Gammie et al., 1989; Meixner et al., 1998; Neri et al., 1992). The outer, and slowly expanding component is interpreted as the result from the mass-loss process of the central star during the AGB, which took place at a rate of = few 10-5-10-4 yr-1. The fast bipolar outflow, with a mass of 10-2, is believed to be the result of the interaction between a fast, collimated post-AGB wind and the spherical AGB CSE (see references above).
The high-excitation nebula (atomic and ionized gas) is composed of: (1) a compact H II region, visible through radio-continuum emission, elongated in the E-W direction with an angular size of 02-04 that is increasing with time (Kwok & Feldman, 1981; Martín-Pintado et al., 1993); and (2) multiple lobes with shock-excited gas which produces recombination and forbidden line emission in the optical (e.g. Goodrich, 1991; Trammell, Dinerstein, and Goodrich, 1993; Kelly, Latter, and Rieke, 1992; Trammell, 2000). From previous spectroscopic data, the inner H II region and the lobes are known to be expanding with velocities of 20 km s-1 and up to 120 km s-1, respectively (Martín-Pintado et al., 1988; Carsenty and Solf, 1982). The analysis of different optical line ratios indicates that a relatively large range of temperatures ( 10,000 to 25,000 K) and densities ( 1600 to 8000 cm-3) are present in the lobes (Kelly, Latter, and Rieke, 1992).
The optical spectrum of CRL 618 also shows a weak, red continuum which is the stellar light reflected by the nebular dust. From spectropolarimetric observations it is known that a fraction of the flux of the Balmer lines is also scattered light originally arising from the inner, compact H II region (Schmidt and Cohen, 1981; Trammell, Dinerstein, and Goodrich, 1993). The polarization of the forbidden lines is negligible, indicating that they are almost entirely produced by the shock-excited gas in the lobes with a small or insignificant contribution by scattered photons from the H II region (the high density in this region, 106 cm-3, produces collisional de-excitation of most forbidden lines).
The central star of CRL 618 has been classified as B0 based on the shape of the dereddened visual continuum (Schmidt and Cohen, 1981) and on the weak [O III] line emission from the inner, compact H II region (Kaler, 1978). The luminosity of CRL 618, obtained by integrating the observed IRAS fluxes, is (Goodrich, 1991). Based on the values predicted by evolutionary models ( 104) and the typical scale height of PN ( 120 pc) these authors calculate a distance to the source of 0.9 kpc, which we also assume in this paper.
In this paper (paper I of a series of two) we report optical imaging and long-slit spectroscopy of CRL 618. Observational techniques and data reduction are described in Sect. 2. In Sections 3 and 4 we present our observations, including a brief description of the nebular morphology and main characteristics of the optical spectrum. In Sect. 5 we analyze the different emission line components and study the physical properties of the different nebular regions probed by them. In Sects. 6 and 7 we derive the mean nebular inclination and describe the kinematics of CRL 618, respectively. The spatial distribution along the nebular axis of the extinction and the electron density are presented, respectively, in Sects. 8 and 9. In the latter, we also estimate the atomic and ionized mass in different regions. Finally, we discuss our results and give a possible scenario to explain the formation and future evolution of CRL 618 in Sect. 10. The main conclusions of this work are summarized in Sect. 11.
2 Observations and data reduction
2.1 Optical imaging
2.1.1 Ground-based
We have obtained narrow-band images of the H line and the adjacent continuum emission in the PPN CRL 618 (Fig. 1a,b). Observations were carried out on November 8th and 9th, 2001 with the Palomar Observatory 60-inch telescope. The detector was the CCD camera #13, which has 20482048 pixels of 24m in size and provides a plate scale of 0378 pixel-1. The narrow-band filters used for imaging the H line and adjacent continuum are centered at 6563 and 6616 Å, respectively, and have a full width at half maximum (FWHM) of 20 Å. Weather conditions during the observations were good, although non-photometric, and the seeing ranged between 09 and 2″. The final spatial resolution of the H (continuum) combined images is 19 (11). Total exposure times are 2700 s for the H image and 6300 s for the continuum.
Data reduction, including bias subtraction, flat field correction, removal of cosmic rays and bad pixels, and registering+combination of individual images, was performed following standard procedures within IRAF111IRAF is distributed by the National Optical Astronomy Observatories, which are operated by the Association of Universities for Research in Astronomy, Inc., under cooperative agreement with the National Science Foundation..
Astrometry of our images was done cross-correlating the coordinates of 376 and 187 field stars (for H and the continuum, respectively) in the CCD and those in the USNO-A2.0 catalog. This procedure yields a plate scale of 03780009 pixel-1. The coordinates of the origin of our spatial scale in our images are R.A.= 04h42m5355 and Dec.= 36°06′545 (J2000). The errors of the absolute positions derived are 04 (considering the standard deviation of our best calibration solution, 015, and the absolute position error of the USNO stars, about 025).
We have obtained a pure H line emission image by subtracting the continuum emission to our original H+continuum image. The continuum image was first smoothed to match the lower effective spatial resolution of the H image and then the flux of several field stars was measured in both images to derive a scaling factor that includes the differences of the system ‘filter+CCD’ response between the two images as well as the different exposure times and sky transparency when the observations were performed.
Flux calibration was performed using the USNO-A2.0 magnitudes of the field stars. The error in the flux calibration is dominated by the absolute flux error in the USNO-A2.0 catalog (55%). The flux calibration of the H and continuum images is consistent with our calibrated long-slit spectra within a factor 2.
2.1.2 Hubble Space Telescope
As a complement to our data, we have used the high angular resolution H image of CRL 618 from the Hubble Space Telescope () archive (GO 6761, PI: S. Trammell). This image was obtained with the Wide Field Planetary Camera 2 (WFPC2) and the narrow-band filter F656N, around the H line. The WFPC2 has a 36″36″ field of view and a plate scale of 00455 pixel-1. The image (Fig. 1c) is pipeline-reduced.
2.2 Optical long-slit spectroscopy
We obtained optical long-slit spectra of CRL 618 on November 12th and 13th 2000, using the Intermediate Dispersion Spectrograph (IDS) of the 2.5m Isaac Newton Telescope of the Roque de los Muchachos Observatory (La Palma, Spain). The detector was the EEV10 CCD, with squared pixels of 13.5m lateral size. Only a clear and unvignetted region of 7002600 pixels was used (the 2600 pixels were along the spectral axis). The CCD was mounted on the 500mm camera, leading to a spatial scale of 019 pixel-1. The R1200Y and R900V gratings were employed providing spectra in the (6233-6806)Å and (4558-5331)Å wavelength ranges with dispersions of 16.4 Åmm-1 (0.22 Åpixel-1) and 22.1 Åmm-1 (0.29 Åpixel-1), respectively.
A total of three slit positions were observed at position angles (PA) of 93° (along the nebular symmetry axis) and 3° (through the west lobe of the nebula). The slit positions are shown in Fig. 2 superimposed on the H ground-based image of CRL 618. At PA=93° two spectra were obtained: one with the slit placed on the northernmost pair of lobes (hereafter, slit N93) and the other one with the slit displaced 1″ towards the South (partially covering the southernmost lobes; slit S93). At position N93, spectra with two gratings, R1200Y and R900V, were obtained with exposures times of 2000 s and 2700 s, respectively. For the other two slit positions (S93 and PA=3°) only the R1200Y was used, and exposure times were 2000 s and 1300 s respectively. The slit was 1″ wide and long enough to cover the whole nebula (and a significant region of the sky).
The data were reduced following standard procedures for long-slit spectroscopy within the IRAF package, including bias subtraction, flat-fielding and illumination corrections, sky subtraction, and cosmic-ray rejection. We used CuNe and CuAr lamps to perform the wavelength calibration. The spectral resolution achieved (FWHM of the calibration lamp lines) is 50 km s-1, at H, and 80 km s-1, at H. Flux calibration was done using sensitivity functions derived from two spectrophotometric standards, HR1544 and HD217086, observed at different airmasses, and taking into account the atmospheric extinction curve at La Palma. The geometric distortion of the long-slit spectra ( 0.06%) was corrected also using one of the flux calibration stars. The effective spatial resolution obtained ranges between 1″ and 16.
3 Morphology of the optical nebula
In Fig. 1 we show direct images of the PPN CRL 618 in the light of the 6616 Å continuum (a) and H line emission (b and c) obtained from the ground and with . The H images show the shocked, optical lobes of CRL 618 consist of several components with a very rich structure at a scale of 02 (see Fig. 1c). The east and west lobes are both composed of several, collimated jet-like structures emanating from the center of the nebula. Bright, bow-shaped ripple-like features are frequent along the lobes.
In the H images of CRL 618 we have labeled A’ the small, bright region of the east lobe closer to the nebular center (Fig. 1c). This region is very bright in the H image but very weak, e.g., in the WFPC2/ [O I]6300 Å and [S II]6716,6731 Å images (see Trammell 2000; Sahai et al. 2002, in preparation). As we will see in the following sections, the spectrum of region A’ is in fact substantially different from that of the shock-excited lobes. This leads us to think that region A’ has a different nature, which we discuss in § 5.2.
A weak H emission halo surrounds the lobes of CRL 618 (Fig. 1b,c). In the H image the halo is observed very close to the boundaries of the emission lobes and is particularly intense and extended in the east lobe: note the clumps of diffuse emission ahead of this lobe (i.e. just beyond the tip of the lobe). The diffuse halo, like region A’, is absent in the [O I] and [S II] images (see references above). In our ground-based H image (with higher signal-to-noise ratio than that obtained with the ) the size at a 3 level of the halo is 35″22″, with the major axis roughly oriented at PA=3° and centered at the position where the maximum H emission is observed.
The continuum image of CRL 618 traces the distribution of the dust particles in the nebula (which reflect the stellar light) as well as any field star. The central star of CRL 618 is not directly visible, which indicates that the stellar light is strongly obscured along the line of sight. The continuum brightness distribution is in general similar to that of H, suggesting the presence of dust in the lobes.
4 The optical spectrum of CRL 618
The optical spectrum of CRL 618 is composed of recombination and forbidden line emission superimposed on a faint, red continuum.
4.1 Long-slit spectra of emission lines
In Fig. 2 we show long-slit spectra for the most intense lines in the [6230–6805] Å range for slits N93, S93, and PA3. The weakest lines detected in this range, [S III]6312.1 Å and He II6678 Å, for slit N93 are shown in Fig. 3. These spectra have been smoothed with a flat-topped rectangular kernel of dimension 33 pixels: the resulting degradation in the spatial and spectral resolution is less than 4% from the nominal value (see §2.2) since the smoothing window was smaller than the local seeing and FWHM of the calibration lines. The origin of the spatial scale in the spectra (and in the images to the left and in Fig. 1) coincides with the point of maximum extinction (measured as the highest H/H line ratio; § 8). We will refer to this point also as to nebular center. The LSR systemic velocity of the source, =–21.50.5 km s-1 (derived from molecular line emission observations, e.g., Cernicharo et al., 1989) is indicated by a vertical line on each spectrum.
We find remarkable differences between the profile of the H line (and also H, see below) and those of most forbidden lines for each slit position. These differences are specially noticeable in the bright east lobe. A number of spectral features222“Feature” refers to a component in our two-dimensional spectra. (labeled A, B, and C in Fig. 4) are seen to be superimposed on an underlying H profile very similar to that of [O I]6300 Å (and most forbidden lines). (Carsenty & Solf, 1982, noted also the presence of two different components in the H profile, see § 5.1).
Feature A is the intense H emission component observed in the innermost region (closest to the central star) of the east lobe. The maximum emission from this feature occurs at offset 14. For slit N93 such maximum is slightly red-shifted ( 3.5 km s-1) with respect to whereas for S93, feature A is blue-shifted by 10 km s-1. From comparison with the H images of CRL 618 we determine that feature A originates in the inner region A’ (Fig. 1). There is also some blue-shifted [N II]6548,6584 Å, [S III]6312 Å and He II6678 Å emission arising in this region, which we refer to as emission feature “a” by analogy to feature A in the H profile (Figs. 3 and 4). Feature B is the broad, red-shifted wing around offset 25 and +35, in our N93 and S93 spectra. This feature is prominent in regions where the scattered continuum reaches maximum intensity (see Fig. 5 and the continuum image in Fig. 1). Feature B is also present in the PA3 H spectra. Feature C is the slightly red-shifted emission component observed close to the systemic velocity from offsets +6 to +12″ in our N93 and S93 spectra. We note that feature C extends beyond the region where forbidden line emission is observed (i.e., beyond the shocked lobes). From comparison with the H direct images of the nebula we conclude that feature C originates in the weak ‘halo’ which surrounds the bright lobes (Fig. 1). This halo is visible towards the east up to offsets +20″ in our deep, H ground-based image. Feature C is also present along slit PA3, which crosses the lobes and the halo at the outermost parts of the east lobe. We have labeled “C?” the weak, red-shifted emission beyond the west lobe in slits N93 and S93 (Fig. 4). This tentative feature (also marginally present in the H profile) has a redshift slightly larger than that of feature C.
For slit S93, the maxima in the H and forbidden (e.g. [O I]) line emission are observed at different spatial and spectral positions: the H emission peak is red-shifted and located at offset 35, whereas the maximum emission from most forbidden lines is clearly blue-shifted and located at offset 42. The reason for this difference is that the H emission peak is most likely the result of the superposition of features C, B, and maybe A on top of the lobe emission and not only emission produced locally in the east lobe.
In Fig. 5 we present the long-slit spectra obtained along the nebular axis (N93) in the wavelength range [4558-5331] Å. The H profile is similar to that of H, except that feature A is less prominent for the former very likely due to a larger extinction towards the nebular center. Features B and C are clearly detected in the H profile up to (projected) velocities of 290 km s-1 (LSR) and around , respectively.
The profile of [O III]5007 Å is similar to that of H: note the maximum emission slightly red-shifted at the position where the continuum is detected in our spectra (coincident with feature B in H) and the weak emission closer to the nebular center (coincident with feature A). The profile of the [N I] doublet (partially resolved) is different from H and [O III] but similar to most forbidden lines in the red.
We have detected a number of weak emission lines in this wavelength range, most of them from Fe ions. The [Fe III] lines, similarly to the [S III] line, are observed in the region where the scattered continuum reaches its maximum intensity and in the inner region where feature A arises, with no trace of emission from the outer parts of the shocked lobes. The [Fe II] lines are remarkably intense at the tips of the lobes and show no sign of H-analog features, i.e. they show no emission from region A’ or the region of maximal continuum emission.
At 4650 Å, we also detect a faint and broad emission feature, which is only visible in the region where the continuum is observed for the east lobe. We identify this feature with the Wolf-Rayet bump at 4650 Å (see below).
4.2 Line identification and flux measurements
We list in Table 1 all the lines that we have detected in the optical spectra of CRL 618 together with their air wavelengths and fluxes (undereddened). The fluxes have been estimated from slit N93 (for other slits only the lines in the red wavelength range were observed), integrating the emission of the pixels above the 3 level along the slit and in the spectral direction.
Most of the lines in Table 1 were already detected and identified in this source from previous optical spectroscopy (see references in § 1), however we find some new features in this work. The most relevant of the new identifications is the Wolf-Rayet bump (WR-bump) at 4650Å (Fig. 5). This bump is a blend of high excitation lines such as N III 4634-41 Å, and C III 4647-51 Å (e.g. Tylenda, Acker, & Stenholm, 1993). The C IV4658.3 Å line, usually considered as a part of the WR-bump, is listed separately in Table 1 together with the blended [Fe III]4658.1 Å line, because it is spectrally resolved from the rest of the bump in our spectra. The WR-bump333The C III/C IV lines in the WR-bump are observed in the majority of [WC]-type central stars of PNe (Leuenhagen, Hamann, & Jeffery, 1996) but also in some normal PNe (i.e. with no [WC]-type central stars; Aller & Keyes 1987). In the latter, where N III lines are also found, these high-excitation transitions are the result of nebular emission. Therefore, the presence of the WR-bump in the spectrum of CRL 618, while potentially interesting and deserving further investigation, is not sufficient to conclude that it has a [WC]-type central star. is detected in the east lobe, only in the region where the scattered continuum (and feature B) is observed. The one-dimensional blue spectrum for this region is shown in Fig. 5, where the presence of He II 4685.55 Å (also reported by the first time in this work) and other high excitation (Fe?) lines, can be noticed.
Emission around 5007 Å was detected previously with a low signal-to-noise ratio and attributed to a blend of Fe II and O III lines (Schmidt and Cohen, 1981; Kelly, Latter, and Rieke, 1992). We have also detected the O III4959 line in our deep spectra with a total flux 1/3 of the O III5007 (Table 1) as theoretically expected regardless of the nebular conditions. Accordingly, the flux measured at 5007Å must be mostly due to the O III5007Å line.
We have compared the absolute fluxes measured in the present work with the fluxes measured by Kelly, Latter, and Rieke (1992). For most of the lines we find good agreement, our fluxes being on average 2.2 and 1.6 (for the east and west lobes, respectively) times smaller than those measured by Kelly et al., as expected from the different slit widths used in both observations (they use a 25-wide slit, covering the nebula almost totally in the equatorial direction and totally along the axis). There is however a remarkable difference in our fluxes for the O III4959,5007Å and O I6300,6363Å lines and those measured by Kelly et al. For the [O III] transitions, these authors found a total flux for the east (west) lobe a factor 0.8 (1) smaller than ours, without correcting the different slit width. Considering that our slit is a factor 2.5 smaller than theirs and the size of the nebula (25-3″ in the direction perpendicular to the slit), then we must conclude that the intensity of the O III lines is now a factor 2-3 larger than 9 years ago. Trammell, Dinerstein, and Goodrich (1993) also found upper limits for the flux of the [O III] lines that are also much smaller than our measurements in spite of their broader slit (2″). We also derive a [O III]/H line ratio (less dependent on the slit width) a factor 2 larger than that obtained by Kelly et al. in agreement with a recent increase of the [O III] intensity.
For the [O I] transitions, Kelly et al. measure fluxes a factor 3.5 and 2 (for the east and west lobe) larger than ours. Correcting by the different slit width, the intensity of the O I lines has decreased by a factor 0.6 and 0.8 since 1990. The values of the [O I]/H line ratio measured in previous works, summarized in Table 2 and Fig. 6, confirm the progressive weakening with time of the [O I] transitions.
4.3 Continuum
A relatively weak continuum is clearly visible in the blue (R900V) long-slit spectra along the nebular axis around offset 3″ (on the bright east lobe, see Fig.5, top). This position corresponds to the relative maximum in the continuum brightness distribution seen in the direct image (Fig. 1). We also detect continuum emission at the same position in the red spectra (R1200Y) for slits N93 and S93, and also, at the spatial origin for slit PA3, but with smaller signal-to-noise ratio. The red continuum is only visible in substantially smoothed spectra (not shown here). The average surface brightness of the red (blue) continuum, measured from our long-slit spectra in a 1″1″ region around offset 3″ is 810-17 ( 510-17) erg s-1 cm-2 Å-1 arcsec-2. The continuum brightness has been measured in a spectral window of 80 Å in the vicinity of H and H, respectively. The intensity and spatial distribution of the continuum obtained from our long-slit spectra are consistent with the continuum image (Fig. 1).
Our measurements of the red continuum flux are in reasonably agreement with previous estimates by Kelly, Latter, and Rieke (1992). Nevertheless, the continuum at blue wavelengths in our spectra is only a factor 1/1.6 weaker than the red, whereas from the data given by the previous authors we measure a blue-to-red continuum ratio of 1/2.4. Note that although the absolute flux calibration can be uncertain up to a factor 50%, the relative flux value is more accurate. This difference is consistent with a blue brightening of a factor 1.5 ( 0.44 mag) in the last 10 years (assuming that the red continuum flux has not varied). Gottlieb and Liller (1976) reported an increase of 2 mag in -band, from measurements between 1922 and 1975. These authors derived a -band brightening rate of 0.06 mag/yr, which is roughly consistent with our results. These authors attributed the increase of the blue continuum flux to the expansion of the circumstellar envelope of CRL 618 and the subsequent decrease of the extinction.
5 Spectral components as tracers of different nebular regions
5.1 Scattered and local emission components
We find remarkable differences between the long-slit profiles of the recombination and forbidden emission lines in CRL 618. Figs. 2 and 4 clearly show the presence of three ‘extra’ emission features (A, B, and C) in the H spectrum compared to the profile of most forbidden lines. Some of these features are also present in certain forbidden lines (§ 4.1). Here we analyze the origin of these features.
Feature A, the intense H emission observed close to the nebular center in slits N93 and S93, arises in the inner region A’ (Fig. 1). This region is very bright in the H image but much weaker in the light of [O I] and [S II] (Trammell, 2000). This behavior is consistent with the absence of feature A in our spectra for these forbidden transitions. For slit S93, feature A is blue-shifted with respect to by 10 km s-1. The counterpart to this feature observed in other recombination and forbidden lines is also blue-shifted: for [N II]6584 Å, feature a is blue-shifted by 25 and 33 km s-1 at position N93 and S93, respectively; for H, [O III]5007 Å, and [S III] 6312 Å, observed only at position N93, the blue-shift is 8-12 km s-1. The measured Doppler blue-shift suggests that feature A is locally produced within the east lobe, which is approaching towards us. For slit N93, feature A lies at , showing no apparent shift towards the blue. We believe that in this case the spectral position of the H feature A could be altered (slightly red-shifted) because of the presence of feature B at almost the same spatial position, which is relatively intense and is clearly red-shifted in the east lobe. The blue-shift of feature A could also be intrinsically smaller for position N93 than for S93, as suggested by the smaller blue velocities of its counterpart (feature a) in the other lines.
Features B and C are most likely the scattered component of the emission in the Balmer lines for this source (§ 1). Previous spectropolarimetric observations indicate that 40% of the total H flux is polarized (with a line polarization of about 15%; Trammell, Dinerstein, and Goodrich, 1993), i.e. it is light scattered by nebular dust. The polarization of the forbidden lines is, however, much lower and this would explain the absence of these features in these cases. Features B and C are red-shifted, although they originate in the approaching lobe (note that the forbidden line emission from the east lobe is blue-shifted), which clearly points to their scattered nature: the light scattered by dust moving away from the central source should be red-shifted for both the approaching and receding lobe (see e.g. Schwarz et al., 1997). Carsenty and Solf (1982) also found some red-shifted H emission (probably our feature B) arising in the approaching bright lobe which they attribute to scattered emission following the same argument.
The previous interpretation is consistent with the similar brightness distribution of these features and the continuum (Figs. 1 and 2), as expected if they share the same scattered nature. Feature B is clearly most prominent in the region of maximum continuum emission for all the slits positions. Moreover, features B and C are much more intense for the east lobe than for the west one, where the scattered continuum is much weaker and the fraction of polarized light smaller (0.5 versus 0.2, for the east and west lobe respectively; Schmidt and Cohen, 1981).
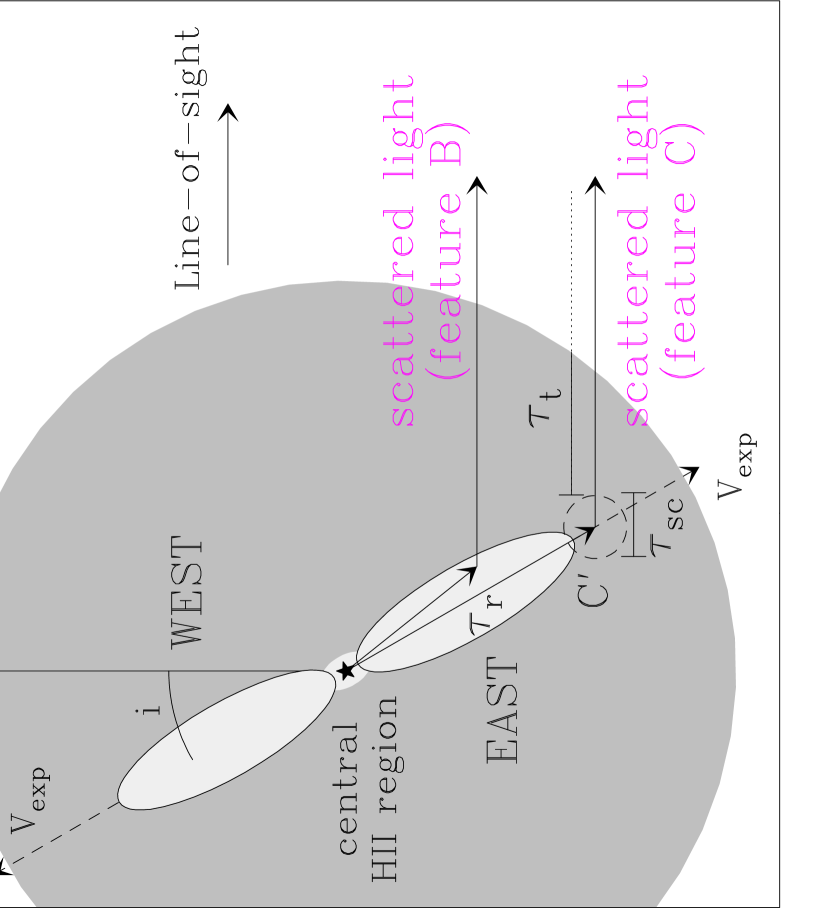
The different profiles and spatial distributions of features B and C in our long-slit spectra suggests that they are produced by dust in different nebular regions. The low red-shift of feature C ( 6-8 km s-1) and its location (beyond the forbidden-line emitting east lobe, in the weak H halo) points to dust not located inside the lobe but beyond it, in the unshocked, slowly expanding AGB CSE. Since the AGB CSE surrounds the lobes, we can expect feature C to be present (with more or less intensity) all along the slits. This is consistent with the presence of the diffuse halo surrounding the lobes in the H images, and not only in front of them (see below). The tentative feature “C?”, observed at the tip of the west lobe, could be the counterpart to feature C in the receding lobe.
The much larger red-shift of feature B (up to LSR velocities of 240 km s-1) and its location (within the lobes) is more consistent with dust inside the shocked-lobes which is flowing outwards rapidly (presumably at the same speed as the gas). We identify this feature with the red-shifted H emission detected by Carsenty and Solf (1982) in the east lobe, which they also attribute to scattered emission produced by fast outflowing dust. At the position where feature B is observed, some contribution by feature C is also expected (see above), however, the spectral resolution achieved in these observations is not sufficient to separate both features.
The line emission that is being reflected by the dust, visible as the halo (in the direct images) and as features B and C (in our long-slit spectra), is unlikely to originate in the shocked-lobes themselves. In fact, neither the halo, nor features B and C are detected in most forbidden lines, and in particular, in the [O I] line. However, the [O I] and H emission locally produced in the east lobe have comparable intensities (Fig. 4 and images in Trammell 2000), which should result in almost equally bright scattered components for both lines if the reflected photons were originally produced in the lobes. Features B and C must then result from the reflection of light produced in the nebular center (in the central H II region or/and in region A’), where the emission of most forbidden lines observed by us is intrinsically much less intense.
5.2 The different nebular regions
The presence or absence of the different spectral features and, in general, the profiles of the different lines are diagnostic of the physical properties (such as temperature, ionization, and electron density) of different nebular regions in CRL 618, from the highly obscured H II region to the shocked lobes.
5.2.1 The inner H II region
This region is indirectly probed by lines with B- or C-like features (scattered light), namely H, H, [O III], He I, He II, [Fe III], [S III], and the WR-bump. The spectrum of the central H II region is thus most easily seen in the region where the scattered continuum is observed, at offset 3″ in the east lobe. The central H II region (previously studied through its radio-continuum emission, see § 1) is characterized by high densities ( 106 cm-3) and high temperatures (13,000-15,000 K) that provide the required conditions to produce most of the (high-excitation) lines above (e.g., the ionization potential of the [Fe III], [S III], He II, and WR-bump are 16.16, 23.33, 24.59 and 30 eV, respectively). The large critical densities for the observed [Fe III] and [S III] transitions, 10 cm-3, explain why these forbidden lines are not de-excited by collisions in the central region of CRL 618. We note also, that the relatively large critical density of the [O III]5007 transition, few105 cm-3, would explain the weak [O III]5007 emission from the inner H II region, which is indirectly observed at the position of maximal continuum and feature B. Unfortunately spectropolarimetry of the lines listed above presumably arising from the H II region has not been obtained previously, so we do not know their polarization degree (nor the fraction of scattered flux) and we cannot test the previous scenario. In any case it seems that these high excitation lines are unlikely to be produced in the shocked lobes, where the spectrum is dominated by low excitation lines.
5.2.2 Region A’
This region is also very likely a relatively dense region, considering that only forbidden lines with high critical densities ( few 104 cm-3) are observed therein, namely: [N II], [S III], [O III], and [Fe III]. The spectrum of this region (the innermost part of the east lobe, where features A and a are observed) is remarkably different from that of the shocked lobes but very similar to that of the central H II region. In fact, most lines are common to both regions except for the absence of the WR-bump (which requires higher excitation conditions) in region A’ and the undetected [N II] emission (with a low critical density, 2104 cm-3) from the denser H II region. This fact suggests that region A’ is more likely to be ionized by the UV stellar radiation rather than by shocks. In this sense, region A’ represents the outermost (less dense) parts of the H II region surrounding the star. The observed relative line intensities are not consistent with any of the different shock-excitation models by Hartigan, Raymond, and Hartmann (1987) (hereafter HRH87).
The very weak emission of the [O I] lines from region A’ ([O I]/H 0.05) implies that this region is fully ionized (e.g. Hartigan, Morse, & Raymond, 1994). The observed [O I] transitions have relatively high critical densities ( 2106 cm-3) and, therefore, significant collisional de-excitation of the involved levels is not expected. Therefore, the weakness of the [O I] transitions is because most oxygen in region A’ is ionized. Considering the similar ionization potentials of oxygen and hydrogen, we conclude that the ionization fraction (X=) of region A’, like that of the inner H II region (where [O I] is not detected) is 1.
5.2.3 The shocked lobes
This region is probed by lines without any additional features (A, B, or C). The most intense of these lines ([O I], [S II], and [N I]) are known to originate entirely from the gas in the lobes since for these lines, no polarization has been measured (Trammell, Dinerstein, and Goodrich, 1993) and no red-shifted components are found in the approaching lobe. Although no polarimetry of the rest of the lines within this class has been made, we conclude that they must have a similar origin given their similar profiles.
The relative intensities of the lines observed at the lobes (dereddened using the average extinction for each lobe, see §8 below) are consistent with shock-excited emission. In particular, the flux ratios observed by us lie in between the predicted values for bow-shock excitation models 8 and 9 by HRH87 with shock velocities between 50 and 100 km s-1 and preshock density 300 cm-3. These range of velocities for the shocks is mainly constrained by the detected, although weak, [O III]5007 Å emission and implies shock speeds slighly larger (but still comparable) to previous estimates following similar procedures (=20-80 km s-1; Riera, Phillips, & Mampaso, 1990; Trammell, Dinerstein, and Goodrich, 1993). The higher shock velocity derived by us is basically due to the higher [O III] flux obtained in our observations.
[N II] and [Fe II] lines show the largest intensity contrast between the tips and the innermost regions of the lobes amongst forbidden transitions. [Fe II] lines are known to be good tracers of astrophysical shocks (in supernovae, Herbig Haro objects, PNe, etc): [Fe II] lines are very sensitive to the high densities and temperatures in the shocked gas; moreover, fast shocks are able to extract substantial amounts of Fe from dust grains (e.g. Welch et al., 1999; Reipurth et al., 2000). Therefore, the intensity enhancement of the [Fe II] (and [N II]) lines is very likely related to the presence of intense shocks in these regions. In addition, the strongest [Fe II] line emission is expected in regions where the compression and heating of the gas is largest, for example, at the head of a bow shock, where the velocity component normal to the shock is greatest. The presence of bow-shocks at the tips of the lobes of CRL 618, where the maximum [Fe II] emission is observed, is suggested by bright, curved features in the direct images of the nebula (Fig. 1). Finally, the presence of intense [Fe II] lines in the shock-heated and compressed gas in the lobes of CRL 618 points to dissociative (30 km s-1) J-shocks rather than C-shocks (Reipurth et al., 2000), consistent with the relatively large shock velocity derived from diagnostic line ratios and the kinematics of the lobes (see Sect. 7).
The ionization fraction in the shocked lobes is significantly lower than in region A’ as suggested by the much larger [O I]6300/H ratio, 0.5-0.9 (excluding scattered light), in the former. We discuss in detail the ionization in the lobes in Sect. 9.2.
5.2.4 The scattered-light halo
A diffuse halo surrounding the bright optical lobes of CRL 618 is visible in the H direct images of the nebula (Figs. 1b,c). The scattered feature C in the H spectra arises in this halo, and it is particularly noticeable in the region just beyond the tip of the east lobe. Accordingly, the H emission from this halo is very likely light (originally arising in the H II region) that escapes preferentially in the direction of the lobes and is scattered by the innermost parts of the AGB CSE. (The more distant regions of the AGB CSE are visible in molecular line emission, § 1.)
6 The inclination of the nebula
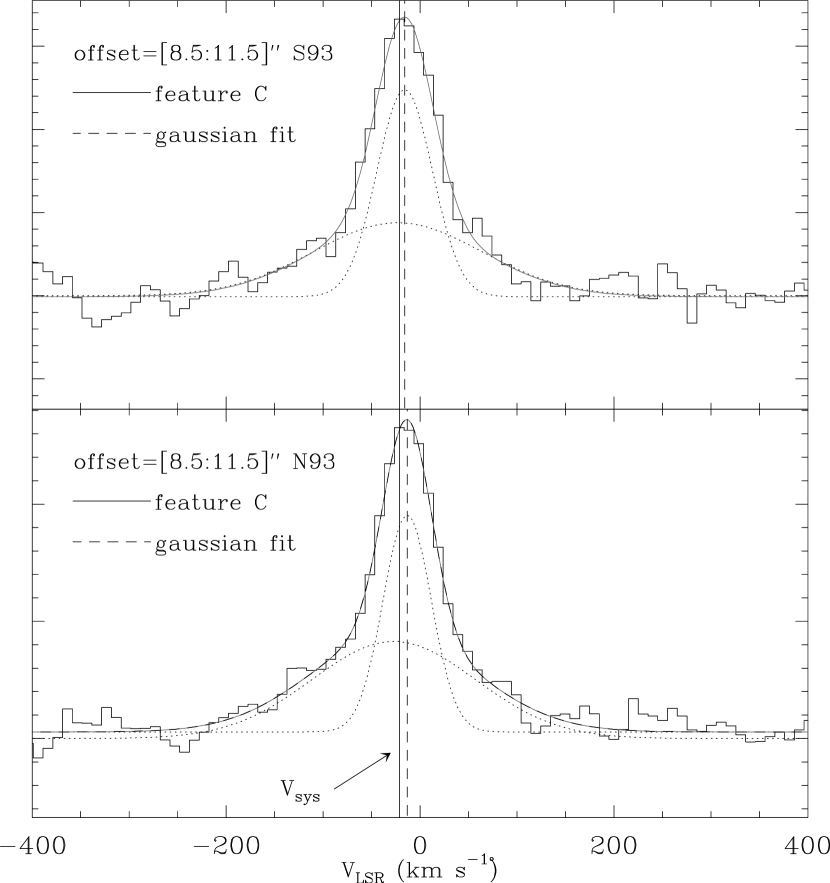
The presence of scattered features (C and B) in the H spectrum of CRL 618 offers a valuable opportunity to derive the inclination of the nebula: by comparison of the red-shift of the scattered emission with the intrinsic velocity of the dust (whenever these quantities can be determined). Features B and C are produced, respectively, by: (i) fast-moving dust mixed with the atomic gas inside or in the walls of the lobes; and (ii) dust beyond the lobes, in the slowly expanding, extended envelope which surrounds the optical lobes (see § 5.1 and Fig. 7). The limited spectral resolution in our spectra does not allow us to separately measure the red-shift of features B and C when both components are simultaneously present (all along the east lobe up to offsets 8 ″). However, at the tip of the east lobe, only feature C is observed in the H spectra, and the red-shift of this feature can be accurately determined. By comparison of this red-shift with the intrinsic expansion velocity of the dust in the AGB CSE producing feature C, 17.5 km s-1 LSR (§ 1), we can readily derive the nebular inclination.
The red-shift of feature C is apparent in Fig. 8 (left), where we show its spectral profile derived from slits N93 and S93 integrating the long-slit spectra from offsets 85 to 115. The red-shift of feature C for both slit positions has been obtained by fitting a Gaussian function to the core of the feature, which is roughly symmetric. For N93 and S93, the red-shift with respect to (given by the Gaussian center) is 81.5 and 61.5 km s-1 respectively. These values yield an inclination (with respect to the plane of the sky) of 27°6° (from slit N93) and 20°5° (from slit S93) for the dust reflecting the H photons ahead of the east lobe.
As we have shown, feature C beyond the east lobe has its counterpart in the weak halo seen in the H images of the nebula at the same position (Fig. 1). The orientation of this halo and the pure emission lobe in the plane of the sky is roughly the same. This is most likely due to light from the core escaping preferentially along the lobes of CRL 618. Hence we can expect the previous values of the inclination to be a relatively good representation of the mean nebular inclination (for an overall axial symmetry).
The different inclinations (=7°) derived for feature C in slits S93 and N93 could indicate different orientations of the different lobe components along the line-of-sight, a likely possibility given their different orientations in the plane of the sky (PA 15°).
We can also derive by measuring the velocity of feature B () with respect to the local emission component (, obtained from the forbidden lines) at the same position. =- is a direct measurement of the intrinsic expansion velocity of the lobes, therefore =sin. From our spectra, we can derive only a lower limit to the red-shift of feature B because the H profile has also important contributions from features A and C at the position where feature B is observed (offset 3″). This leads to a combined H profile with a smaller red-shift than that of feature B alone and, therefore, only a lower limit to the intrinsic expansion velocity of the lobes. The lower limit for translates into an upper limit for .
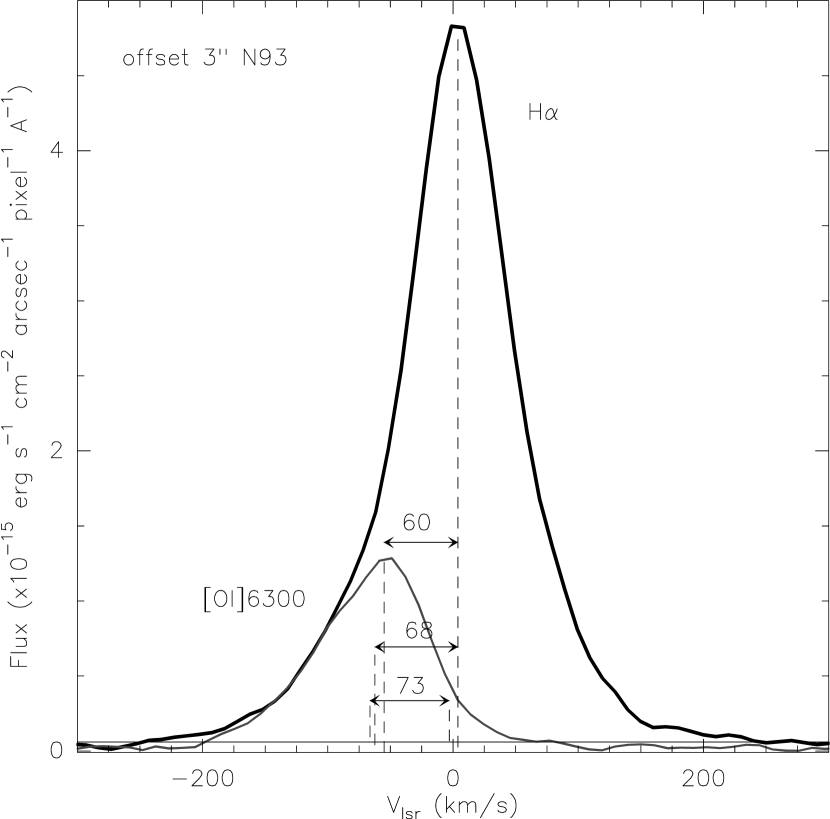
In the right panel of Fig. 8, we show H and [O I]6300 Å 1D-spectra at the position where the scattered continuum and feature B reach maximum intensity in the east lobe for slit N93. The velocities of the H and [O I] lines measured (with uncertainties of 1.5 km s-1) at the peak are =5 km s-1, =55 km s-1, which yields 60 km s-1 (at this position) and 34°. If, instead of using the line peaks for the velocity measurements, we use the centroids of the full width at half maximum (=5 km s-1, =63 km s-1, 68 km s-1), or the centroids of the full width at a 3 level (=6 km s-1, =67 km s-1, 73 km s-1), we get values of ° and °, respectively.
The mean value of, and upper limit to, the inclination derived above are smaller than the inclination previously obtained by Carsenty and Solf (1982) (hereafter CS82). These authors obtain =45°, based on the analysis of the H scattered component produced by the fast dust within the lobes. We believe this difference can be due to several reasons:
First, the value given by CS82 for the intrinsic speed of the outflow, 80 km s-1 is really a lower limit to because of the presence of multiple components in the H profile (as explained above). Second, the value for the radial velocity difference between the east and west lobes (which is equal to 2sin ) measured by CS82 from the forbidden line emission (e.g. [N II]6548,6583, [S II]6716,6731), 114 km s-1, is most likely an overestimate. This is because the radial velocity difference between the lobes is not constant along their length (see Figs. 2 and 4 and Table 3). In particular, the 114 km s-1 velocity difference occurs only at the tips of the lobes (at offsets 6″). But in the region where the most intense H scattered emission is observed (offset 3″), coincident with the position where CS82 measure the red-shift of the H scattered component, we observe a smaller radial velocity difference, 90 km s-1. Thus, if we use a larger value of the outflow speed (80 km s-1) and a smaller radial velocity difference ( 90 km s-1) in the CS82 method, we get an upper limit to the inclination of 34 °, which is consistent with our previous estimates.
Finally, a low mean value of the inclination is in better agreement with the similar average extinction deduced for the east and west lobe (see § 8).
7 Kinematics
7.1 The shocked lobes
In order to study the kinematics in the lobes of CRL 618 we have chosen the most intense forbidden lines, which originate in the lobes and have profiles uncontaminated by scattered light components. Since the [N II] lines have also some contribution from reflected light (Trammell, Dinerstein, and Goodrich, 1993, found that the polarization of these lines is 6%), we have based most of our analysis on the intense, unpolarized [O I] and [S II] lines.
The [O I] and [S II] profiles along the slit N93 for the west and east lobe are approximately point-symmetric with respect to the spatial origin and systemic velocity (Fig. 2), suggesting that they have probably a similar kinematical structure. This result is not in principle expected from the different morphology of the east and west lobes. The projected radial velocity gradient is not constant in either lobe. In the innermost parts of the lobes the projected velocity decreases with the distance from the nebular center, this behavior being more pronounced in the east lobe (Table 3). In the outer parts of the lobes, the velocity increases with the distance, reaching projected velocities (with respect to ) up to 70 and 80 km s-1 at the tip of the east and west lobe, respectively. In these regions, the emission arises in the compact, bow-shaped emitting knots at 6″. Considering the low inclination for the nebula derived in § 6, 24°, the lobes of CRL 618 are expanding with velocities up to 200 km s-1 (at the tips). The changing radial velocity gradient observed in our low angular-resolution (ground-based) spectra may result from superposition of multiple kinematical components as suggested by the complex morphology and small scale (02) structure seen in the images. Of course it is also possible that there are acceleration and deceleration processes operating in the lobes.
The FWHM of the forbidden lines along the lobes also increases outwards, from 60–75 km s-1 closer to the nebula center, to 150 km s-1 at the lobe tips (Table 3). The large line widths measured at the tips of the lobes (Fig. 9) are consistent with the bow-shaped features being regions accelerated by bow-shocks: the different orientations of the velocity vectors in a bow-shock structure produce a large velocity dispersion (see e.g. HRH87). The total width (at zero intensity level) of the line does not strongly vary along the lobes but rather is fairly constant with a mean value of 200 km s-1.
The spectral profile of any low-excitation emission line from a bow-shock can be used to estimate the shock velocity, . The shock velocity equals the full width (at zero intensity) of the line for radiating bow-shocks, independent of orientation angle, pre-shock density, bow-shock shape, and pre-shock ionization stage (HRH87). We derive =200-230 km s-1 for the bow-shocks seen at the tips of the east and west lobes. This value agrees well with the value of inferred directly from the projected velocities of these regions assuming an inclination of 24°. This result therefore supports the low inclination of the nebula we have derived (§ 6). In addition, the centrally-peaked profiles in Fig. 9 are consistent with the predictions for bow-shock models by HRH87 with 25° (for larger inclinations the model profiles show two well separated peaks).
The shock velocity derived from the observed line ratios and their comparison with predictions of bow-shock excitation models by HRH87 ( 90 km s-1, § 5.2.3) is smaller than that directly derived from the line profile. Similar differences are also present for many Herbig-Haro objects observed and modeled by these authors suggesting that the existing models (necessarily simplistic) cannot accurately reproduce the complex excitation and spatio-kinematical structure of the shocked material. Moreover, the preshock density in the HRH87 models, 300 cm-3, is very likely lower than the actual value (see § 10). The shock velocity obtained from the line profile is probably less affected by errors in the model, since it arises only from geometrical considerations, and may better represent the actual velocity of the shock. Only if the line emission from the shocked post-AGB wind itself (which is moving faster than the forward shocks) was significant compared to that from the shocked AGB ambient material (unlikely to be the case in CRL 618; C-F. Lee and Sahai, in preparation), then the line FWZI would be an upper limit to . derived from the line ratios depends on poorly known parameters like, e.g., the presence and strength of magnetic fields. Models with higher magnetic fields require substantially larger shock velocities to reproduce the same line ratios (Hartigan, Morse, & Raymond, 1994). For example, for a pre-shock density 105 cm-3 (§ 10), magnetic fields of 30G are required to reproduce the dereddened [N II]6583/[O I] 6300 ratio ( 0.5, see Table 1 and § 8) for a planar shock with speed = 90 km s-1. To produce the same ratio when = 200 km s-1, the required magnetic field is much larger (3000G).
Finally, from a comparison of the spectra obtained for slits N93, S93, and PA3, we infer some differences in the kinematics of the different lobe components (note that each lobe of CRL 618 consists of at least two well separated features, Fig. 2). For example, the south sub-component of the east lobe (better probed by slit S93) is expanding 5-20 km s-1 faster than the north one. Similarly, the northern sub-feature of the west lobe (better seen in slit N93) is 5–20 km s-1 faster than the southern. These differences could be due to different absolute ejection velocities or inclinations of the lobe components. We note also that, in general, N93 and S93 provide similar FWHM for the west lobe but for the east lobe, the largest FWHM are measured from slit S93, where the line FWHM reaches up to 180 km s-1. The larger widths in the southeast lobe sub-component are unlikely to be related to projection effects and must be due to intrinsic differences in the kinematics.
7.2 Region A’ and the inner H II region
From the analysis of the H profile we can also obtain valuable information on the kinematics in regions of the CRL 618 nebula other than the shocked lobes. The presence of the blue-shifted, intense H emission component in the east lobe close to the nebula center (feature A, Fig. 2) indicate ionized gas moving away at moderate velocity (15-30 km s-1) from the central star. We have measured the velocity of this feature from the [N II] lines, which are less contaminated by scattered light (note that the blue-shift of feature A in the H spectra is masked by superposition with the intense, red-shifted feature B and, probably also, C).
The kinematics of the H II region cannot be so straightforwardly obtained from our data, since the emission from this region is seen only after being reflected by the dust (through features B and C) and therefore the resulting line profile is affected by the distribution and kinematics of the dust. The FWHM of feature C, observed at the tip of the lobes (Fig. 8), and deconvolved with the spectral resolution of our data is 60 km s-1, suggesting an expansion velocity for the gas in the H II region of 30 km s-1. This figure has to be considered as an upper limit, since the reflecting dust could show a range of inclinations resulting from the opening angle of the lobes (up to 15 ° according to the lobe aperture in the plane of the sky). Our result is consistent with the low expansion velocity of the H II region measured from the profile of H radio recombination lines (20 km s-1; Martín-Pintado et al., 1988). The weak wings of feature B in the H and H lines extend up to LSR velocity 240 km s-1 (at a level of 5). Such extended red-wings are most likely the result of the large velocities of the reflecting grains within the lobe (up to 200 km s-1) and also partially to the lobe opening angle, however, the presence of rapidly outflowing material in the H II region cannot be ruled out.
8 Extinction
We have estimated the relative variation of the extinction along the lobes of CRL 618 by comparing the H and H spatial profiles along the axis (from slit position N93). The two long-slit spectra have been aligned in the direction of the slit using the west lobe brightest knot (at the tip of the lobe) as our spatial reference. We estimate that errors in the alignment are 1 pixel (02). The uncertainty in the positions of the slits used for obtaining the H and H spectra in the direction perpendicular to the slit is a few pixels and therefore, smaller than the seeing (16, § 2.2). The spatial distribution for both transitions and the adjacent continuum was obtained integrating our long-slit spectra in the spectral direction. In order to derive the Balmer decrement, the continuum emission was first subtracted from the H spatial profile but not from the much brighter H emission (in this case, the continuum contribution is negligible, 1%).
The spatial distribution of the extinction derived from the H/H ratio is shown in Fig. 10 (top panel). In this figure, the optical depth at 4861.3 Å, , has been calculated assuming the Galactic reddening curve by Howarth (1983) and an intrinsic Balmer decrement of 3. This value of the Balmer decrement allows easy comparison of our results with previous estimates of the extinction, which usually assume H/H=3. Moreover, the previous value is expected for high-velocity shocks like those in CRL 618 (§ 7), for which the intrinsic Balmer ratio approaches the recombination value (collisional excitation increases the intrinsic Balmer ratio only for low-velocity shocks, 70 km s-1; Hartigan, Morse, & Raymond, 1994). The conversion from to extinction in magnitudes in the band, =0.93, has been derived using the extinction law parametrization by Cardelli, Clayton, & Mathis (1989) and assuming the ratio of total-to-selective absorption, , equal to 3.1. The error-bars in Fig. 10 are statistical, and do not account for systematic errors (e.g. arising from an incorrect value of the intrinsic Balmer decrement, absolute flux calibration or small misalignments between the H and H spectra).
The H/H ratio clearly varies along the nebular axis (Fig. 10). This variation is most likely not due to a change of the intrinsic Balmer ratio, since we do not expect the shock characteristics (e.g. shock speed and pre-shock density) to vary sufficiently along the nebular axis. Neither the velocity of the shocks nor the electron density show systematic variations along the lobes (see § 7 and § 9). Accordingly, the observed variation of the H/H ratio must be related to extinction by nebular dust.
The nebular extinction varies along the axis of CRL 618 as follows: the maximum extinction is produced close to the nebular center and then gradually decreases towards the outermost parts of the lobes. The extinction in the innermost nebular regions is particularly uncertain and is very likely underestimated by a large factor. In fact, from the images we can see that the emission from the 2″-region around the nebular center is well below the noise, suggesting a very high obscuration there (see Fig. 1). We deduce that the extinction towards the central star of CRL 618 is 10 magnitudes, given the upper limit to the stellar continuum level estimated from the R1200Y spectra, 2.5 10-16erg s-1 cm-2 Å-1, and the expected flux from a 30,000 K black body, 2.5 10-12erg s-1 cm-2 Å-1. Our low-resolution, ground-based H and H spectra, used to calculate the extinction, show some weak emission from the innermost nebular region. However, this is a result of the poor spatial resolution in these spectra, which spreads out some light from nearby nebular regions in the lobes (where the extinction is smaller) into the nebular center (with, very likely, much larger extinction). The result is an underestimate of the extinction in these inner regions as deduced from the observed Balmer decrement.
Beyond the central region, the extinction decreases with the distance from the nebular center reaching a relative minimum around offsets 65. At offsets larger than 7″ (beyond the tips of the lobes) the extinction increases again.
We note that the extinction curve along the nebula is quite symmetric, i.e. the extinction is similar for the east and west lobe: the weak west lobe appears on average only about 15% more extinguished than the bright east lobe. The difference is even smaller at the tip of the lobes. This result indicates that the lower H surface brightness for the west lobe compared to the east (by a factor 5) is intrinsic and not due (at least totally) to a much larger extinction of the receding lobe. In fact, most of the H emission from the east lobe arises from region A’, which does not have a counterpart in the west lobe. The similar extinction for the east and west lobe is consistent with the similar brightness of both lobes for most forbidden lines (e.g. [O I], [S II], etc), for which the east lobe is only a factor 1.5 brighter than the west lobe. Finally, the similar extinctions derived for the east and west lobe suggest a low inclination of the nebular axis with respect to the plane of the sky (assuming that most of the extinction is produced by the AGB CSE surrounding the lobes, § 1), consistent with the value we derive from the analysis of the scattered H emission (24°, § 6).
Our results on the extinction in CRL 618 are in good agreement with previous estimates using the Balmer decrement method: Kelly, Latter, and Rieke (1992) derive an average extinction in the nebula of =4.50.2, which is within the nebular extinction range derived by us (Fig. 10). From the analysis of [S II]6716,6731 and [S II]4069,4076 lines, these authors also found that both the east and west lobe have similar extinction values, =2.10.2 mag and =2.90.3 mag, respectively.
8.1 Effect of the scattering on : radial extinction beyond the lobes
The estimate of the absolute extinction along the line of sight from the Balmer decrement in an object like CRL 618 is problematic mainly because of the contribution of scattered light to the total flux of the H I recombination lines, as already noticed by, e.g., Trammell, Dinerstein, and Goodrich (1993); Kelly, Latter, and Rieke (1992). The effects of such contribution on the value of the observed H/H ratio are difficult to quantify: on the one hand, the scattering will produce an ‘artificial’ decrease of the observed H/H ratio due to the highest reflection efficiency for blue photons; on the other hand, the extinction of the light from the innermost regions, where it originates, to the regions where it is scattered by the dust (radial extinction) will produce reddening which may or may not compensate the previous artificial increase of the H/H ratio.
The presence of nebular dust is expected to affect not only the absolute value of the extinction but also its relative variation from one region to another in the nebula. In regions where both local and scattered H and H emission are present, the optical depth derived from the Balmer decrement, , is not only the line-of-sight or tangential optical thickness, (from the lobes to the observer), as desired, but a complex function of , the radial optical depth, (from the star up to the lobes where the light is being reflected), and the relative intensity of the Balmer emission locally produced within the lobes and in the inner H II region. All these quantities will vary along the nebula in a different way and they will combine to yield the extinction profile in Fig. 10.
At the tip of the CRL 618 east lobe (and tentatively in the tip of the west lobe) only H emission from feature C (and “C?”) is observed, i.e. the Balmer emission is dominated by the scattered component (Fig. 4). In a region like this, where the local emission is negligible with respect to the scattered component, only depends on and in a relatively simple way:
| (1) |
where is the scattering optical thickness of the small region at the tip of the east lobe that produces feature C (region C’; see Fig. 7) and the optical depths and include both scattering and absorption. This equation is valid if the scattering and aborption optical depths in region C’ are small ( 1), as expected beyond the tips of the lobes. In this case, is mostly due to foreground dust (not directly illuminated by the central source) between region C’ and the Earth. Using this equation, we analyze the spatial variation of the extinction in Fig. 10 to study the structure of the lobes. At the tips of, and beyond, the lobes (offsets 7″), the extinction increases with the distance from the nebular center (Fig. 10). This increase, which is not expected a priori given the progressive decrease of with distance for inner regions, can be explained if in this region, i.e., if the radial extinction is larger than the tangential component. In fact, the tangential optical depth will decrease (not increase) with the distance from the central star in the plane of the sky, , for any reasonable density law for the outer circumstellar envelope (e.g. for a density law ). However, the radial extinction is expected to increase with , as observed, for any reasonable density law within the lobes.
We have computed the radial extinction as a function of the observed spatial offset, = , for two different density laws within the lobes of CRL 618: (i) , which leads to ; and (ii) , which yields . The increasing extinction beyond offset +7″, can be reproduced for both laws (note that, in fact, for , the radial extinction in case i can be approximated by a straight line, which corresponds to case ii) but always requires values of 7″. (We will not discuss case ii further because best represents the density in most AGB circumstellar envelopes.) A small (7″) results in the extinction reaching a constant value () very quickly (Fig. 10), which is inconsistent with the data.
The large obtained implies that there is a substantial component of the radial extinction which is produced by dust outside of the lobes (i.e., in the AGB CSE). We can only set an upper limit to the component of the radial extinction produced by dust inside the lobes (presumably filled by the post-AGB wind), based on the minimum value of (about 2) obtained at the tips of the lobes (offsets of 65″). Both the above components (referred to as and ) and their sum are shown in Fig.10.
8.2 The density contrast between the AGB and post-AGB wind
Assuming that the gas filling the lobes is the post-AGB (pAGB) wind, we now derive / by comparing and . For a stationary outflow the mass loss rate per solid angle is =, and the corresponding radial optical thickness is:
| (2) |
where is the distance from the star, is the inner radius, is the gas mass density, is the wind expansion velocity, and depends on the grain properties and the gas-to-dust mass ratio. Combining Eq. 2 and the expression for Ω above, we derive that:
| (3) |
From our fitting to the radial optical depths (§ 8.1), which gives for the AGB CSE inner radius, 75, and adopting for the post-AGB wind inner radius, 006 (from the circumstellar dust model by Knapp, Sandell, & Robson, 1993), we obtain:
| (4) |
where the lower limit arises from the upper limit to . The density ratio above depends on the poorly known inner radius of the post-AGB wind as well as on the unknown but expected differences in the dust-to-gas ratio and dust grain properties in the AGB CSE and in the fast post-AGB wind. Moreover, the intrinsic ratio is likely to be lower because the region beyond the lobe tips is overdense compared to the original, unshocked, AGB CSE (since it contains material swept-up by the post-AGB wind). The AGB-to-pAGB density ratio would also be significantly lower if the gas-to-dust ratio in the post-AGB wind was much higher than that in the AGB CSE, perhaps as a result of inefficient grain formation in the post-AGB wind emanating from the vicinity of a 30,000 K star.
Finally, as argued earlier, for offsets 7″ the radial and tangential optical depth cannot be separately quantified from . The smooth decrease of with distance from the central star may suggest that the derived extinction is dominated by the tangential component (as shown above, the radial component would increase or remain constant with the distance from the star). This is, in particular, most likely true for the west lobe, for which the fraction of scattered light in the H and H emission lines is small. The similarity between the extinction profile for the east and west lobe as well as the expected lower extinction derived for the east (approaching) lobe, again suggest that is probably dominated by the tangential component. However, the derived extinction, which may still be affected by the scattering, does not allow us to perform a detailed modelling of to study the outer AGB CSE.
9 Density and nebular mass
9.1 The electron density distribution
We have used the [S II]6716/6731 doublet ratio to estimate the electron density, , along the shocked lobes of CRL 618. The spatial profiles along the nebula axis (slit N93) for the two doublet lines and their ratio are plotted in Fig. 10 (middle panel). We only show the ratios wherever the line intensities are over 3. There are no alignment errors to contend with since the two lines of the doublet were observed simultaneously.
Within the observational errors, the [S II]6716/6731 ratio does not present a systematic variation along the east or west lobes, with a mean values of 0.55 and 0.50, respectively. The same average values are obtained for slit S93. Considering the [S II]6716/6731 ratio versus electron temperature and density contour plots by Cantó et al. (1980) and an average electron temperature = 10,000 K (§ 1), we derive densities for the east (west) lobe of [5-8]103 ( 8103-104) cm-3. These figures are close to the critical densities for the [S II]6716,6731 Å transitions, however, the good agreement between our results and previous estimates using different diagnostic lines (Kelly, Latter, and Rieke, 1992), suggest that collisional de-excitation of the [S II] lines is not critical, at least, for most regions in the lobes.
There are some non-systematic variations of the [S II] doublet ratio within the lobes which seem to be larger than their corresponding error-bars. These variations could suggest density inhomogeneities along the nebula (from 2,000 cm-3 to 2104 cm-3).
9.2 Atomic and ionized mass and ionization fraction
We have estimated the total mass of atomic and ionized gas, and , in the lobes of CRL 618 using the mean electron densities derived above and the total energy radiated by [O I](6300+6363) and H, respectively. The [O I] (H) intensity is proportional to the product of the electron density and the H (H+) number density, assuming that the transitions are optically thin and that the electron temperature does not strongly vary within the emitting region (Gurzadyan, 1997; Osterbrock, 1989). Considering a mean electron temperature in the shocked lobes of 10,000 K, relative abundances of He/H = 0.1 and O/H= 3.310-4 (appropriate for a C-rich star like CRL 618, Lambert et al., 1986), and the required atomic parameters (see e.g. Mendoza, 1983; Gurzadyan, 1997) we derive:
| (5) |
| (6) |
where is the dereddened luminosity of the line and the distance to the source. Note that Eq. (5) is valid for electron densities smaller than the critical density of [O I], cm-3, which is the case for CRL 618. On the other hand, this equation only provides a lower limit of the total atomic mass (, which includes the He contribution), since we are assuming that most of the oxygen is neutral and in the ground state. In deriving Eq. (6) we have assumed the classic radiative recombination case b for 10,000 K (i.e. z3=/=0.2510-20 cm3, where is the population of the level of H; Gurzadyan, 1997).
We have separately estimated the masses of the east and west lobes using Eqs. (5) and (6). For the east (west) lobe we have used an average electron density of 6.5103 cm-3 (9103 cm-3), an average extinction of mag ( mag), and the fluxes in Table 1 multiplied by: (i) a factor 2.5, which converts the flux within a 1″-wide slit to total nebular flux (estimated from the direct and ground-based images, Fig.1); and (ii) a factor 0.5 and 0.8, for the east and west lobe respectively, that is the fraction of the total H luminosity locally produced in the lobes (not scattered emission, see § 5.1 and Schmidt and Cohen, 1981). We note that point (ii) applies only to the H luminosity and not to [O I] emission since the latter is not contaminated by scattered light. The masses derived for a distance to the source of 900 pc are given in Table 4. In this table for the east lobe is the mass of ionized shocked gas plus the mass of ionized gas in region A’ (Fig. 1), since the latter contributes significantly to the total H luminosity. In contrast, only accounts for the mass of atomic shocked gas, since region A’ is not detected in our [O I] long-slit spectra.
We have estimated the mass of ionized gas in region A’ from its H flux, which is 20% of the total flux (scattered + local emission) of the east lobe. The electron density and extinction in this region is 105 cm-3 and 6, respectively (Sects. 5.2 and 8). Using Eq. (6) we derive 410-5 . The ionized mass in a spherical volume of gas with radius 05, 105 cm-3, and ionization fraction 1 (reasonable values for region A’) is 10-4 , also in agreement with our previous estimate.
Subtracting the ionized mass of region A’ from the total mass of the east lobe in Table 4 (column 2), the mass of ionized, shocked gas is (3-9)10-5 . Also, for an east lobe-to-west lobe ionized mass ratio similar to the corresponding atomic mass ratio, which is 1.9 (col. 1 in Table 4), for the east lobe would be 410-5 , within the previous mass range. Note that a similar ionization fraction for the east and west lobe is suggested by the similar [O I]/H ratio in both lobes (without including the scattered component).
We have also estimated the mass of ionized material in CRL 618 geometrically, using the mean electron densities and the volume of the shocked lobes directly measured from the images, assuming a cylindrical geometry for the lobe components. We have separately considered the case of hollow lobes (with 01-thick walls) and lobes uniformly filled with gas. Assuming that the majority of the electrons in the nebula come from H+, i.e. , the ionized mass of the west and east lobe (excluding region A’) for hollow (full) cylinders is 3.510-5 (1.1 ) and 4.210-5 (1.3 ) respectively. These values are consistent with those previously obtained from the H luminosity. The hollow-cylinder geometry is a better approximation to the structure of the lobes of CRL 618 than the filled-cylinder geometry: for the latter, the derived masses systematically exceed those obtained from the H luminosity (Table 4).
The high intensity of the [O I] lines relative to H and, in general, the observed ratios for the rest of the lines suggest a low ionization fraction, X=/ 0.03-0.1, in the lobes, by comparison with the predictions of planar shock models by Hartigan, Morse, & Raymond (1994). These values are also consistent with the upper limits to X derived from the ionized and atomic masses calculated above (X1.4), X0.8 and X0.6 for the west and east lobe, respectively. An ionization fraction of only a few percent seems to be inconsistent with the high velocity of the shocks in CRL 618 ( 200 km s-1) deduced from the line width: full ionization is expected for planar shocks with 80 km s-1 (Hartigan, Morse, & Raymond, 1994). The fact that planar shocks are not appropriate for CRL 618 could partially (but probably not totally) resolve this problem. Fast bow-shocks produce a range of ionization fractions along the bow-shock, with a large X value at the head of the shock but smaller at the wings, where the normal component of the shock velocity is substantially smaller. The result is a smaller mean ionization fraction than that predicted by planar shocks moving at the same velocity, which produces equally high X values all along the front.
10 Discussion
10.1 Formation and evolution of the circumstellar envelope of CRL 618
It is widely accepted that the actual nebular geometry and kinematics of CRL 618 are the result of the interaction between the circumstellar material mostly resulting from the AGB mass-loss process with fast stellar winds ejected more recently, probably in the post-AGB phase (§ 1). Under this scenario the optical shock-excited, rapidly expanding lobes are made of circumstellar material that is undergoing the passage of shock fronts produced by the wind interaction.
Our results support this scenario and add more details on how this process is taking place. In our opinion, the morphology of the nebula, consisting of several multiply-directed narrow lobes, suggest that the post-AGB wind is collimated rather than spherical. The presence of lobe components directed along different axes indicates multiple ejection events, that could have happened with different orientations and velocities, and/or at different epochs. The bright ripple-like structure found along the lobes could be due to instabilities in the flow or bow-shocks resulting from the episodic interaction between fast collimated jets and the slowly expanding envelope ejected during the AGB phase (see a more detailed analysis of and discussion on imaging in different filters in Sahai et al. 2002, in preparation).
The complex spatio-kinematic structure of the lobes leads to kinematical ages ranging from 100 yr in the innermost regions of the lobes to 400 yr at the tips, without correcting for projection effects. This age difference could be real, in which case the innermost regions would have been more recently shocked, or it could be due to different inclinations of, and/or different decelerations suffered by, the lobe sub-components. Adopting a mean inclination of 24°, the age of the optical nebula is 180 yr.
The electron density does not vary systematically along the shocked lobes of CRL 618 (§ 9.1). Since the ionization fraction is not expected to vary drastically along the lobes (note that , given by the line FWZI’s, and the [O I]/H line ratio have similar values all along the nebula), a roughly constant suggests that the total density is constant as well. Such a density distribution is most likely inconsistent with most of the [S II] emission (and, probably, most forbidden lines) arising from the lobe interior, which is presumably filled with the fast post-AGB wind whose density is expected to decrease with the distance (C-F. Lee and Sahai, in preparation). We think that most of the emission arises from shocked gas in thin-walled lobes, a conclusion supported by the limb-brightened appearance of the lobes in the images (Fig. 1) and the better agreement between the geometrical and H masses of ionized gas derived in § 9.2.
The spatial distribution of the radial optical thickness beyond the tips of the lobes suggests a high contrast between the density of dust in the gas filling the lobes and that in front of them, in the AGB CSE. This is consistent with the optical lobes of CRL 618 being cavities excavated in the AGB envelope by the impact of the post-AGB wind (but see § 8.2 for caveats).
The forward shocks accelerating and shaping the lobes of CRL 618 are very likely in a radiative regime because the cooling time of the gas immediately behind the shock front in the lobes, , is significantly smaller than the dynamical time scale of the nebula ( 180 yr). Immediately after the shock, the gas temperature is expected to rise to 105-106 K for a shock speed of 200 km s-1 (e.g. Dalgarno & McCray, 1972). The time required by the gas to cool down to the present temperature of the shocked optically emitting lobes (of the order of 104 K) is , where is the shock velocity, is the pre-shock number density of nuclei, and () is the cooling rate (Blondin, Fryxell, & Konigl, 1990). For a shock velocity of 200 km s-1, ()=few10-22 erg cm-3 s-1 is appropriate (Dalgarno & McCray, 1972) and (yr)570, where and are given in 107cm s-1 and cm-3 units, respectively. The density of the molecular AGB envelope at a radial distance of 7″, i.e. ahead of the shocked lobes, provides a lower limit to the density of the pre-shock material since the first interactions between the post-AGB wind and the AGB CSE presumably took place closer to the central star. For a mass-loss rate = 510-5 yr-1 and expansion velocity 17.5 km s-1 (§ 1), = 6104 cm-3 (2, assuming atomic pre-shock gas). For the numbers above, we derive 0.04 yr. Even accounting for an uncertainty in the preshock density of one order of magnitude, the cooling time is much smaller than the dynamical time scale.
Thin lobe walls, where most of the shocked material seems to be located, and high electron densities, up to 104 cm-3, are both expected in the case of radiative shocks: the low thermal pressure after the shock passage leads to the collapse of the shocked material in a very small and dense region after the shock (see, e.g., Frank, 1999, for a review). The large length-to-width ratio of the lobes, 7, is also in better agreement with the shocks being radiative, since for the adiabatic case the thermal pressure of the shocked gas is very high, leading to inflated bubble-shaped lobes.
The nature of the reverse shocks, propagating in the post-AGB wind itself towards the nebula center, is uncertain because it depends on the unknown physical properties of the post-AGB wind. For 600 (§ 8.2) and a reverse shock velocity of the order of 100 km s-1, the cooling time of the shocked post-AGB gas would be 12 yr, and therefore the reverse shocks would also be in a radiative regime.
In the absence of a presently active energy input, the dense gas in the optical lobes of CRL 618 should be at a temperature significantly less than 104 K. The high electron densities in the lobes of CRL 618 would have led to a very quick recombination of the presently shocked and ionized gas: the recombination time scale is about 10 yr for a total hydrogen recombination coefficient (104K) = 4.1810-13 cm-3 s-1 (see, e.g., Kwok, 2000, and references therein). Also, the time for the shocked gas to cool down one order of magnitude (to 1000 K) is 2 yr, using a cooling rate 10-25 erg cm-3 s-1, appropriate for 104 K and ionization fraction 0.01 (Dalgarno & McCray, 1972). Such a short cooling time implies that, in the absence of a continuous ionization/heating source, the gas in the lobes of CRL 618 should have become atomic and cool in a time scale much smaller than the age of nebula, 180 yr. Even if we have overestimated its kinematical age, CRL 618 is at least about 30 years old, since it was observed with similar characteristics in 1973 by, e.g., Westbrook et al. (1975). The most likely energy source for maintaining a high temperature (1000 K) in the lobes is an ongoing interaction between the post-AGB wind and the circumstellar material (note that the central star is not hot enough to ionize and and heat the lobes). This implies that the fast wind, which is ultimately responsible for the shaping and evolution of its circumstellar envelope, is currently active in CRL 618.
This fast wind is not necessarily stationary, but may rather be pulsed (episodic) with a period smaller but comparable to the recombination time scale of the shocked gas ( 10 yr). In this case, the shocked material (initially fully ionized) would have time to partially recombine between pulses, which might be a contributing factor to maintaining a low ionization fraction in the lobes of CRL 618 in spite of the high velocity of the shocks. On the other hand, to keep the temperature of the shocked gas above K, the pulse period should be 2 yr. The idea of a pulsating fast wind is consistent with the presence of the multiple bright, bow-shaped and ripple-like structures seen along the lobes of CRL 618 (Fig. 1) since their separations correspond to time-scales of 10 yr.
Finally, we have reported a recent increase (decrease) of the intensity of the [O III]5007 Å ([O I]6300 Å) lines in CRL 618 (§ 4.2). This change also provides indirect evidence for the presence of continuously evolving shocks resulting from a continuous interaction between the ongoing post-AGB wind and the surrounding media. Since shocks are the main excitation mechanism of the gas in the lobes of CRL 618, where most of the forbidden line emission is detected, the observed [O III] brightening probably has its origin in a change of the shock properties (rather than in the stellar radiation). The [O III]/H ratio is very sensitive to the shock velocity (HRH87) and therefore, the recent increase of the [O III] flux may indicate that the ongoing shocks are faster now than 10 years ago. As a consequence of the shock acceleration the ionization fraction of the lobes could have increased, leading to a weakening of the [O I] lines. The increasing velocity of the shocks could point to acceleration of the stellar post-AGB wind. The time scale of the [O III]/[O I] brightening/weakening (observed over 10 yr) is consistent with the expected shock velocity and the size of the shocked-gas emitting region: a 90-200 km s-1 shock will cross the 01-wide lobe walls (1.31015 cm) in only 4.7-2.1 yr.
10.2 Future circumstellar evolution of CRL 618
The shocked optical lobes of CRL 618 could evolve into a fast, bipolar molecular outflow if the time scale of molecular reformation in the shocked gas is smaller than the time required by the expanding ionization front (produced by the central star) to reach and fully ionize the whole nebula.
The present radiative, forward shocks will continue propagating through the molecular cocoon (traced by CO), accelerating and shaping more and more material of the AGB CSE. We are observing the beginning of this process, when the shocked material is still hot (and, therefore, primarily visible in the optical), and its mass is still low compared to that of the unshocked envelope. The hot shocked material will cool down, allowing molecule reformation, and would be observed as an extended, bipolar outflow moving at high velocity. This is what presumably already happened to a part of the shocked material: the fast molecular bipolar outflow observed in the innermost parts of CRL 618 (§ 1, discussed in detail in Sánchez Contreras et al. 2002 — paper II, in preparation). If the shocks have sufficient energy to accelerate most of the AGB envelope, the mass of the future fast, bipolar outflow of CRL 618 could be a significant fraction of the total mass of the AGB CSE, 1.5 . The interaction of this fast and massive molecular jet with the interstellar medium or the low density, outermost parts of the CRL 618 CSE could also lead to new shocks that would be observed, in their first stages, through optical line emission surrounding the molecular bipolar outflow.
In our opinion, the possible future evolution of CRL 618 described above is what already occurred in another well studied protoplanetary nebula, OH 231.8+4.2. This object shows a very collimated and fast molecular outflow which was presumably shaped and accelerated by radiative shocks resulting from a two-wind interaction process 1000 yr ago (Sánchez Contreras et al, 2000; Alcolea et al., 2001); this outflow should have been in the past a very intense emitter of recombination and forbidden lines at short wavelengths, as the optical lobes in CRL 618. Surrounding the collimated molecular outflow of OH 231.8+4.2, there is a wide bow-shaped nebula of shock-excited warm gas which is observed in the visible (Bujarrabal et al., 2002; Sánchez Contreras et al, 2000). This component is believed to result from the hydrodynamical interaction between the bipolar CO outflow and the tenuous circumstellar material, the shocks generated in this interaction being more likely in an adiabatic regime.
The central star of OH 231.8+4.2 is still very cool ( 2500 K) and therefore is not able to ionize the circumstellar material. The evolution of the optical lobes of CRL 618 into a fast molecular outflow (like in OH 231.8+4.2) in the future requires that once the wind interaction stops, the time required by the ionization front, produced by the hot central star, to reach the lobes () be larger than the molecular reformation time scale ().
In the relatively dense envelopes of PPNe, the time scale for molecule formation is 1000 yr, as deduced from the widespread existence of fast ( 100 km s-1) molecular outflows with kinematical ages 103 yr (see, e.g., Bujarrabal et al., 2001): note that molecules are totally destroyed by shocks at speeds 30 km s-1 (Hollenbach & McKee, 1989) and therefore molecules moving at such high velocities have most likely been reformed in the post-shock gas. The kinematical age of the compact molecular outflow of CRL 618 itself, moving at 100 km s-1, is only of the order of 102 yr (§ 1), so, in general, we can expect molecule reformation to occur in 102-103 yr. This value is also in reasonable agreement with theoretical estimates of in dense, 106 cm-3, post-shock gas (Hollenbach & McKee, 1989).
The time required by the ionization front to reach the lobes, , depends on the relative expansion velocity of the front and the lobes. The expansion velocity of the ionization front in CRL 618, estimated from radio continuum mapping with high-angular resolution in different epochs, has decreased with time: from 50-74(/0.9 kpc) km s-1 (Kwok & Feldman, 1981) to 26(/0.9 kpc) km s-1 (Spergel, Giuliani, & Knapp, 1983). Expanding at this rate, the ionization front will never reach the lobes, which are moving much faster (up to 200 km s-1), and the molecules will reform in the shocked gas sooner or later. If the shocked lobes are decelerated by interaction with the surrounding circumstellar gas and/or the velocity of the ionization front increases (due, e.g., to the evolution of the central star, which will become hotter and hotter, and the dilution of the circumstellar gas) then the UV stellar photons will be able to fully ionize the lobes of CRL 618. The ionization time-scale depends on different unknown physical parameters of the central star, such as mass, temperature, mass-loss rate, etc, and their evolution with time. The shocked gas would be observed as a molecular outflow during , whenever , otherwise CRL 618 will never develop a massive bipolar molecular outflow (like e.g. OH 231.8+4.2).
11 Conclusions
We have obtained ground-based, long-slit spectra in the ranges [6233-6806] Å and [4558-5331] Å for three different (1″-wide) slit positions in the PPN CRL 618. Based on the analysis of these spectra and direct (H and continuum) images, we find the following results:
The Balmer line emission results from the superposition of unscattered and scattered components. The unscattered emission is locally produced in the shocked lobes and in a inner, compact region labeled A’ (Fig. 1). The scattered radiation originates in the central H II region (and also maybe in region A’) and is reflected by the dust in the shocked lobes and in the unshocked AGB envelope. Most forbidden lines are entirely produced in the lobes but there is also forbidden line emission (e.g. [Fe III] and [S III]) arising in the H II region and region A’.
We identify the Wolf-Rayet bump at 6540 Å superimposed on the scattered continuum. This bump, and a number of high-excitation transitions such as, e.g., He II4686 Å, originate in the dense ( 105-107 cm-3) inner H II region, and are seen after being reflected by the nebular dust.
The spectrum of region A’ is similar to that of the inner H II region (dominated by high-excitation lines) but remarkably different from the spectrum of the shocked lobes (dominated by low-excitation lines), and is consistent with 104-105 cm-3 and full ionization in this region. Thus, region A’ very likely represents the outermost parts of the central H II region, i.e. it is gas ionized by the UV stellar radiation rather than by shocks.
The shock velocity derived from the profiles of line emission arising in the shocked lobes is 200 km s-1. However, the line ratios in the lobes are consistent with the predictions of bow-shock models with a lower shock velocity (less than about 90 km s-1, and probably 75 km s-1).
We have measured an increase (decrease) of the [O III]5007Å ([O I]6300Å) line flux by a factor 2.5 (0.7) with respect to observations performed 10 yr ago. Such variations could be due to a recent increase of the shock velocity.
The mean nebular inclination (with respect to the plane of the sky) is =24°6° and, very likely, less than 39°.
The material in the lobes of CRL 618 is moving away from the star at velocities up to 200 km s-1. The projected velocity of the gas shows a non-linear radial variation, resulting in a kinematical age that varies from 100 yr near the nebular center to 400 yr at the tips, without correcting projection effects. For a mean inclination of =24°, the kinematical age of the optical lobes is 180 yr.
The inner H II region and region A’ seem to be expanding at moderate velocity, 30 km s-1, much slower than the shocked lobes.
The extinction along the nebula is found to decrease from the center (AV 10 mag) to the lobe tips ( 2 mag); beyond the bright optical lobes, where an H scattered halo is visible, the extinction increases again. This increase indicates a large density contrast between the dust inside the optical lobes and beyond them, i.e. in the AGB CSE unaltered by the shocks. This result is consistent with the lobes of CRL 618 being cavities in the AGB CSE excavated by post-AGB winds.
The electron density, with mean values [5-8]103 and 8103-104 cm-3, for the east and west lobe, respectively, shows no systematic variation along the lobes.
The ionization fraction in the lobes is X 0.03-0.1, derived by comparison of different line ratios with predictions from planar shocks models. The total number density in the lobes is then 105-106 cm-3.
The mass of atomic gas in the east (west) lobe is 1.310-4 (7.010-5 ). The masses of ionized gas in the lobes are smaller: 610-5 , for the east lobe, and 410-5 for the western lobe. The ionized mass in region A’ is comparable to the ionized mass in the lobes or even higher, up to 10-4 .
The limb brightening of the optical lobes and the lack of a systematic spatial gradient in suggest that most of the line emission arises in a thin shell of shocked material rather than in gas filling the interior of the lobes. The thin-shell geometry is expected from radiative shocks shaping and accelerating the AGB circumstellar envelope. The radiative nature of the shocks is inferred from the short cooling time of the immediate post-shock gas, 0.04 yr (relative to the dynamical time).
The post-AGB wind is probably currently active, shocking and heating the AGB circumstellar material, since the time required for the gas in the shocked lobes (presently partially ionized) to cool down significantly below 104 K is 2 yr, much shorter than the age of the nebula.
References
- Alcolea et al. (2001) Alcolea, J., Bujarrabal, V., Sánchez Contreras, C., Neri, R., & Zweigle, J. 2001, A&A, 373, 932
- Aller & Keyes (1987) Aller, L. H. & Keyes, C. D. 1987, ApJS, 65, 405.
- Bachiller et al. (1988) Bachiller, R., Gómez-González, J., Bujarrabal, V., & Martín-Pintado, J. 1988, A&A, 196, L5
- Blondin, Fryxell, & Konigl (1990) Blondin, J. M., Fryxell, B. A., & Konigl, A. 1990, ApJ, 360, 370
- Bujarrabal et al. (1988) Bujarrabal, V., Gomez-Gonzalez, J., Bachiller, R., & Martin-Pintado, J. 1988, A&A, 204, 242
- Bujarrabal et al. (2001) Bujarrabal, V., Castro-Carrizo, A., Alcolea, J., & Sánchez Contreras, C. 2001, A&A, 377, 868
- Bujarrabal et al. (2002) Bujarrabal, V., Alcolea, J., Sánchez Contreras, C., and Sahai, R., 2002, A&A in press
- Cantó et al. (1980) Cantó, J., Meaburn, J., Theokas, A. C., & Elliott, K. H. 1980, MNRAS, 193, 911
- Cardelli, Clayton, & Mathis (1989) Cardelli, J. A., Clayton, G. C., & Mathis, J. S. 1989, ApJ, 345, 245
- Calvet and Cohen (1978) Calvet, N. and Cohen, M. 1978, MNRAS 182, 687
- Carsenty and Solf (1982) Carsenty, U. and Solf, J. 1982, A&A, 106, 307
- Cernicharo et al. (1989) Cernicharo, J., Guélin, M., Martin-Pintado, J., Peñalver, J., and Mauersberger, R., 1989 A&A 222, L1
- Dalgarno & McCray (1972) Dalgarno, A. & McCray, R. A. 1972, ARA&A, 10, 375
- Frank (1999) Frank, A. 1999, New Astronomy Review, 43, 31
- Gurzadyan (1997) Gurzadyan, G. A. 1997, The Physics and Dynamics of Planetary Nebulae, Springer-Verlag Berlin Heidelberg New York. Also Astronomy and Astrophysics Library.
- Gammie et al. (1989) Gammie, C. F., Knapp, G. R., Young, K., Phillips, T. G., & Falgarone, E. 1989, ApJ, 345, L87
- Goodrich (1991) Goodrich, R.W. 1991, ApJ 376, 654
- Gottlieb and Liller (1976) Gottlieb, E.W. and Liller, Wm. 1976, ApJ 207, L135
- Hajian, Phillips, & Terzian (1996) Hajian, A. R., Phillips, J. A., & Terzian, Y. 1996, ApJ, 467, 341.
- Hartigan, Raymond, and Hartmann (1987) Hartigan, P., Raymon, J., and Hartmann, L. 1987, ApJ 316, 323
- Hartigan, Morse, & Raymond (1994) Hartigan, P., Morse, J. A., & Raymond, J. 1994, ApJ, 436, 125
- Hollenbach & McKee (1989) Hollenbach, D. & McKee, C. F. 1989, ApJ, 342, 306
- Howarth (1983) Howarth, J.D. 1983, MNRAS 203, 301
- Kastner, Soker, and Rappaport (2000) Kastner, J., Soker, N., and Rappaport, S.A., 2000, proceedings of the ASP Conf. Ser. 199: Asymmetrical Planetary Nebulae II: From Origins to Microstructures
- Kaler (1978) Kaler, J. B. 1978, ApJ, 220, 887
- Kelly, Latter, and Rieke (1992) Kelly, D.M., Latter, W.B., and Rieke, G.H. 1992, ApJ 395, 174
- Knapp & Morris (1985) Knapp, G. R. & Morris, M. 1985, ApJ, 292, 640
- Knapp, Sandell, & Robson (1993) Knapp, G. R., Sandell, G., & Robson, E. I. 1993, ApJS, 88, 173.
- Kwok & Feldman (1981) Kwok, S. & Feldman, P. A. 1981, ApJ, 247, L67
- Kwok & Bignell (1984) Kwok, S. & Bignell, R. C. 1984, ApJ, 276, 544
- Kwok (2000) Kwok, S. 2000, The origin and evolution of planetary nebulae / Sun Kwok. Cambridge ; New York : Cambridge University Press, 2000. (Cambridge astrophysics series ; 33),
- Lambert et al. (1986) Lambert, D. L., Gustafsson, B., Eriksson, K., & Hinkle, K. H. 1986, ApJS, 62, 373
- Leuenhagen, Hamann, & Jeffery (1996) Leuenhagen, U., Hamann, W.-R., & Jeffery, C. S. 1996, A&A, 312, 167
- Meixner et al. (1998) Meixner, M., Campbell, M. T., Welch, W. J., & Likkel, L. 1998, ApJ, 509, 392.
- Mendoza (1983) Mendoza, C. 1983, IAU Symp. 103: Planetary Nebulae, 103, 143
- Martín-Pintado et al. (1988) Martín-Pintado, J., Bujarrabal, V., Bachiller, R., Gómez-González, J., & Planesas, P. 1988, A&A, 197, L15
- Martín-Pintado et al. (1993) Martín-Pintado, J., Gaume, R., Bachiller, R., & Johnson, K. 1993, ApJ, 419, 725
- Neri et al. (1992) Neri, R., García-Burillo, S., Guèlin, M., Guilloteau, S., and Lucas, R. 1992, A&A 262, 544
- Osterbrock (1989) Osterbrock D.E., 1989, Astrophysics of Gaseous Nebulae and Active Galactic Nuclei. University Science Books, Mill Valley, CA
- Phillips et al. (1992) Phillips, J. P., Williams, P. G., Mampaso, A., & Ukita, N. 1992, A&A, 260, 283
- Riera, Phillips, & Mampaso (1990) Riera, A., Phillips, J. P., & Mampaso, A. 1990, Ap&SS, 171, 231
- Reipurth et al. (2000) Reipurth, B., Yu, K., Heathcote, S., Bally, J., & Rodríguez, L. F. 2000, AJ, 120, 1449.
- Schmidt and Cohen (1981) Schmidt, G.D. and Cohen, M. 1981, ApJ 246, 444
- Sahai & Trauger (1998) Sahai, R. & Trauger, J. T. 1998, AJ, 116, 1357
- Sánchez Contreras et al (2000) Sánchez Contreras, C., Bujarrabal, V., Miranda, L. F., & Fernández-Figueroa, M. J. 2000, A&A, 355, 1103
- Spergel, Giuliani, & Knapp (1983) Spergel, D. N., Giuliani, J. L., & Knapp, G. R. 1983, ApJ, 275, 330
- Schwarz et al. (1997) Schwarz, H. E., Aspin, C., Corradi, R. L. M., & Reipurth, B. 1997, A&A, 319, 267
- Trammell, Dinerstein, and Goodrich (1993) Trammell, S.R., Dinerstein, H.L., and Goodrich, R.W. 1993, ApJ 402, 249
- Trammell (2000) Trammell, S. R. 2000, ASP Conf. Ser. 199: Asymmetrical Planetary Nebulae II: From Origins to Microstructures, 147
- Tylenda, Acker, & Stenholm (1993) Tylenda, R., Acker, A., & Stenholm, B. 1993, A&AS, 102, 595
- Welch et al. (1999) Welch, C. A., Frank, A., Pipher, J. L., Forrest, W. J., & Woodward, C. E. 1999, ApJ, 522, L69.
- Westbrook et al. (1975) Westbrook, W.E., Becklin, E.E., Merrill, K.M., Neugebauer, G., Schmidt, M., Willner, S.P., and Wynn-Williams, C.G. 1975, ApJ 202, 407
| Line | Wavelength | Flux | ||
|---|---|---|---|---|
| (Å) | (10-15 erg s-1 cm-2) | |||
| West | East | |||
| Mg I | 4571.1 | 1.2(0.3) | 3.5(0.9) | |
| W-R bump | 4620-55aaN V 4620, N III 4634,4641,C III 4647,4650 | – | 6(2) | |
| Fe III, C IV | 4658.05,4658.30bbBlend of lines | – | 3.7(0.8) | |
| He II | 4686.55 | – | 0.8(0.2) | |
| Fe III | 4701.5 | – | 1.7(0.4) | |
| Fe III | 4733.9 | – | 0.5(0.4) | |
| Fe III | 4754.7 | – | 0.5(0.4) | |
| H | 4861.3 | 11(1) | 46(4) | |
| O III | 4958.9 | 0.4(0.2) | 2(1) | |
| O III | 5006.8 | 1.3(0.2) | 6(1) | |
| Fe III | 5011.3 | – | 1(0.6) | |
| He I | 5015.7 | – | 0.6(0.7) | |
| Fe II | 5158.0,5158.8bbBlend of lines | 1.5(0.2) | 2.5(0.7) | |
| N I | 5197.9 | 9.5(0.3) | 23(1) | |
| N I | 5200.3 | 5.8(0.3) | 11.0(0.7) | |
| Fe II | 5261.6 | 0.9(0.3) | 1.2(0.6) | |
| Fe III | 5270.4 | – | 4.3(0.6) | |
| O I | 6300.3 | 55(3) | 94(4) | |
| S III | 6312.1 | – | 2.5(0.6) | |
| O I | 6363.8 | 18(2) | 33(3) | |
| N II | 6548.0 | 10(2) | 16(2) | |
| H | 6562.8 | 83(4) | 390(8) | |
| N II | 6583.5 | 33(3) | 56(3) | |
| He I | 6678.2 | – | 1.8(0.8) | |
| S II | 6716.4 | 18(2) | 34(3) | |
| S II | 6730.8 | 35(2) | 60(3) | |
Note. — Errors are given in parenthesis.
| Observation | J.D. | O I/H | Refs. | |
|---|---|---|---|---|
| Date | (days) | East | West | |
| 1973 Oct-1974 Feb | 2442032 | 1.2aaRatio obtained for the whole nebula | 1.2aaRatio obtained for the whole nebula | 1 |
| 1979 Dec | 2444223 | 0.9 | 1.3 | 2 |
| 1989 Feb-1990 Oct | 2447846 | 0.4 | 0.8 | 3 |
| 1990 Oct-1990 Nov | 2448197 | 0.5 | 0.3 | 4 |
| 1994 Oct | 2449641 | 0.4 | 1.1 | 5 |
| 2000 Nov | 2451864 | 0.2 | 0.7 | 6 |
| slit N93 | slit S93 | ||||||
| offset | +21 | FWHMaaDeconvolved with the spectral resolution, 50 km s-1. | FWZIbbMeasured at a 3 level. | +21 | FWHMaaDeconvolved with the spectral resolution, 50 km s-1. | FWZIbbMeasured at a 3 level. | |
| (′′) | (km s-1) | (km s-1) | (km s-1) | (km s-1) | (km s-1) | (km s-1) | |
| West (weak) lobe | |||||||
| 62 | 76 | 125 | 220 | 56 | 136 | 190 | |
| 37 | 56 | 75 | 190 | 44 | 73 | 190 | |
| 10 | 61 | 61 | 90 | 56 | 61 | 100 | |
| East (bright) lobe | |||||||
| 10 | 49 | 150 | 200 | -60 | 125 | 170 | |
| 32 | 31 | 110 | 250 | -45 | 125 | 240 | |
| 54 | 39 | 117 | 230 | -54 | 146 | 230 | |
| 65 | 69 | 138 | 210 | -64 | 177 | 220 | |
| () | () | |
|---|---|---|
| East | 1.310-4 | 1.310-4(a)(a)Mass of region A’ + east lobe |
| West | 7.010-5 | 4.010-5 |