XMM-Newton Reflection Grating Spectrometer Observations of the Prototypical Starburst Galaxy M82
Abstract
We present results from XMM-Newton Reflection Grating Spectrometer observations of the prototypical starburst galaxy M82. These high resolution spectra represent the best X-ray spectra to date of a starburst galaxy. A complex array of lines from species over a wide range of temperatures is seen, the most prominent being due to Lyman- emission from abundant low Z elements such as N, O, Ne, Mg and Si. Emission lines from Helium-like charge states of the same elements are also seen in emission, as are strong lines from the entire FeL series. Further, the OVII line complex is resolved and is seen to be consistent with gas in collisional ionization equilibrium.
Spectral fitting indicates emission from a large mass of gas with a differential emission measure over a range of temperatures (from 0.2 keV to 1.6 keV, peaking at 0.7 keV), and evidence for super-solar abundances of several elements is indicated. Spatial analysis of the data indicates that low energy emission is more extended to the south and east of the nucleus than to the north and west. Higher energy emission is far more centrally concentrated.
keywords:
galaxies: individual: M82 galaxies: starburst galaxies: ISM galaxies: haloes X-rays: galaxies ISM: jets and outflows1 Introduction
Starbursts play a key role in galaxy formation and evolution, and, in addition, feedback from star-formation in starburst galaxies, in the form of superwinds, probably plays a key role in enriching and heating the intergalactic medium (see Heckman 2001 for a recent review). Further, because superwinds are driven by hot gas generated by stellar winds and supernovae in the starburst, X-ray observations of starbursts have a pivotal position in understanding the structure of starburst and superwinds.
M82 is regarded as one of the archetypical starburst and superwind galaxies. It is a nearby object ( Mpc, Freedman et al. 1994), is very IR luminous, and is currently undergoing a strong starburst (Rieke et al. 1993). M82 has been observed by all major X-ray satellites (e.g. Read, Ponman & Strickland 1997; Strickland, Ponman & Stevens 1997; Cappi et al. 1999; Kaaret et al. 2001), and the superwind is clearly visible in X-rays and also in H (Shopbell & Hawthorn 1998), with clear evidence of a bipolar outflow and a good deal of similarity in the X-ray/H morphology (Lehnert, Heckman & Weaver 1999). Devine & Bally (1999) noted a feature termed the H “cap” lying well above the galaxy disc that has X-ray emission associated with it.
The XMM-Newton satellite has the largest collecting area of any imaging X-ray telescope, and this coupled with the spectral-imaging (EPIC) and grating instruments (Reflection Grating Spectrometers RGS) offers a new window on starburst galaxies. As M82 is the brightest starburst in the sky, these observations are of key importance to understanding starbursts. In this paper we present results from the RGS. Preliminary results from the EPIC instruments will be presented in Bravo-Guerrero et al. (2002). It is worth noting that at the present time, almost no RGS results from non-active spiral galaxies have been presented, the most relevant being the very preliminary results from the other famous nearby starburst, NGC 253 (Pietsch et al. 2001).
The RGS instruments (den Herder et al. 2001) on board the European X-ray observatory XMM-Newton (Jansen et al. 2001) offer, at least for objects of extent of order 12′, the possibility of very high resolution X-ray spectroscopy combined with some spatial resolution in the cross-dispersion direction. Such unique capabilities are excellently suited to the study of the thermodynamic properties of the hot gas within and surrounding the M82 starburst nucleus. Here we describe our preliminary findings in analysing the RGS data obtained during the XMM-Newton guaranteed time observations. Results from further more in-depth analysis will be presented in a future paper. The next section describes the observations and the data reduction techniques. Preliminary spectral and spatial results are then presented and discussed, and finally we present our conclusions.
2 Observations and data reduction
M82 was observed with XMM-Newton during orbit 258 on the 5th of June 2001 for one exposure of around 30 ks for each of the European Photon Imaging Camera (EPIC) instruments and the RGS spectrometers. The standard reduction of the RGS data was performed using the latest version (V. 5.2) of the Science Analysis System (SAS), using the most recent calibration for effective area and wavelength scale. The reduction was performed using rgsproc-0.98.4, defining the position of the M82 nucleus implicitly.
M82 is a very bright X-ray source, and thus we were not too concerned with variations in the background. Nevertheless, a very short period of high background proton flaring was removed from the data. In extracting the spectra, we attempted to optimize the location and width of the spatial extraction mask. Such a process can involve a trade-off between improving the signal-to-noise via maximizing the number of source counts, and reducing the background noise via minimizing the source extraction region. The fraction of the PSF sampled within the default pipeline mask is 90 per cent of the source counts. This assumes however, that the source is point like. In our analysis, we used a value of 95 per cent. The width of the resultant mask in the cross-dispersion direction ranged from 1.32′, and covered the vast majority of the emission visible in the RGS. The background within this mask was seen to be largely negligible.

As the spatial resolution of the RGS in the cross-dispersion direction is about 15′′, 5 to 8 spatial resolution elements are sampled within our extraction region. The XMM-Newton EPIC images (Bravo-Guerrero et al. 2002) show the bright M82 core to have an extent of 15′′, and we expect the RGS lines to be broadened. The broadening varies only a little with wavelength and is approximately Å, being the source extent (in arcminutes). Hence the broadening should be about 0.03Å, and we should be able to resolve the helium-like triplets of OVII, and possibly NeIX, though perhaps not those of MgXI and SiXIII.
First- and second-order spectra for RGS1 and RGS2 were extracted. While it is possible and tempting to merge the data into one spectrum, this is not encouraged for analysis purposes as the pointing of the two RGS instruments are different, resulting in different dispersion angles and wavelength scales. It is useful however to combine the spectra for non-analysis purposes to obtain a single spectrum, and increase the signal-to-noise to detect faint spectral features. A single fluxed spectrum, in units of photons cm-2 s, was produced from the two first-order spectra and is shown in Fig. 1 (second-order spectra can be added also, though this degrades the spectral resolution).
As can be seen, the RGS spectrum is dominated by Ly emission lines of hydrogenic charge states of the abundant low Z elements (N, O, Ne, Mg, Si). Helium-like charge states of the same elements are also seen in emission, growing in strength (relative to the respective Ly emission) with line energy (from O to Si). Neon-like and fluorine-like charge states of Fe are also extremely visible and there is a very strong suggestion of emission from essentially the entire Fe L series, from FeXVII (neon-like) through to FeXXIV (lithium-like). Furthermore, the individual resonance, intercombination (two lines, unresolved) and forbidden lines in the OVII complex are resolved, as is some structure in the He-like NeIX triple. These helium-like triples are discussed later.
Though one cannot perform quantitative spectral fits to the fluxed spectrum shown in Fig. 1, several conclusions can be drawn directly from the figure. The strength of the FeXVII lines, relative to the K-shell lines, suggests strongly that collisional ionization is the dominant mechanism for producing the soft X-ray emission. One can infer temperatures of 0.3 keV (OVII) to 1.5 keV (SiXIII) or possibly higher. Significant photoelectric absorption with implied column densities of a few 1021 to 1022 cm-2 is perhaps suggested by the weakness of the longer wavelength lines. In fact, a comparison of Fig. 1 with the fluxed RGS spectrum of the other famous nearby starburst galaxy, NGC 253 (Pietsch et al. 2001), is extremely instructive. Firstly, an initial glance suggests that they are very similar, and in many respects, they are. Concentrating on the differences, as regards the weakness of the longer wavelength lines as compared with the shorter wavelength ones, the relative deficit at long wavelengths in M82 may imply a larger absorbing column in M82 than in NGC 253. Furthermore, the greater strength of lines emanating from higher-ionization-state ions relative to lower-ionization-state ions (compare OVIII to OVII, NeX to NeXI or FeXVIII to FeXVII in the two galaxies), together with a similar effect observed in lines from the FeL series, implies a generally higher temperature in M82 than in NGC 253. As noted by Pietsch et al. (2001), the NGC 253 RGS spectrum, and by extension, the M82 RGS spectrum presented here, appears very reminiscent of the spectrum of an intermediate-age supernova remnant (SNR). This is not unexpected given the scenario of a starburst nucleus and the interaction of the outflowing wind with the surrounding cooler ISM gas. Lastly, it is worth noting the difference in absolute flux levels M82 appears far brighter (by about a factor of 4) than NGC 253.
3 Spectral Analysis
X-ray spectroscopy in the RGS range is very well suited to studying the mix in temperature and abundance of the relatively cool X-ray gas in and around the M82 nuclear starburst. From what we already know we can make some interesting conclusions.
The fact that such a large range of FeL states exists simultaneously, along with hydrogen- and helium-like emission lines from N to Si, is indicative of the emission not being isothermal, and point to emission from a multitemperature gas. Especially interesting is the fact that there appears to exist perhaps all eight ionisation states of the FeL series. This allows the possibility of using iron as a type of thermometer; i.e. with ionisation potentials of between 500 and 2000 eV, the distribution of electron temperatures in this range can be addressed, and it is possible to uniquely determine the temperature distribution. Highly detailed analysis using the FeL series we defer to a later paper. It should be stated that the determination of the temperature distribution using the H- and He-like lines from the other different elements is plagued by abundance uncertainties. Another point is that the emission features from different ions appear to have different profiles and widths, suggesting slight differences in the properties and/or relative positions of the X-ray emitting gas within the M82 nuclear and starburst areas. For example, the Mg and Ne lines appear rather thin, whereas some of the Fe features have an appreciable width.
As the bright M82 X-ray core appears moderately resolved in the RGS detectors, a rigorous analysis should also provide some information as to the temperature and abundance structure. As we are here dealing with merely a preliminary look at the M82 RGS data, and as the interlinked spatial and thermal properties are likely to be very complicated, we defer a rigourous discussion of such an analysis to a later date. We have been slightly unfortunate however, in that the RGS slit, lying parallel as it does to the single long CCD gap of the EPIC-PN detector, samples the galaxy in neither the major axis nor the minor axis direction, but rather at an angle approximately bisecting the two. It would have been better (and easier in analysis terms) to have the RGS sampling either along the disk of the galaxy or along the direction of the starburst outflow. We present an initial spatial analysis of the RGS data in the next section.
In order to perform detailed spectral analysis, separate response files for each instrument and order (i.e. for each separate spectrum created) were generated using rgsrmfgen-0.45.3, using, as is recommended, a large number (4000) of energy bins. These responses were then attached to their relevant spectra and the spectra were individually grouped into XSPEC-usable spectra with a minimum of 20 counts per bin, a bin typically spanning Å.
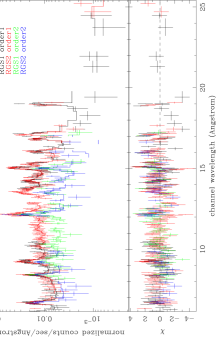
The four spectra (RGS 1 & 2, orders 1 & 2) were fitted simultaneously using a variety of spectral models, forcing the model parameters to be identical for each of the four spectral datasets, and allowing only a small normalization difference between the four components of the model(s) (to allow for small calibration uncertainties between the instruments). In each model a redshift for M82 of was used. It is very useful to combine the data in this manner as gaps in the data due to non-functioning CCDs (specifically RGS1 CCD 7 and RGS2 CCD 4) can be filled with data from the other instrument and order(s).
The fact that perhaps all the ionization states of the FeL series exist indicates that the gas is clearly non-isothermal; i.e. gas over a range of temperatures is contributing to the X-ray emission. Physically realistic multi-temperature models were fit to the data, the best (red. , with 399 degrees of freedom) being an XSPEC-c6vmekl model; a multi-temperature, variable-abundance mekal model using a sixth-order Chebyshev polynomial (Singh, White & Drake 1996) for the differential emission measure (DEM). The data and best-fitting model are shown in Fig. 2, and the DEM is shown in Fig. 3. The XSPEC DEM shows emission from gas over a range of temperatures, from around 0.2 keV to 1.6 keV, peaking at around 0.7 keV. Although the associated errors are large, super-solar abundances are obtained for Mg (3.3) and Si (7.1), moderate, near-solar values are obtained for N (1.4), O (0.7) and Fe (0.9), little Na (0.3) and essentially no Al is seen.

3.1 Helium-like Triplets
Within the helium-like OVII complex, the individual resonance (), intercombination (, two lines, unresolved) and forbidden () lines appear resolved, as is some structure in the He-like NeIX complex. A fit to the OVII complex, comprising of an absorbed power-law, to represent the continuum, plus three fixed-energy gaussians, to represent the triplet, was only conclusive in terms of the line being significantly weaker than either of the other two lines, and the line being stronger (perhaps by up to a factor 2) then the line. Similar conclusions could be drawn by essentially counting the photons appearing at the three energy positions in the spectral data. Via a combination of these two methods, rough approximations to the standard gas diagnostic ratios (Gabriel & Jordan 1969) of and could be obtained. These values are consistent with that of collisionally ionized gas, as expected in a hot gas starburst environment. The fact that the line is stronger than the line is a further strong indicator of hot gas in collisional ionization equilibrium (c.f. Fig.5 of Kinkhabwala et al. 2002). Little can be said as regards the NeIX triplet, due to strong contamination from FeXIX, FeXX and FeXIX features at 13.513.8 Å.
3.2 Line Widths and Shifts
We attempted modelling the RGS spectra with a continuum plus a set of spectral lines, the most successful model comprising a power-law to represent the continuum with 11 gaussians representing the 11 most prominent lines, specifically those of SiXIII, MgXII, MgXI, NeX, NeIX, OVII and FeL lines at 0.863, 0.826, 0.775, 0.739 and 0.727 keV. Fits were made using this model, both fixing the positions of the lines as above, and also allowing for small redshifts in the line positions (in order to perhaps detect some bulk motion of the gas). Both fits resulted in very similar widths for the individual lines, ranging from one or two 10’s of eV; SiXIII(19.214.1 eV), NeIX(10.66.7 eV), Fe-L[0.863] (22.15.5 eV) to near-delta functions, e.g. the Mg lines (error 510 eV). Though a far better fit was obtained with the redshifted-line model (red. c.f. 1.90), no trend was seen within the errors as regards a large majority of the lines showing the same redshift, and we cannot therefore attribute a bulk velocity to the X-ray emitting gas on the basis of the X-ray lines being systematically redshifted by the same amount.
4 Spatial Analysis
In looking at the line profiles in the dispersion direction, spatial information can be extracted. This is easiest done when the line is strong, non-complex (i.e. H-like), and is fairly far from any neighbouring lines. The OVIII line is a good example and shows (Fig. 1) a larger tail of emission to lower wavelengths than to higher. The RGS lies approximately east south-east to west north-west (at a clockwise position angle to the vertical of ), and the OVIII line profile is indicative of more OVIII emission lying to the east (and south-east) of the nucleus, compared to the west (and north-west). Higher energy H-like lines (NeIX, MgXII) exhibit more symmetric and thinner line profiles, indicative of the emission in these higher energy lines as being more centrally localised and being no more prevalent in one direction around the nucleus than another.
As the RGS is a slitless, nearly stigmatic spectrometer, we can also place some constraints on the spatial dependence of the various lines by examining the emission line profiles in the cross-dispersion direction. In creating the cross-dispersion profile of the flux in a particular emission line, events were selected (from, when available, both the RGS1 and RGS2 data) with wavelength values within a certain range (typically 0.250.5 Å) of the wavelength of the line centre. Background events were extracted from an equal area (in wavelength-cross-dispersion angle space) surrounding this initial line extraction region. Once the line counts and background counts were placed into 15′′ cross-dispersion bins, the background-subtracted cross-dispersion profile could be created. This was done for each prominent line visible in the RGS spectrum. Four of these profiles (from low to high energy) are shown in Fig. 4.
The RGS samples the galaxy emission (in dispersion angle) at an angle approximately bisecting the major and minor axes. The cross-dispersion axis therefore also bisects the major and minor axes of M82 and lies such that negative distance values in Fig. 4 correspond to areas to the south and south-west of the galaxy nucleus (at a position angle clockwise from vertical of ). Positive values correspond to areas to the north and north-east ().
The OVIII profile is the strongest and falls off less steeply to the south (and SW) as to the north. A similar behaviour is seen in the FeXVII (15Å) profile, and is indicative of there being more emission in these lines to the south (and SW) of the nucleus as to the north the nuclear emission appears more extended in these spectral lines to the south than to the north. The higher energy NeX profile shows a similar behaviour also, but the profile is narrower (the FWHM for OVIII is about 110′′, whereas for NeX, it is about 70′′). The emission from higher energy lines therefore appears more centrally concentrated and not as extended. The low energy OVII feature, although weak, is interesting in that there appears to be an enhancement at this energy to the north (and NE) of the nucleus.

5 Conclusions
We have presented here the first high resolution spectra of the M82 starburst taken with the XMM-Newton RGS instrument. As M82 is the brightest starburst galaxy and XMM-Newton is the satellite with the largest collecting area, these spectra represent the best X-ray spectra to date of a starburst galaxy. Initial spectral and spatial results have been presented and these can be summarized as follows:
-
•
The RGS spectrum is dominated by Ly emission lines of hydrogenic charge states of the abundant low Z elements (N, O, Ne, Mg, Si). Helium-like charge states of the same elements are also seen in emission, as is emission from the entire FeL series, from FeXVII through to FeXXIV.
-
•
The OVII complex is resolved into resonance, intercombination and forbidden lines, and the line ratios are consistent with hot gas in collisional ionization equilibrium. Significant structure is also observed in the NeIX triple, though contamination from Fe exists.
-
•
The FeXVII line strengths are consistent with emission from gas in collisional ionization equilibrium. Gas over a range of temperatures (0.3 keV to 1.5 keV, or higher) can be inferred from the presence of the lines alone.
-
•
The M82 starburst appears generally hotter and brighter (by a factor of 4) when compared with NGC 253. The weaker longer wavelength lines may suggest a higher level of photoelectric absorption in M82.
-
•
A multi-temperature, variable-abundance mekal model fits the data well. The differential emission measure shows emission from gas over a range of temperatures (from 0.2 keV to 1.6 keV, peaking at around 0.7 keV). High abundances are obtained for Mg and Si, while near-solar values are obtained for N, O and Fe.
-
•
The OVIII line profile suggests more OVIII emission lying to the east (and south-east) of the nucleus, compared to the west. The more symmetric, thinner higher energy line profiles indicates their emission as being more centrally localised and uniformly distributed.
-
•
Cross-dispersion line profiles suggest that emission from the lower energy lines is more extended to the south (and SW). Higher energy lines show similar behaviour, but the inferred extent is reduced.
Acknowledgements
AMR and IRS acknowledge the support of PPARC funding, and thank the referee for useful comments which have improved the paper significantly.
References
- [1] Cappi M., et al., 1999, A&A, 350, 777
- [2] Bravo-Guerrero J., Read A.M., Stevens I.R., 2002, in prep.
- [3] den Herder J.W., et al., 2001, A&A, 365, L7
- [4] Devine D., Bally J., 1999, ApJ, 510, 197
- [5] Freedman W.L., et al., 1994, ApJ, 427, 628
- [6] Gabriel A.H., Jordan C., 1969, MNRAS, 145, 241
- [7] Heckman T.M., 2001, To appear in “Extragalactic Gas at Low Redshift”, ed. J. Mulchaey and J. Stocke, ASP Conf. Series (astro-ph/0107438)
- [8] Jansen F., et al., 2001, A&A, 365, L1
- [9] Kaaret P., et al., 2001, MNRAS, 321, L29
- [10] Kinkhabwala A., et al., 2002, ApJ, in press (astro-ph/0203290)
- [11] Lehnert M.D., Heckman T.M., Weaver K.A., 1999, ApJ, 523, 575
- [12] Pietsch W., et al., 2001, A&A, 365, L174
- [13] Read A.M., Ponman T.J., Strickland D.K., 1997, MNRAS, 286, 626
- [14] Rieke G.H., Loken K., Rieke M.J., Tamblyn P., 1993, ApJ, 412, 99
- [15] Shopbell P.L., Bland-Hawthorn J., 1998, ApJ, 493, 129
- [16] Singh K.P., White N.E., Drake S.A., 1996, ApJ, 456, 766
-
[17]
Strickland D.K., Ponman T.J., Stevens I.R., 1997, A&A, 320, 378