The Radio Evolution of the Ordinary Type Ic SN 2002ap
Abstract
We report the discovery and monitoring of radio emission from the Type Ic SN 2002ap ranging in frequency from 1.43 to 22.5 GHz, and in time from 4 to 50 days after the SN explosion. As in most other radio SNe, the radio spectrum of SN 2002ap shows evidence for absorption at low frequencies, usually attributed to synchrotron self-absorption or free-free absorption. While it is difficult to discriminate between these two processes based on a goodness-of-fit, the unabsorbed emission in the free-free model requires an unreasonably large ejecta energy. Therefore, on physical grounds we favor the synchrotron self-absorption (SSA) model. In the SSA framework, at about day 2, the shock speed is , the energy in relativistic electrons and magnetic fields is erg and the inferred progenitor mass loss rate is M⊙/yr (assuming a km sec-1 wind). These properties are consistent with a model in which the outer, high velocity supernova ejecta interact with the progenitor wind. The amount of relativistic ejecta in this model is small, so that the presence of broad lines in the spectrum of a Type Ib/c supernova, as observed in SN 2002ap, is not a reliable indicator of a connection to relativistic ejecta and hence -ray emission.
Subject headings:
radio continuum:supernovae—supernovae:individual(SN 2002ap)—stars:circumstellar matter—gamma rays:bursts1. Introduction
Type Ib/c supernovae (SNe) enjoyed a broadening in interest over the last few years since their compact progenitors (Helium or Carbon stars) are ideal for detecting the signatures of a central engine. Such an engine is expected in the collapsar model (Woosley 1993; MacFadyen, Woosley & Heger 2001), the currently popular model for long-duration -ray bursts (GRBs). In this model, the engine (a rotating and accreting black hole) provides the dominant source of explosive power. The absence of an extensive Hydrogen envelope in the progenitor star may allow the jets from the central engine to propagate to the surface and subsequently power bursts of -rays.
Separately, the Type Ic SN 1998bw (Galama et al. 1998) found in the localization region of GRB 980425 (Pian et al. 2000) ignited interest in “hypernovae”111There is no accepted definition for a hypernova. Here we use the term to mean a supernova with an explosion energy significantly larger than erg.. Regardless of the controversy over the association of SN 1998bw with GRB 980425, or equivalently, the controversy over the relation of the extremely underluminous GRB 980425 to the cosmological GRBs, one fact is not in dispute: SN 1998bw is a most interesting SN. First, the SN exhibited the broadest absorption lines to date, about 60,000 km sec-1 (Iwamoto et al. 1998; Woosley, Eastman & Schmidt 1999). Second, modeling of the optical spectra and lightcurves suggested a large energy release, , where is the SN energy release in units of erg. Finally, and most relevant to the issue of GRB connection, the SN was the brightest radio SN at early times; robust equipartition arguments led to an inferred energy of erg in ejecta with relativistic velocities, few (Kulkarni et al. 1998, hereafter K98). Until SN 1998bw, no other SN showed hints of such an abundance of relativistic ejecta. Tan, Matzner & McKee (2001) explain the relativistic ejecta as resulting from an energetic shock as it speeds up the steep density gradient of the progenitor. The -ray and radio emission would then arise in the forward shock.
From the perspective of a GRB–SN connection, what matters most is the presence of relativistic ejecta. -ray emission traces ultra-relativistic ejecta, but as was dramatically demonstrated by SN 1998bw, the radio serves as an equally good proxy for relativistic ejecta with the added advantage that the emission is not beamed. Given this, we began a systematic program of investigating at radio wavelengths all Ib/c SNe with features similar to SN 1998bw: a hypernova or broad optical lines.
Y. Hirose discovered SN 2002ap in M74 (distance, Mpc; Smartt et al. 2002) on 2002, Jan. 29.40 UT (see Nakano 2002). Mazzali et al. (2002) inferred an explosion date of 2002, Jan. UT. Attracted by the broad spectral features (e.g. Kinugasa et al. 2002; Meikle et al. 2002) we began observing the SN at the Very Large Array (VLA222The VLA is operated by the National Radio Astronomy Observatory, a facility of the National Science Foundation operated under cooperative agreement by Associated Universities, Inc.).
2. Observations
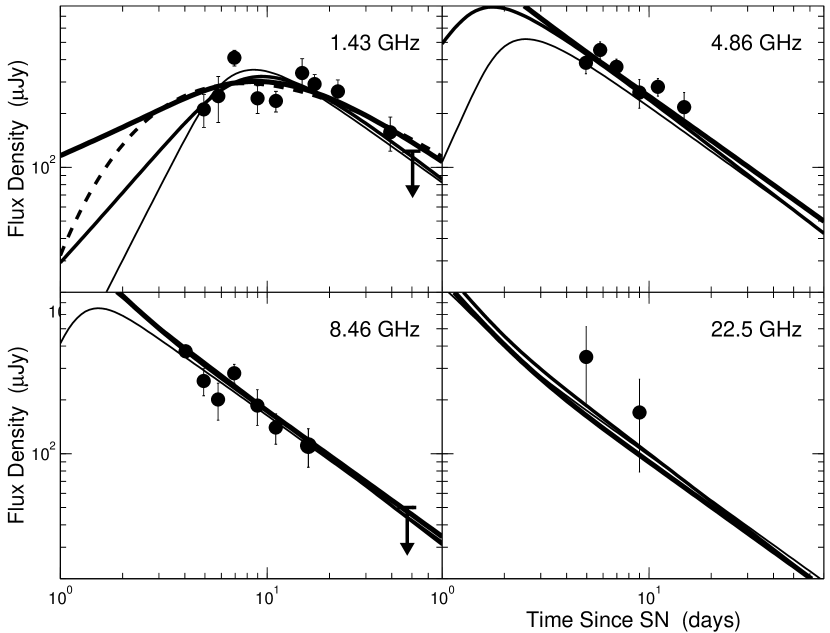
We observed SN 2002ap starting on 2002, February 1.03 UT. and detected a radio source coincident with the optical position at (J2000)= 01h36m23.92s, (J2000)=, with a 1- uncertainty of 0.1 arcsec in each coordinate (Berger et al. 2002a). A log of the monitoring observations and the resulting lightcurves can be found in Tab. 1 and Fig. 1, respectively.
2.1. The Radio Spectrum of SN 2002ap
The peak radio luminosity of SN 2002ap, erg sec-1 Hz-1, is a factor of 20 lower than the typical Ib/c SNe (Weiler et al. 1998), and times lower than SN 1998bw (K98). The time at which the radio emission peaks at 5 GHz is day, which may be compared with 10 days for SN 1998bw (K98), and 10–30 days for the typical Ib/c SNe (Weiler et al. 1998; Chevalier 1998, hereafter C98).
The spectral index between 1.43 and 4.86 GHz, , changes from before day 6, to at days (), while holds steady at a value of . This indicates that the spectral peak, , is initially located between 1.43 and 4.86 GHz, and decreases with time. This peak could be due to synchrotron self-absorption (SSA) or (predominantly) free-free absorption (FFA) arising in the circumstellar medium (CSM). Regardless of the dominant source of opacity, the emission for frequencies is from optically-thin synchrotron emission.
Massive stars lose matter via strong stellar winds throughout their life and as a result their CSM is inhomogeneous with density, . Here, is the distance from the star, is the rate of mass loss, and is the wind speed, which is comparable to the escape velocity from the star. The progenitors of Type II SNe are giant stars which have low km s-1. Consequently the CSM is dense and this explains why the FFA model has provided good fits to Type II SNe (e.g. Weiler, Panagia & Montes 2001).
On the other hand, the progenitors of Type Ib and Ic SNe are compact Helium and Carbon stars which have high escape velocities and therefore fast winds km sec-1. Thus, a priori, the CSM density is not expected to be high. C98 reviews the modeling of radio lightcurves of Ib/c SNe and concludes that there is little need to invoke free-free absorption. However, synchrotron self absorption is an inescapable source of opacity and must be included in the modeling of Type Ib/c SNe (C98; K98).
Low frequency observations provide the simplest way to discriminate between the two models. In the SSA model, the peak frequency is identified with the synchrotron-self absorption frequency, , and . In the FFA model, the free-free optical depth is unity at the peak frequency, and decreases exponentially. Lacking the requisite discriminatory low frequency data we consider both models.
2.2. Robust Constraints
Before performing a detailed analysis, we derive some general constraints using the well-established equipartition arguments (Readhead 1994; K98). The energy of a synchrotron source with flux density, , can be expressed in terms of the equipartition energy density, , where , as, and erg.
At about day 7, mJy (see Fig. 1). Thus, as, or cm. The resulting equipartition energy is erg, the magnetic field is G, and the average velocity of the ejecta is as inferred above. We note that any other source of opacity (e.g. free-free absorption) would serve to increase , , and .
3. A Synchrotron Self-Absorption Model
The synchrotron spectrum from a source with power-law electron distribution, for (§2.1) is
| (1) |
where the optical depth at frequency is given by
| (2) |
and
| (3) |
see Li & Chevalier (1999; hereafter LC99). Here (see Rybicki & Lightman 1979), and is the characteristic synchrotron frequency of electrons with . The subscript zero indicates quantities at a reference frequency which we set to 1 GHz. Finally, is defined by the equation .
The evolution of the synchrotron emission depends on a number of parameters. Following C98, we assume that , and the fraction of energy in electrons () and magnetic fields () in the post-shock region remain constant with time; unless otherwise stated, . The evolution of the synchrotron spectrum is sensitive to the expansion radius of the forward shock front, , which is related to the density structure of the shocked ejecta and that of the CSM. We allow for these hydrodynamic uncertainties by letting and , where is the time days since the SN explosion. In the model adopted here, both these indices depend on and . It can be shown that the temporal index of the optically thin flux, . The synchrotron characteristic frequency, , is particularly useful for inferring the CSM density, and we parametrize it as GHz where GHz. For typical values of , and , .
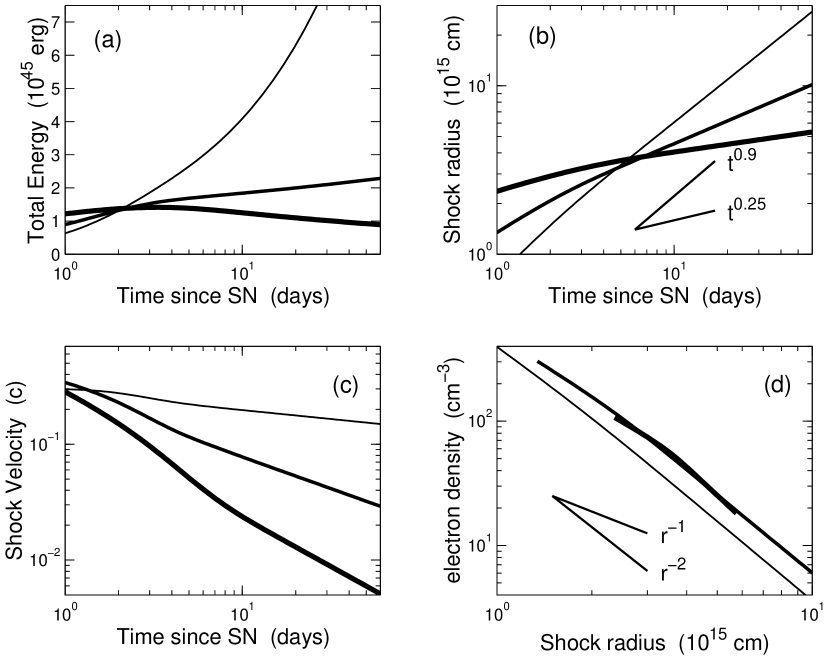
With these scalings and Eqs. 1–3 we carry a least-squares fit to the data. Given the lack of early optically-thick data (i.e. 1.43 GHz) it is not surprising that our least-squares analysis allows a broad range of values for . In Fig. 1 we plot fits spanning the minimum : (corresponding to , respectively and 21 degrees of freedom). We note that for other Ib/c SNe range from to (C98; LC99).
The fits, in conjunction with Eqs. 13–15 of LC99 allow us to trace the evolution of the size of the expanding blastwave (), the total (magnetic+electrons) energy (), and the electron density () in the shock (Fig. 2). We find that for , i.e. the blastwave decelerates. However, provides the expected . Adopting this physically reasonable model, we obtain: , Jy, and . From Fig. 2 we note that the early shock velocity is high, , regardless of the choice of , and close to that derived from the simple equipartition arguments (§2.2).
A simple extrapolation of our model, with a cooling break between the radio and X-ray bands (as expected from the value of inferred in §2.2) yields an X-ray flux comparable to the measurement by XMM-Newton on 2002, Feb 3, erg cm-2 sec-1 (Rodriguez Pascual et al. 2002; Soria & Kong 2002). In addition, the hardness ratio of the X-ray emission is consistent at the level with inferred from the radio data. Thus X-ray emission due to other mechanisms (e.g. thermal brehmsstrahlung) must be quite small.
The mass loss rate of the progenitor star is estimated from and , M⊙ yr-1, where the compression factor is , the nucleon-to-electron ratio is taken to be 2 and km sec-1. Knowing and our assumed we find Hz and thus yr-1 – similar to that inferred for SN 1998bw (LC99).
There are two consistency checks. First, with this , free-free absorption is negligible. Second, the kinetic energy of the swept-up material is erg – consistent with our estimate of the equipartition energy and .
3.1. The SSA Model in the Context of a Hydrodynamic Model
The results of §3 can be tied in to a fairly simple hydrodynamic model. Matzner & McKee (1999) show that for the progenitors of Ib/c SNe (compact stars with radiative envelopes) the ejecta post-explosion density profile can be described by power laws at low and high velocities, separated by a break velocity, km sec-1; where the mass of the ejecta is . We use and for SN 2002ap (Mazzali et al. 2002). At , the density profile is given by g cm-3. This profile extends until radiative losses become important when the shock front breaks out of the star. Using Eq. 32 of Matzner & McKee (1999) this happens for (assuming a typical 1 R⊙ radius for the progenitor star). Thus, the outflow can become relativistic.
Using the self-similar solution of Chevalier (1982) the velocity of the outer shock radius, , (assuming a CSM) is
| (4) |
where . The shock velocity, is insensitive to the circumstellar wind density. Thus, we find that the velocities inferred from the radio observations of SN 2002ap can be naturally accounted for by the outer supernova ejecta.
The energy above some velocity is
| (5) |
where is the velocity in units of . For the preferred SN 2002ap parameters, erg. There is therefore plenty of energy in the high velocity ejecta to account for the observed radio emission.
Indeed, given the over-abundance of relative to the energy inferred from the radio emission, we wonder how secure the are the estimates of and of Mazzali et al. (2002). In particular, and are derived from early time optical observations and are certainly subject to asymmetries in the explosion. For SN 1998bw, the asymmetric model of Höflich, Wheeler & Wang (1999) yielded , an order of magnitude smaller than that obtained from symmetrical models (e.g. Iwamoto et al. 1998).
3.2. Interstellar Scattering & Scintillation
Interstellar scattering and scintillation (ISS) is expected for radio SNe (see K98). Indeed, the perceptible random deviations from the model curves (see Fig. 1), which account for the high could arise from ISS.
We compute the ISS variability, specifically the modulation index (the ratio of the rms to the mean) of the observed flux, using the ISS model of Goodman (1997). Along the direction to SN 2002ap using the Galactic free electron model of Taylor & Cordes (1993) we find a scattering measure, m-20/3 kpc and the distance to the scattering screen of kpc.
For radio SNe there are two basic regimes of interest separated by the so-called transition frequency, . For , the weak scattering regime, the modulation index is [for smaller than the Fresnel size, as] and otherwise. For , the strong (refractive) scattering regime, [for , where is the Fresnel size at ], and otherwise.
For SN 2002ap we find GHz. From Fig. 2 the source angular diameter, over the period 5–20 days, is as, from which we estimate the following values: , , and .
We estimate the actual modulation index empirically by adding in quadrature to each measurement error so that the reduced is unity. Here is the model flux described in §3. We find , , and , in good agreement with the theoretical estimates. This provides an independent confirmation of the size, and hence expansion velocity of the ejecta.
4. A Free-Free Absorption Model
In this model, the spectrum is parametrized as (Chevalier 1984; Weiler et al. 1986):
| (6) |
where GHz. We find an acceptable fit ( for degrees of freedom) yielding: mJy, , , , and . With these parameters and Eq. 16 of Weiler et al. 1986) we find M⊙ yr-1 for km sec-1.
In this model, one day after the explosion GHz, and mJy (Fig. 1). The unabsorbed flux at the peak of the synchrotron spectrum is mJy (note in the FFA model) for which cm. Thus , which corresponds to if relativistic effects are taken into account (R. Sari priv. comm.). Alternatively, if we fix the expansion velocity to the optical value, km sec-1 (Mazzali et al. 2002), we find a brightness temperature, K — clearly in excess of the equipartition temperature, again necessitating a high bulk Lorentz factor, .
Thus, even if (in which case free-free opacity would not be necessary in the first place), the FFA model requires truly relativistic ejecta, or alternatively a large departure from equipartition, resulting in erg (for instead of ). Clearly, the energy requirement would increase by many orders of magnitude if .
5. Discussion and Conclusions
The type Ic SN 1998bw, likely associated with GRB 980425, was peculiar in two ways. It exhibited broad photospheric absorption lines, and exceedingly strong radio emission at early times. The latter was interpreted to arise from relativistic ( few) ejecta of total energy erg. These two peculiarities made sense in that the simple theory suggested that broad photospheric features are a reliable indicator of relativistic ejecta, a necessary condition for -ray emission.
The type Ic SN 2002ap elicited much interest because it too displayed similar broad lines. However, from our radio observations we estimate the energy in relativistic electrons and magnetic fields to be quite modest: ergs in ejecta with a velocity . In view of this, the absence of -rays from SN 2002ap is not surprising (Hurley et al. 2002). Both the energy and speed of the ejecta can be accounted for in the standard hydrodynamical model. We thus conclude that broad photospheric lines are not good predictors of relativistic ejecta.
Separately, the broad photospheric features led modelers to conclude that SN 2002ap was a hypernova with an explosion energy of erg (Mazzali et al. 2002). However, the radio observations paint a different picture. The low make SN 2002ap an ordinary Type Ib/c SN (or perhaps even a low energy event; §2.1). We also draw attention to the significant role played by asymmetries in forming the optical lines which, when not properly accounted for can lead to discrepant estimates (cf. the large variations in the estimated SN energy release for SN 1998bw; see Höflich, Wheeler & Wang 1999; Iwamoto et al. 1998). Thus, we wonder how reliable are the inferred and values. Along the same vein, we note that Kawabata et al. (2002) suggest, based on spectro-polarimetric observations, a jet with a speed of and carrying erg. Such a jet, regardless of geometry, would have produced copious radio emission.
We end with three conclusions. First, at least from the perspective of relativisic ejecta, SN 2002ap was an ordinary Ib/c SN. Second, broad photospheric lines appear not to be a good proxy for either an hypernova origin or -ray emission. Third, radio observations offer a practical and accurate proxy for relativistic ejecta.
References
- Berger, Kulkarni, & Frail (2002) Berger, E., Kulkarni, S. R., & Frail, D. A. 2002, GCN 1237.
- Chevalier (1982) Chevalier, R. A. 1982, ApJ, 258, 790.
- Chevalier (1984) Chevalier, R. A. 1984, ApJ, 285, L63.
- Chevalier (1998) Chevalier, R. A. 1998, ApJ, 499, 810. (C98)
- Galama, et al. (1999) Galama, T. J., et al. 1998, Nature, 395, 670.
- Goodman (1997) Goodman, J. 1997, New Astron., 2, 449.
- Höflich, Wheeler & Wang (1999) Höflich, P., Craig, W. J. & Wang, L. 1999, ApJ, 521, 179
- Hurley et al. (2002) Hurley, K., et al. 2002, GCN 1252.
- Iwamoto, et al. (1998) Iwamoto, K., et al. 1998, Nature, 395, 672.
- Kawabata et al. (2002) Kawabata, K. S., Jeffery, D. J., Iye, M. et al. 2002, astro-ph/0205414
- Kinugasa et al. (2002) Kinugasa, K., Kawakita, H., Ayani, K., Kawabata, T. & Yamaoka, H. 2002, IAUC, 7810
- Kulkarni et al. (1998) Kulkarni, S. R., et al. 1998, Nature, 395, 663. (K98)
- Li & Chevalier (1999) Li, Z.-H., & Chevalier, R. A. 1999, ApJ, 526, 716. (LC99)
- MacFadyen & Woosley (1999) MacFadyen, A. I., & Woosley, S. E. 1999, ApJ, 524, 262.
- MacFadyen, Woosley, & Heger (2001) MacFadyen, A. I., Woosley, S. E., & Heger, A. 2001, ApJ, 550, 410.
- Matzner & McKee (1999) Matzner, C.D. & McKee, C. F. 1999, ApJ, 526, L109
- Mazzali, et al. (2002) Mazzali, P. A., et al. 2002, ApJ, 572, L61.
- Meikle et al. (2002) Meikle, P., Lucy, L., Smartt, S., Leibundgut, B., Lundqvist, P. & Ostensen, R. 2002, IAUC, 7811
- Nakano (2002) Nakano, S. 2002, IAUC, 7810
- Pian et al. (2000) Pian, E., et al. 2000, ApJ, 536, 778.
- Readhead (1994) Readhead, A. C. S. 1994, ApJ, 426, 51.
- Rodriguez Pascual et al. (2002) Rodriguez Pascual, P., et al. 2002, IAUC 7821.
- Rybicki & Lightman (1979) Rybicki, G. B., & Lightman, A. P. 1979, Radiative Processes in Astrophysics (New York; Wiley).
- Schmidt (2001) Schmidt, M. 2001, ApJ, 552, 36.
- Soria & Kong (2002) Soria, R., & Kong, A. K. H. 2002, ApJ, 572, L33.
- Tan, Matzner, & McKee (2001) Tan, J. C., Matzner, C. D., & McKee, C. F. 2001, ApJ, 551, 946.
- Taylor & Cordes (1993) Taylor, J. H., & Cordes, J. M. 1993, ApJ, 411, 674.
- Weiler et al. (1986) Weiler, K. W., et al. 1986, ApJ, 301, 790.
- Weiler et al. (1998) Weiler, K. W., et al. 1998, ApJ, 500, 51.
- Weiler, Panagia, & Montes (2001) Weiler, K. W., Panagia, N., & Montes, M. J. 2001, ApJ, 562, 670.
- Smartt et al. (2002) Smartt, S. J., Vreeswijk, P. M., Ramirez-Ruiz, E., Gilmore, G. F., Meikle, W. P. S., Ferguson, A. M. N. & Knapen, J. H. 2002, ApJ, 572, L147
- Woosley (1993) Woosley, S. E. 1993, ApJ, 405, 273.
- Woosley, Eastman, & Schmidt (1999) Woosley, S. E., Eastman, R. G., & Schmidt, B. P. 1999, ApJ, 516, 788.
| Epoch | ||||
|---|---|---|---|---|
| (UT) | (Jy) | (Jy) | (Jy) | (Jy) |
| 2002 Feb 1.03 | ||||
| 2002 Feb 1.93 | ||||
| 2002 Feb 2.79 | ||||
| 2002 Feb 3.93 | ||||
| 2002 Feb 5.96 | ||||
| 2002 Feb 8.00 | ||||
| 2002 Feb 11.76 | ||||
| 2002 Feb 13.94 | ||||
| 2002 Feb 18.95 | ||||
| 2002 Mar 4.85+11.83 | ||||
| 2002 Mar 18.77+19.97 |
Note. — The columns are (left to right), (1) UT date of each observation, and flux density and rms noise at (2) 1.43 GHz, (3) 4.86 GHz, (4) 8.46 GHz, and (5) 22.5 GHz. Observations with more than one date have been co-added to increase the signal-to-noise of the detection.