Resolved and unresolved populations: statistics and synthesis models
Abstract
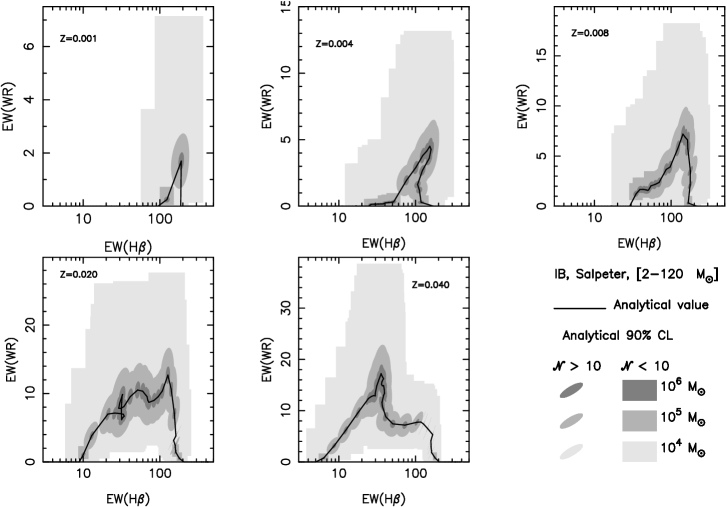
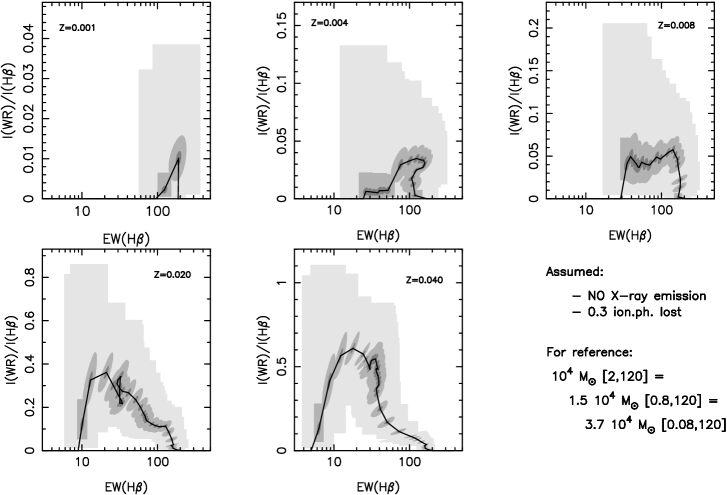
In this contribution, I present the 90% confidence limits on the diagnostic diagrams of EW(WR bump) and L(WR bump)/L(H) ratio vs. EW(H) resulting from evolutionary synthesis models that include the statistical dispersion due to finite stellar populations in real star forming regions.
LAEFF (INTA), Apdo. 50727, 28080 Madrid, Spain
IAA (CSIC), Camino Bajo de Huétor 24, 18080 Granada, Spain
1. Introduction
Evolutionary synthesis models have been traditionally used to study the physical properties of unresolved populations, but they should also be able to reproduce the integrated properties of resolved ones. In both cases the discreteness of the stellar populations must be taken into account and model results must be interpreted in a statistical way, i.e. model outputs are a mean value of a probability distribution with an intrinsic dispersion. Such dispersion must be taken into account in the interpretation of the data and it is especially important when the number of observed stars is small (where the definition of “small” depends on the observable), or in the analysis of surveys.
Especially relevant is the use of diagnostic diagrams, that are, virtually, independent on the mass/number of stars in the system. I show in Fig 1 the 90% confidence limits (CL) for the EW(WR bump) and L(WR bump)/L(H) ratios vs. EW(H) for different amount of mass transformed into stars for evolutionary tracks with standard mass-loss rates and different metallicities111Dispersion data values taken from Cerviño et al. (2002), available at http://www.laeff.esa.es/users/mcs/SED.. The plots show the 90% CL in the results arising from the dispersion in both axes and the correlation coefficients between them; the (Gaussian) covariance ellipses correspond to an effective number of stars larger than 10, , and the rectangular boxes delimit the uncertainty region for .
References
Cerviño, M., Valls-Gabaud, D., Luridiana, V., & Mas-Hesse, J.M. 2002, A&A381, 51