High resolution spatial and timing observations of
millisecond pulsar PSR J02184232 with Chandra
Abstract
We report on high-resolution spatial and timing results for binary millisecond pulsar PSR J02184232 obtained with the Chandra HRC-I and HRC-S in imaging mode. The sub-arcsecond resolution image of the HRC-I (0.08-10 keV) showed that the X-ray emission from PSR J02184232 is consistent with that of a point source excluding the presence of a compact nebula with a size of about for which we had indications in ROSAT HRI data. The presence of a DC component is confirmed. This X-ray DC component has a softer spectrum than the pulsed emission and can be explained by emission from a heated polar cap. With our HRC-S observation we obtained a 0.08-10 keV pulse profile with high statistics showing the well-known double peaked morphology in more detail than before: The two pulses have broad wings and pulsed emission appears only to be absent in a narrow phase window of width . The absolute timing accuracy of s makes it possible to compare for the first time in absolute phase the X-ray pulse profile with the highly structured radio profile and the high-energy -ray profile (0.1-1 GeV). The two X-ray pulses are aligned within absolute timing uncertainties with two of the three radio pulses. Furthermore, the two -ray pulses are aligned with the two non-thermal X-ray pulses, corresponding to a probability for a random occurrence of 4.9, strengthening the credibility of the earlier reported first detection of pulsed high-energy -ray emission from a (this) millisecond pulsar.
1 Introduction

PSR J02184232 is a 2.3 ms pulsar in a two day orbit around a low mass ( M☉) white dwarf companion (Navarro et al., 1995; van Kerkwijk, 1997). Pulsed X-ray emission with a Crab-like double pulse profile has been reported from ROSAT 0.1-2.4 keV data (Kuiper et al., 1998a) and BeppoSAX MECS 1.6-10 keV data (Mineo et al., 2000). The pulsed spectrum as measured by the MECS appeared to be remarkably hard with a power-law photon index , harder than measured for any other radio pulsar. Furthermore, Kuiper et al. (2000) report the detection with EGRET of pulsed high-energy (0.1-1 GeV) -ray emission from this ms pulsar. Their argument is based on three lines of evidence: (1) the 0.1-1 GeV data show a 3.5 pulsation at the radio period; (2) the -ray light curve resembles the one seen in hard X-rays, namely a phase separation of 0.45 between two pulses/maxima; (3) the spatial analysis shows that the position of the EGRET source 3EG J0222+4253 moves from the position of the nearby BL Lac 3C 66A towards the pulsar position with decreasing gamma-ray energy (for energies between 100 and 300 MeV all source counts could be attributed to PSR J0218+4232). They also showed that the two -ray pulses/maxima appeared to be aligned in absolute phase with two of the three radio pulses detected at 610 MHz. Unfortunately, the timing accuracies of the ROSAT and BeppoSAX observations were insufficient to construct X-ray profiles in absolute phase. None of the current models for pulsed X-ray and -ray emission from radio pulsars offers a consistent explanation for the above summarized high-energy results on PSR J02184232 (Kuiper et al., 2000).
PSR J02184232 is also remarkable in that it is the only Crab-like ms pulsar with a large DC (unpulsed) fraction of in the ROSAT band below 2.4 keV (Kuiper et al., 1998a), as well as a large DC fraction of in radio, systematically over the range 100-1400 MHz (Navarro et al., 1995). The DC components as measured in the ROSAT and radio observations could be explained by emission from a compact nebula with diameter , but in both cases the indications were at the limit of the imaging capabilities. Assuming that the radio DC component is compact, combined with the measured very broad and structured radio pulse profile, Navarro et al. (1995) suggested that the magnetic field of PSR J02184232 is almost aligned with the rotation axis, the observer viewing the system under a small angle with respect to the rotation axis. Stairs et al. (1999) measured the magnetic inclination angle analyzing radio polarization profiles. Their rotation vector model fits indicate that the magnetic inclination angle is indeed consistent with (). Unfortunately, in their fits the line-of-sight inclination is unconstrained. If the DC component in X-rays is also compact, for the suggested geometry of a nearly aligned rotator and a small viewing angle, it can originate in the pulsar magnetosphere as well as from a heated polar cap of the neutron star.
The objectives of our Chandra observations were: 1) To establish the spatial extent of the X-ray DC component, compact or extended; 2) To construct an X-ray pulse profile which can be compared in absolute phase with radio profiles and the 3.5 EGRET high-energy (0.1-1 GeV) -ray profile.
2 Observations
![[Uncaptioned image]](/html/astro-ph/0206081/assets/x3.png) Figure 2: Pulse-profile of PSR J02184232 as measured by the HRC-S in imaging
mode. Two cycles are shown for clarity. Typical error bars
are shown at phases 0.35 and 0.7.
The DC-level () is indicated by the hatched area, and the
background level from the imaging analysis
by the dashed line.
Figure 2: Pulse-profile of PSR J02184232 as measured by the HRC-S in imaging
mode. Two cycles are shown for clarity. Typical error bars
are shown at phases 0.35 and 0.7.
The DC-level () is indicated by the hatched area, and the
background level from the imaging analysis
by the dashed line.
PSR J02184232 was observed with the HRC-I and HRC-S instruments on the Chandra X-ray observatory (CXO) during two observations of ks duration each. The HRCs are multi-channel plate (MCP) detectors sensitive to X-rays in the 0.08-10 keV energy range with no spectral information.
The first observation with the HRC-I camera at the focal plane of the telescope mirror took place on 1999 December 22 for an effective exposure of 74.11 ks. Unfortunately, this observation suffered from a non-recoverable timing (“wiring”) problem assigning incorrectly the event trigger time to that of the next trigger (Tennant et al., 2001). On-board event screening prevents recovering the true event times of all the triggers in the telemetry stream by simple back-shifting. The timing accuracy in this case is determined by the total event rate, typically 300-400 s-1, and is much worse than the s intrinsic timing resolution. This degradation prevents the construction of high-resolution pulse profiles in case of millisecond pulsars.
In a re-observation of PSR J02184232 on 2000 October 5 for an effective exposure of 73.21 ks with the HRC-S in imaging mode (using only the central MCP segment) all event triggers could be put in the telemetry stream, so that back-shifting recovers the intrinsic timing accuracy.
3 Spatial Analysis with HRC-I
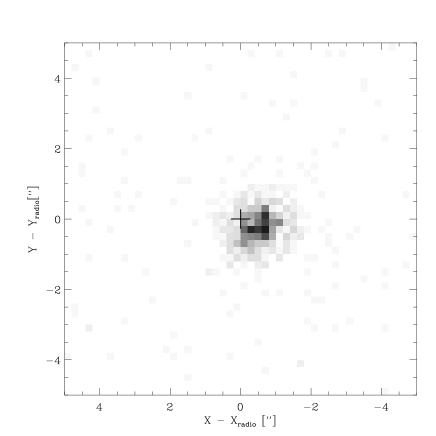
PSR J02184232 has clearly been detected near the centre of the field of view in the 74.11 ks HRC-I observation. Within from the pulsar 51 X-ray sources have been detected, some of them have counterparts in our previous ROSAT HRI (0.1-2.4 keV) and BeppoSAX MECS (1.6-10 keV) observations (Kuiper et al., 1998a; Mineo et al., 2000). The central part of the X-ray image containing PSR J02184232 has also been observed at optical wavelengths by the Keck telescope (van Kerkwijk, 2001) and it turns out that all central sources except one have optical counterparts. Relative astrometry demonstrates that the Chandra positions are accurate to within , better than the celestial localization accuracy determination requirement of . Using the standard Level 1 event file provided by the CXC pipeline analysis (this file contains all HRC triggers with the position information corrected for instrumental (de-gap) and aspect (dither) effects), a zoom-in at the pulsar location (Fig. 1 left) shows that the X-ray centroid has a offset from the radio-pulsar position of , (epoch J2000) consistent with our previous findings. It is also evident from the image shown in Fig. 1 (left) that the source events are concentrated within a circle with a radius of from the X-ray centroid. A more quantitative estimate involves maximum likelihood fitting of the measured 2D spatial distribution with a model composed of a Gaussian and a generalized Lorentzian with free shape parameters, normalization and centroid position on top of an (assumed) flat background, also with free scale factor. The optimum X-ray centroid position is , (epoch J2000) while the radial profile of the best model fit is compatible with the PSF of the HRMA/HRC-I combination (95% of the source counts are within from the X-ray centroid). Fig. 1 (right) shows the best model profile (dotted line) superposed on the measured radial profile using the optimum X-ray centroid position as centre. Thus, we have no evidence for extended emission near PSR J02184232 at scales (diameter), rejecting the indication for a compact nebula found in our analysis of ROSAT HRI data (Kuiper et al., 1998a).
The total number of counts assigned to the pulsar from the maximum likelihood fit is , which translates in a count rate of . Assuming absorption in a column with density cm -2 (Verbunt et al., 1996) and a photon power-law index of (Mineo et al., 2000) the count rate converts to a 2-10 keV flux of erg cm-2s-1. The first error represents the statistical error and the second the systematic error due to uncertainties in the absolute sensitivity of the HRC-I and in the spectral model. The value is consistent with the BeppoSAX MECS value of erg cm-2s-1 (the first error represents the statistical uncertainty and the second error the systematic uncertainty of about 10%).
4 Timing Analysis with HRC-S
In a spatial analysis using the HRC-S Level 1 event file the X-ray centroid of the X-ray counterpart of PSR J02184232 was found to have an offset of from the radio position of the pulsar, larger than the celestial location accuracy determination requirement of ; a systematic difference noticed earlier by e.g. Wang et al. (2001). The number of counts assigned to the source, applying a similar likelihood procedure as in the case of the HRC-I image data, is . Using the optimized background scale factor and source profile, the optimum radius for event extraction (S/N optimal) from the best fit centroid turns out to be .
The first step in the timing analysis is to correct the assigned event times by back-shifting, recovering the intrinsic relative time resolution of s. Next, the event extraction radius was set to the optimum radius of . The final step is the determination of the arrival times at the solar system barycentre using the orbital information of Chandra and the position of PSR J02184232. Folding the barycentered arrival times with the spin and binary parameters from an updated ephemeris for PSR J02184232 revealed the well-known doubled peaked profile at high statistics (Fig.2). The deviation from a flat distribution is according to a - test and the peak separation is consistent with previous estimates (Kuiper et al., 1998a; Mineo et al., 2000). The peak widths (FWHM), fitting the profile in terms of two asymmetric Lorentzians atop a flat background, are: Peak-1 (at ) (s) and Peak-2 (at ) (s). Fitting two Gaussians plus background yielded similar results.
![[Uncaptioned image]](/html/astro-ph/0206081/assets/x4.png) Figure 3: Multi-wavelength pulse profiles of PSR J02184232 in absolute phase.
a) Radio pulse profile at 610 MHz. b) Chandra HRC-S
X-ray pulse profile (0.08-10 keV; timing accuracy s or
in phase) and c) EGRET -ray pulse profile
(0.1-1 GeV; timing accuracy s or in phase).
The absolute timing accuracies of the X- and -ray profiles
are shown as horizontal bars centered on phase 0.62.
Indicated as dotted lines are the positions of the 2 pulses in
the 610 MHz radio profile which coincide with the high-energy pulses.
Typical error bars are indicated in the X- and
-ray profiles. Note that the background level in the -ray profile
as determined from an imaging analysis is at (Kuiper et al., 2000).
Figure 3: Multi-wavelength pulse profiles of PSR J02184232 in absolute phase.
a) Radio pulse profile at 610 MHz. b) Chandra HRC-S
X-ray pulse profile (0.08-10 keV; timing accuracy s or
in phase) and c) EGRET -ray pulse profile
(0.1-1 GeV; timing accuracy s or in phase).
The absolute timing accuracies of the X- and -ray profiles
are shown as horizontal bars centered on phase 0.62.
Indicated as dotted lines are the positions of the 2 pulses in
the 610 MHz radio profile which coincide with the high-energy pulses.
Typical error bars are indicated in the X- and
-ray profiles. Note that the background level in the -ray profile
as determined from an imaging analysis is at (Kuiper et al., 2000).
In Fig.2 is indicated an estimate for the unpulsed (DC) level () using a bootstrap method outlined by Swanepoel et al. (1996). Furthermore, the background level estimated in the maximum likelihood imaging analysis is also shown, giving a number of background counts within the extraction radius of . The pointlike (see Sect. 3) DC (unpulsed) component, significantly detected with ROSAT (0.1-2.4 keV; ) by Kuiper et al. (1998a) and weakly with BeppoSAX (1.6-4.0 keV; ) by Mineo et al. (2000) is clearly seen in this 0.08-10 keV profile. The pulsed fraction defined as , where specifies the number of pulsed source counts and the number of DC source counts, turns out to be as measured by CXO HRC-S over the entire 0.08-10 keV energy range.
| Parameter | Value |
|---|---|
| Right Ascension (J2000) | 02h 18m 6351 |
| Declination (J2000) | 42∘ 1745 |
| Epoch validity start/end (MJD) | 49092 – 51462 |
| Frequency | 430.4610670731491 Hz |
| Frequency derivative | Hz s-1 |
| Epoch of the period (MJD) | 50277.000000025 |
| Orbital period | 175292.302218 s |
| a sin i | 1.9844301 (lt-s) |
| Eccentricity | 0 |
| Longitude of periastron | 0 |
| Time of ascending node (MJD) | 50276.61839862 |
| RMS of timing solution | 14.4 milliperiods; 33.4 s |
Finally, our CXO HRC-S 0.08-10 keV X-ray pulse profile can directly be compared in absolute phase with our previously derived radio and -ray profiles (Kuiper et al., 2000). Firstly, because we generated an ephemeris valid for all used observation periods and applied a common reference epoch (see Table 1), and secondly, the absolute timing accuracy of CXO is within s (Tennant et al., 2001) which corresponds to a phase inaccuracy smaller than given the pulse period of ms. Fig. 3 shows then for the first time the comparison of a PSR J02184232 X-ray profile in absolute phase with the radio and -ray profiles. Within the uncertainties of each of the measurements the X-ray pulses are aligned with two of the three radio pulses at 610 MHz and with the -ray pulses.
5 Chandra HRC-S X-ray pulse profile vs. EGRET high-energy -ray profile
The alignment in absolute phase of the very-hard X-ray pulses with the low-significance -ray pulses is particularly interesting. The calculated 3.5 significance of the -ray profile was derived for unbinned data giving the statistical evidence ( - test) for deviations from a flat distribution anywhere in pulsar phase. When we calculate the significance of detection of the two -ray pulses at the known absolute phases of the X-ray pulses (e.g. by determining the pulsed excess counts in the narrow pulse phase windows – and – , considering the remaining phase windows (65%) as background; we found pulsed excess counts) then we derive for this single trial an increased total significance of 4.0.
In fact, we performed simulations similar to what we did earlier for PSR B195132 (Kuiper et al., 1998b): We simulated flat phase distributions with the same number of counts () as contained in the EGRET 0.1-1 GeV phase histogram shown in Fig. 3c. Then we applied the - test and verified first that the distribution of the simulations behaved as expected for a random distribution (with trials we could calibrate well up to ). Next, we used again the two narrow pulse phase windows – and – to determine the pulsed excess counts. Fig. 4 shows in a two-dimensional distribution all simulations with a - significance above 3 versus the measured pulsed excess counts in the pre-defined pulse windows. As can be seen, only for one simulation out of a significance above 3.5 and pulsed excess counts above 55 was reached. This corresponds to a statistical significance of 4.9. Therefore, we take the alignment in absolute phase of the non-thermal X-ray and -ray pulses as supporting evidence for our first detection of high-energy -rays from a millisecond pulsar.
6 Spectral analysis
![[Uncaptioned image]](/html/astro-ph/0206081/assets/x5.png) Figure 4: Scatter plot of pulsed excess counts vs. for background simulations.
The hatched band indicates the parameter space of interest, namely, to detect by chance
a signal with a modulation signifcance above and more than 55
pulsed excess counts in the pulse phase windows – and –
(representative for the 0.1-1 GeV -ray profile). We found just one occurrence in
trials, corresponding to a statistical significance of .
Figure 4: Scatter plot of pulsed excess counts vs. for background simulations.
The hatched band indicates the parameter space of interest, namely, to detect by chance
a signal with a modulation signifcance above and more than 55
pulsed excess counts in the pulse phase windows – and –
(representative for the 0.1-1 GeV -ray profile). We found just one occurrence in
trials, corresponding to a statistical significance of .
In the spatial and timing analyses we derived the main results from our Chandra data, which contain very limited spectral information. Essentially, we measured the integral count rate over the entire 0.08-10 keV energy window. Therefore, we cannot add significant new information to the well-defined pulsed spectrum as measured by the BeppoSAX MECS instrument (Mineo et al., 2000). However, no meaningful information has been published sofar on the spectral shape of the DC component (crucial to decide on the origin and production mechanism), while the combined ROSAT HRI, BeppoSAX MECS and Chandra data can give a first estimate: The ROSAT HRI provides us a DC count rate for 0.1-2.4 keV, the MECS for 1.6-4 keV and 4-10 keV, and Chandra for 0.08-10 keV.
Assuming a spectral model and absorbing column N and using the instrument sensitivity curves over the different energy windows, the HRC-S DC count rate can be used to predict the ROSAT HRI and BeppoSAX MECS DC count rates.
For a black body model the measured ROSAT HRI/HRC-S rates demand a temperature kT keV; the measured BeppoSAX MECS/HRC-S rates kT ( limits). Therefore, a thermal model with a temperature kT (90% confidence interval: 0.33-1.1 keV) is consistent with all the measured DC count rates. Assuming a power-law model, the DC rates of the three instruments are consistent with power-law indices in the range 1.3-1.85 ( limits; 90% confidence interval 0.95-2.45), significantly softer than for the pulsed emission () as measured by the MECS (Mineo et al., 2000). The total statistics of the data are insufficient to discriminate between the black body and the power-law spectral shapes.
7 Discussion & Conclusions
Our first objective of the Chandra observations was to determine the spatial extent of the X-ray DC component and to find a likely explanation for its origin. As is shown in Fig. 1, no evidence for extended emission near PSR J02184232 at scales (diameter) is seen, rejecting the indication for a compact nebula found in our analysis of ROSAT HRI data (Kuiper et al., 1998a). The combined ROSAT, BeppoSAX MECS and Chandra data led us to conclude that the DC spectrum is significantly softer than the pulsed spectrum, the latter being clearly of non-thermal origin. If we adopt the geometry proposed by Navarro et al. (1995), a nearly aligned rotator and a small viewing angle, the soft DC X-ray component can be explained as thermal emission from the polar cap of the neutron star which stays visible to the observer all the time. For old millisecond pulsars the thermal emission can only originate from reheating of the polar cap area by back-flowing accelerated particles. In fact, for a ms-pulsar the polar-cap half angle () extends over a relatively large angle, e.g. for PSR J02184232 . This means that the spin-axis is well within the (magnetic) polar-cap region, for the measured angle between the spin- and magnetic axes amounts () (Stairs et al., 1999). Therefore, a small observer viewing angle to the system (angle spin-axis and line of sight) can keep the observer looking at the heated polar region continuously.
The Navarro et al. (1995) radio observations had a VLA beam size of , also allowing an interpretation of the radio DC component (reported DC fraction ) as a compact nebula up to the size of the VLA beam. No new observations have been reported with a smaller beam size, but Stairs et al. (1999) and Kuzmin & Losovsky (2001) revisited the pulsed emission. We fitted the total radio spectrum of Navarro et al. (1995) (five data points) with a power-law shape, index , and the new total pulsed radio spectrum (three data points from Navarro et al. (1995), two from Stairs et al. (1999) and one from Kuzmin & Losovsky (2001)), index . The spectra appeared identical in shape and the updated DC fraction is , significantly lower than the earlier estimate. This leads us to the conclusion that the radio DC component is most likely also compact and has the same magnetospheric origin as the pulsed emission, which has a very structured and remarkably broad profile and is indeed practically never “off”.
Our second objective was to obtain with Chandra a more significant X-ray profile than measured sofar, to study the profile structure in more detail in the X-ray band below 10 keV, and to have for the first time absolute timing, allowing multiwavelengths phase comparisons. The profile in Fig. 2 with a significance of is indeed much more significant than the MECS profile (). Now we can really see that the two pulses have broad wings and that the profile reaches the DC level only in a very narrow phase interval around phase 0.35 (phase extent ). In fact, Fig.3 shows that the radio and the X-ray profiles both reach a minimum level for approximately the same absolute phase region. Furthermore, Fig.3 shows that the X-ray pulses are aligned in absolute phase with two of the three radio pulses and the two -ray pulses within the timing uncertainties of the different measurements.
PSR J02184232 is the first and only millisecond pulsar for which we reported evidence for detection of high-energy gamma-ray emission up to 1 GeV (Kuiper et al., 2000). We take the alignment in absolute phase of the non-thermal X-ray and -ray pulses as important supporting evidence for our first detection of high-energy -rays from a millisecond pulsar. In Sect. 5 we showed that the probability that a random timing signal reaches a modulation significance and has its 55 pulsed excess counts in phase with the two X-ray pulses amounts .
Wallace et al. (2000) reported the detection of short-term variability in the high-energy -ray emission from 3EG J0222+4253 (3C66A/PSR J02184232) in a systematic search for all 170 unidentified sources in the 3rd EGRET Catalog (Hartman et al., 1999). They noted that if this flaring is due to PSR J02184232 : “It would be an unusual source in two ways: it would be the only millisecond pulsar seen by EGRET and the only pulsar to show strong flaring”. We argue, however, that in their search the reported evidence for flaring is not significant: For each of the 170 unidentified sources Wallace et al. (2000) produced light curves per viewing period (VP) with 2 day flux values each time they were in the field-of-view during a VP. For 3EG J0222+4253 (3C66A/PSR J02184232) they found the most significant evidence for variability, namely in VP15 with a variability index V=2.6, corresponding to a significance for a random detection in a single trial assuming Gaussian statistics (although Poisson statistics apply). This variability was due to one single high 2 day flux value. However, this source was viewed in 4 observations (no indication for variability in the other VPs) which makes the probability () 1% or 2.58 to find V=2.6 in 1 out of 4 observations. Furthermore, Wallace et al. (2000) analysed 144 VPs with duration larger than 3 days producing for the 170 unidentified sources few-hundred light curves, making the probability to find once V=2.6 (or one single high 2 day flux value) few times unity! They correctly noted that their Monte Carlo probabilities give misleading values (too optimistic) as the used averages having no uncertainties assigned. Also in the latter case the very large number of “trials” has been ignored. Since there was no a priori reason to select 3EG J0222+4253 for a single trial, we donot regard the indication for short-term variability of this source significant.
The X-ray results on the DC emission and the radio results on the DC and pulsed emission suggest for PSR J02184232 an emission scenario of a nearly aligned rotator and a small viewing angle. The latter angle can still be as large as to explain the X-ray DC emission if this originates from a polar-cap heated by particle bombardment. For explaining the pulse profile with two hard-spectrum X-ray/-ray peaks it is more critical to know this viewing angle to get a handle on the geometry. For both competing classes of models, polar cap models (PC; e.g. Daugherty & Harding (1994, 1996)) and outer gap models (OG; see e.g. Cheng et al. (1986a, b); Ho (1989)) production of hard X-ray/-ray emission in the magnetospheres of millisecond pulsars has been predicted (e.g. Bhattacharya & Srinivasan (1991); Sturner & Dermer (1994)). Recently, millisecond pulsars among them PSR J02184232 were considered for PC models by Dyks & Rudak (1999); Bulik & Rudak (1999); Bulik et al. (2000); Zhang & Harding (2000). For PSR J02184232 they did not succeed in reproducing the measured high-energy spectral shape. More recently, Dyks & Rudak (2002) succeeded in reproducing the high-energy spectrum of PSR J02184232, but required non-orthodox assumptions about the electron energy distribution or emission altitude as well as off-beam viewing geometry. Woźna et al. (2002) reproduced the double-peak profile with the measured phase separation for a small inclination angle of and a viewing angle of (angles approximately consistent with our findings). However, for these angles the spectrum reached its maximum luminosity for too high energies around 100 GeV. The fact that in the case of PC models a double-peak hard X-ray/-ray profile can be modelled for a nearly aligned rotator with a viewing angle follows already from Daugherty & Harding (1996), who showed that the -ray beam produced at the polar cap rim is relatively wide, amounting () for PSR J02184232. For emission produced at higher altitudes in the magnetosphere (as is proposed in the more recent versions of PC models), the beam will become even wider. In all these discussions the real viewing angle in combination with the inclination angle determines whether the measured double peak profile can be obtained. Also for OG models a double peak profile is in principle possible, depending on the actual viewing angle and which part of the outer gap (in altitude) is visible to the observer. For OG models the hard X-ray/-ray cone might become too broad for the case of PSR J02184232 as a nearly aligned rotator if the hard X-ray/-ray production takes place only close to the light cylinder. However, Hirotani et al. (2002) argued recently that the -ray production is not limited to regions in the outer gap above the null-charge surface, but can also originate from altitudes closer to the neutron star. More detailed model calculations are required to solve the present uncertainties in the overall interpretation of the data.
This underlines the importance of a new attempt to determine the geometry from radio polarization data. Then detailed model calculations starting from this geometry can attempt to reproduce all the remarkable timing and spectral results obtained for this millisecond pulsar.
References
- Bhattacharya & Srinivasan (1991) Bhattacharya D., Srinivasan G., 1991, JA&A 12, 17
- Bulik & Rudak (1999) Bulik T., Rudak B., 1999, Astrophysical Letters and communications 38, 37
- Bulik et al. (2000) Bulik T., Rudak B., Dyks J., 2000, MNRAS317, 97
- Cheng et al. (1986a) Cheng K.S., Ho C., Ruderman M., 1986a, ApJ 300, 500
- Cheng et al. (1986b) Cheng K.S., Ho C., Ruderman M., 1986b, ApJ 300, 522
- Daugherty & Harding (1994) Daugherty J.K., Harding A.K, 1994, ApJ 429, 325
- Daugherty & Harding (1996) Daugherty J.K., Harding A.K, 1996, ApJ 458, 278
- Dyks & Rudak (1999) Dyks J., Rudak B., 1999, Astrophysical Letters and communications 38, 41
- Dyks & Rudak (2002) Dyks J., Rudak B., 2002, Proceedings of the XXII Moriond Astrophysics Meeting ”The Gamma-Ray Universe”, eds. A. Goldwurm, D. Neumann, and J. Tran Thanh Van, The Gioi Publishers (astro-ph/0205222v1)
- Hartman et al. (1999) Hartman, R.C., et al., 1999 ApJS, 123, 79
- Hirotani et al. (2002) Hirotani K., et al., 2002, Proceedings of the XXII Moriond Astrophysics Meeting ”The Gamma-Ray Universe”, eds. A. Goldwurm, D. Neumann, and J. Tran Thanh Van, The Gioi Publishers
- Ho (1989) Ho C., 1989, ApJ 342, 396
- Kuiper et al. (1998a) Kuiper, L., Hermsen, W., Verbunt, F., & Belloni, T. 1998, A&A, 336, 545
- Kuiper et al. (1998b) Kuiper, L., Hermsen, W., Bennett, K., Carramiñana, A., Lyne, A., McConnell, M., & Schönfelder, V. 1998, A&A, 337, 421
- Kuiper et al. (2000) Kuiper, L., Hermsen, W., Verbunt, F., Thompson, D.J., Stairs, I.H., Lyne, A.G., Strickman, M.S., & Cusumano, G. 2000, A&A, 359, 615
- Kuzmin & Losovsky (2001) Kuzmin, A.D. & Losovsky, B.Ya. 2001, A&A, 368, 230
- Mineo et al. (2000) Mineo, T., Cusumano, G., Kuiper, L., Hermsen, W., Massaro, E., Becker, W., Nicastro L., Sacco, B., Verbunt, F., Lyne, A.G., Stairs, I.H., & Shibata, S. 2000, A&A, 355, 1053
- Navarro et al. (1995) Navarro, J., de Bruyn, A.G., Frail, D.A., Kulkarni, S.R., & Lyne, A.G. 1995, ApJ, 455, L55
- Stairs et al. (1999) Stairs, I.H., Thorsett, S.E., & Camilo, F. 1999 ApJS, 123, 627
- Sturner & Dermer (1994) Sturner S.J., Dermer C.D.,1994, A&A 281, L101
- Swanepoel et al. (1996) Swanepoel, J.W.H., de Beer, C.F., & Loots, H. 1996 ApJ, 467, 261
- Tennant et al. (2001) Tennant, A.F., Becker, W., Juda, M., Elsner, R.F., Kolodziejczak, J.J., Murray, S.S., O’Dell, S.L., Paerels, F., Swartz, D.A., Shibazaki, N., & Weisskopf, M.C. 2001, ApJ, 554, L173
- van Kerkwijk (1997) van Kerkwijk, M. 1997, in Proc. IAU Coll. 160, 489
- van Kerkwijk (2001) van Kerkwijk, M. 2001, personal communication
- Verbunt et al. (1996) Verbunt, F., Kuiper, L., Belloni, T., Johnston, H.M., de Bruyn, A.G., Hermsen, W., & van der Klis, M. 1996, A&A, 311, L9
- Wallace et al. (2000) Wallace, P. M., et al., 2000 ApJ, 540, 184
- Wang et al. (2001) Wang, Q. D., Gotthelf, E. V., Chu, Y.,-H., & Dickel, J. R. 2001 ApJ, 559, 275
- Woźna et al. (2002) Woźna, A., Dyks J., Bulik, T. & Rudak B., 2002, Proceedings of the XXII Moriond Astrophysics Meeting ”The Gamma-Ray Universe”, eds. A. Goldwurm, D. Neumann, and J. Tran Thanh Van, The Gioi Publishers (astro-ph/0205224v1)
- Zhang & Harding (2000) Zhang B & Harding A., 2000, ApJ532, 1150