Weak Lensing Probes of the Galaxy-Mass Cross Power Spectrum
Abstract
The angular correlation function of the background shear-foreground galaxy distribution probes the three dimensional cross power spectrum between mass and galaxies. The same cross power spectrum is also probed when foreground galaxy distribution is cross-correlated with a distribution of background sources disjoint in redshift space. The kernels that project three dimensional clustering to the two dimensional angular space is different for these two probes. When combined, they allow a study of the galaxy-mass cross power spectrum from linear to non-linear scales. By inverting the background shear-foreground galaxy correlation function measured by the Sloan Digital Sky Survey, we present a first estimate of the cross power spectrum between mass and galaxies at low redshifts.
keywords:
cosmology: observations — gravitational lensing1 Introduction
The current and upcoming wide field imaging data, such as from the Sloan Digital Sky Survey, allow detailed studies on the angular clustering of galaxies and quasars (see, e.g., Dodelson et al. 2001; Scranton 2002). In addition to such studies, these data also allow investigations related to the cross clustering between galaxies and mass. With the so-called galaxy-galaxy lensing (Blandford et al. 1991; Bartelmann & Schneider 2002 for a recent review), one measures the correlation between foreground galaxies and the background shear surrounding these galaxies. This results in a measuremnt of the correlation between foreground galaxies and the dark matter distribution traced by these galaxies. Under the assumption that a single galaxy reside in each dark matter halo, one can use the observed correlation function to constrain some physical properties of halos (Fischer et al. 2000). Alternatively, more detailed, and increasingly complicated, models can also be introduced such that one takes in to account the fact that more than one galaxy may be present in dark matter halos at the high end of the mass function (Guzik & Seljak 2001, 2002).
In addition to the background shear-foreground galaxy correlation function, the cross-correlation function between a sample of foreground galaxies and background sources, such as quasars, also probe the same galaxy-dark matter cross power spectrum (Moessner et al. 1997). This correlation results from the fact that number counts of background galaxies are affected by lensing magnification via the intervening dark matter distribution traced by foreground galaxies.
In this letter, we will briefly consider complimentary properties of these two lensing probes of the same galaxy-mass cross power spectrum. The foreground galaxy-background source correlation and the foreground galaxy-background shear correlation have unique properties in that they probe two different regimes of the galaxy-dark matter cross-power spectrum. We will describe this difference in terms of the kernel involved with the projection of three dimensional clustering to the two dimensional angular space. Finally, we will estimate the cross power spectrum between galaxies and mass by inverting the published galaxy-shear correlation function from the Sloan Digital Sky Survey. When necessary, we will illustrate our results using the currently favored CDM cosmology with and and use inputs, such as the redshift distributions necessary for inversions, from published results in the literature.
2 Shear-Galaxy correlation
As briefly discussed earlier, the shear-galaxy correlation function can be constructed by correlating tangential shear of background galaxies surrounding foreground galaxies. The assumption is that these foreground galaxies trace the mass distribution responsible for weak lensing of background sources. To derive the associated correlation function, it is useful to first consider the relation between mean tangential shear, , and convergence:
| (1) |
where is the mean convergence within a circular radius of (Kaiser & Squires 1993). The foreground sources are assumed to trace the dark matter distribution and one can write fluctuations in the foreground source population, , as
| (2) |
where is the normalized distribution of foreground galaxies in radial coordinates with comoving radial distance given by , while is the fluctuation in the galaxy density field.
Since the shear, averaged over a circular aperture, is correlated with foreground galaxy positions, one essentially probe the galaxy-mass correlation. We write under the Limber approximation (Limber 1954) using Fourier expansion of equation (2) as
| (3) |
where is the cross power spectrum between galaxies, , and dark matter, . Here, is the comoving angular diameter distance and is the window function associated with lensing
| (4) |
Following equation (1) and Guzik & Seljak (2001), we can write the mean tangential shear involved with background shear-foreground galaxy distribution as
| (5) |
This correlation function has now been measured, and well studied, with Sloan data (Fischer et al. 2000; Guzik & Seljak 2001, 2002). We will present the first inversion of this correlation function to estimate in section 4 of this letter.
3 Foreground-background source correlation
The second observational probe of the galaxy-mass correlation function comes from clustering of background sources around foreground objects. Here, one constructs a correlation function by simply cross-correlating the surface density of background objects, such as quasars (Dolag & Bartelmann 1997; Norman & Impey 2001) or X-ray sources (Cooray 1999), with a sample of foreground galaxies. The dependence on the correlation comes from the fact that foreground sources trace the mass density field which can potentially affect the number counts of background sources by the weak lensing magnification effect.
To understand this correlation, we can consider a sample of background sources whose number counts can be written as
| (6) |
where is the flux and is the slope of number counts111Similarly, we can describe this calculation with counts based on magnitudes instead of flux. In that case, one should replace with where ; the logarithmic slope of the magnitude counts. Due to lensing, when the amplification involved is , one probes to a lower flux limit while the total number of sources are reduced by another factor ; the latter results from the decrease in volume such that the total surface brightness is conserved. Thus, in the presence of lensing, number counts are modified to
| (7) |
In the limit of weak lensing, as more appropriate for the large scale structure, where is the convergence. This allows us to write fluctuations in background number counts, , in the presence of foreground lensing as (Moessner et al. 1997)
| (8) | |||||
where the lensing weight function integrates over the background source population following equation (4). As before, since foreground galaxies trace the distribution of dark matter responsible for lensing, we can write the correlation between foreground and background sources as
| (9) |
where we have simplified using the Fourier expansion of equations (8) and (2), and have introduced, again, the galaxy-mass cross power spectrum.
Note that in the case where foreground and background sources are not distinctively separated in radial coordinates, or equivalently in redshift space, there may be an additional correlation resulting from the fact that background sources trace the same overlapping density field in which foreground sources are found (Moessner et al. 1997). This leads to a clustering term that is proportional to the cross power spectrum between foreground source sample, galaxies in this case, and the population of background sources. This clustering component usually becomes a source of contamination for the detection of background source-foreground galaxy correlation due to weak lensing alone.
Returning to lensing aspects of the two correlation functions, it is now clear how they probe the galaxy-mass cross power spectrum:
| (10) |
where kernels, , involved with galaxy-shear, , and galaxy-source correlations, , are respectively
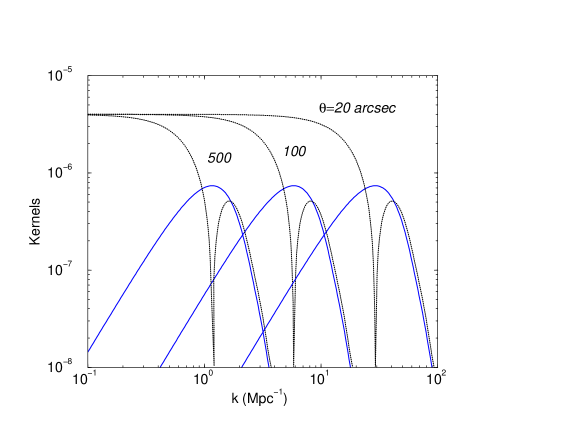
In addition to a factor of in , which is an overall normalization, the two kernels are distinctively different due to differences in Bessel functions involved with the projection; A and a in the galaxy-source and galaxy-shear correlations, respectively. Thus, one expects these two probes to be sensitive to different physical scales, or in Fourier wave-number , of the three dimensional galaxy-mass cross power spectrum at the same projected angular scale, .
We illustrate the difference between these two kernels in figure 2. For illustration purposes, we take a redshift distribution of foreground sources of the form with a median redshift, , of 0.2. The background sources are taken to be at a redshift of 0.5 with . As shown in figure 2, due to the behavior associated with , the tangential shear-foreground galaxy correlation function probes smaller scales, or larger ’s in terms of wave numbers than the foreground-background correlation which depends on a .
Thus, for reasonable angular scales of interest, the shear-galaxy correlation is more sensitive to non-linear aspects of the galaxy-mass cross power spectrum. This is also the reason why in the so-called halo models, the one halo contribution can be used to describe shear-galaxy correlation adequately. The two-halo term, which describes the clustering between halos and proportional to the linear power spectrum, does not make a significant contribution to the shear-galaxy correlation even at large angular scales. The same dependence also makes the shear-galaxy correlation a strong probe of dark matter halo properties. The foreground galaxy-background source correlation, however, allows a probe at large and linear scales. This is consistent with the fact that a simple galaxy-galaxy correlation function involves both large scale clustering contribution at large angular scales and the non-linear contribution at small angular scales.
When combined, shear-galaxy and galaxy-source correlations can potentially be used to study the cross power spectrum between galaxies and mass over a wide range in physical scale from linear to the non-linear regime. We highly recommend a combined study of the two weak lensing probes using the same sample of foreground galaxies and, potentially, the same background source sample from which shear measurements are made and which can be correlated directly with the foreground galaxy distribution.
Note that the galaxy-mass cross power spectrum can be written as , where is the non-linear dark matter power spectrum. Since the galaxy-galaxy power spectrum is , one can use a combination of galaxy-shear, galaxy-source and foreground galaxy-foreground galaxy correlations functions to study galaxy bias, , and its correlation, , with respect to the dark matter density field. This can clearly, and easily, be carried out with current and future wide-field imaging surveys, including the Sloan survey.
While the correlation function of these galaxies will give information on , the lensing probes will provide necessary information on . Finally, information related to will come from the background shear-background shear correlation function. The current and planned surveys from instruments such as the MEGACAM and telescopes such as the Large Synoptic Survey Telescope (Tyson & Angel 2001) will allow a detailed study of the dark matter power spectrum. We recommend that these surveys also consider the cross clustering measurements between galaxies and shear in order to extract information on the galaxy-mass cross power spectrum.
4 Galaxy-Mass Cross Power
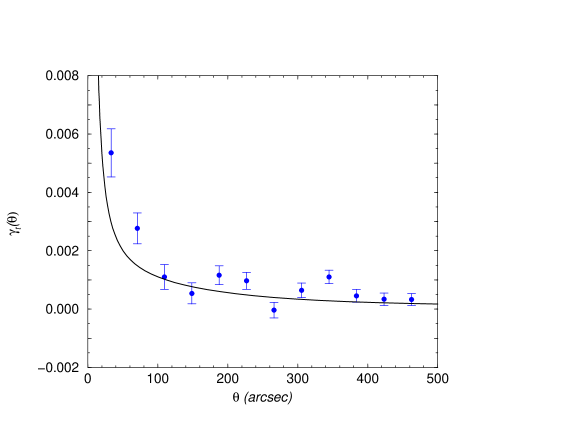
As a first attempt at directly extracting the galaxy-mass cross power spectrum, we can apply above discussion to published measurements in the literature. In terms of the tangential shear-galaxy correlation, the best results probably come from the Sloan Digital Sky Survey (Fischer et al. 2000). However, no published results are still available for the background-foreground galaxy correlations from Sloan, though initial work towards such a study is currently in progress (Jain et al. in preparation). Similar work is also in progress to cross correlate galaxy and quasar samples. Thus, we will only consider the galaxy-shear correlation as a probe of the galaxy-mass cross power spectrum here.
In figure 1, we compare measurements of this correlation with a prediction based on the so-called halo model (see, Cooray & Sheth 2002 for a recent review). Here, for simplicity, we take a simple description for galaxy number counts as introduced in Seljak (2000) and extended later in Guzik & Seljak (2001). In calculating the expected correlation function, we have used the expected redshift distributions for foreground and background galaxies in Sloan samples following Dodelson et al. (2001) and McKay et al. (2001). A more thorough study of the weak lensing shear-galaxy cross-correlation, under the halo model, is available in Guzik & Seljak (2001). We focus on a model independent extraction of the galaxy-mass cross power spectrum here.
In order to invert the above correlation to estimate the galaxy-mass power spectrum, we follow the approach advocated in Dodelson et al (2001; see, also, Dodelson & Gaztañaga 2000). This approach has been applied to an inversion of the Sloan’s clustering results, mainly the correlation function, , and the angular power spectrum, , of galaxies. We can write the associated inversion equation as
| (12) |
where, in the present case, is a vector containing the data related to with an associated noise vector and is a matrix containing kernels at each where the correlation function is measured and at each for which cross-power spectrum estimates are desired. The inversion problem involves estimating given other vectors and the matrix . Similar to the notation in Dodelson et al. (2001), the matrix differs from kernels defined in equation (LABEL:eq:kernels) due to an additional factor of . By appropriately renormalizing equation (12) with noise, following Dodelson et al. (2001), we consider the minimum variance estimate of the galaxy-mass cross power spectrum.
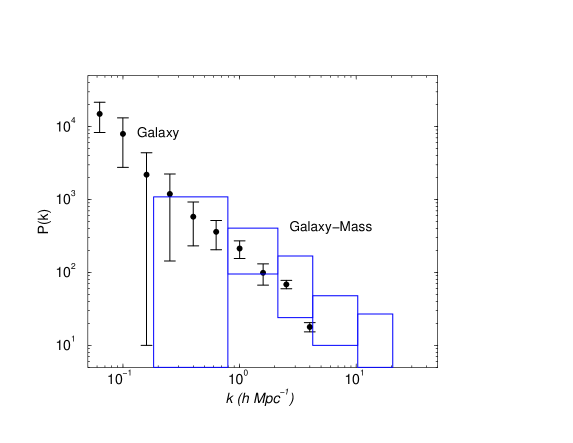
We refer the reader to Dodelson et al. (2001) for details on this approach and illustrate our results in figure 3. In the same figure, we also compare our estimate for the galaxy-mass cross power spectrum with an estimate for the galaxy-galaxy power spectrum in Sloan’s band with magnitudes between 19 and 20. While the redshift distribution of galaxies in the shear-galaxy correlation and the galaxy-galaxy correlation may be different, with a carefully selected sample, it is likely that estimates on parameters such as bias and correlations may eventually be possible. We do not make detailed comparisons between Sloan’s galaxy-mass and galaxy-galaxy power spectra for possible mismatches in redshift as well as mismatches in magnitude ranges; While, the foreground galaxy sample related to the galaxy-mass cross power spectrum is between 16 and 18 in the band, estimates for the galaxy-galaxy power spectrum have only been considered for galaxies with in Dodelson et al. (2001).
There is, however, one significant difference between the inversion in Dodelson et al. (2001) and the one performed here. The difference, in fact, makes the inversion discussed here more stable and reliable. As suggested, the kernel associated with the shear-galaxy correlation involves a which is better peaked than that associated with a simple galaxy-galaxy correlation, mainly a . Also, estimates of the power are less correlated while, with a , one finds a significant covariance matrix for power spectrum estimates. The same is also true in the real space; Because of the broadness of the , measurements of the galaxy correlation function are correlated (Eisenstein & Zaldarriaga 2000) while we do not expect this to be the case for the galaxy-shear correlation function. As shown in figure 2, another minor observation is that the kernel associated with galaxy-galaxy correlation function, , extends to larger with a decrease in the angular scale of interest. This makes the simple galaxy-correlation function monotonically increasing with decreasing angular scale. This is not the case with the shear-galaxy correlation. The function only increases at small angular scales due to the additional dependence of that integrates over kernels shown in figure 2.
Even though an inversion of the galaxy-shear correlation is better behaved than the one involving galaxy-galaxy correlation, our estimate for the galaxy-mass power spectrum should be considered as preliminary. We have neglected the covariance, though small, in the angular space between data points. Though the associated kernel makes such correlations substantially small, a proper accounting of the covariance of measurements is clearly required. While no knowledge is available on this aspect, it can eventually be obtained through semi-analytical models such as the one adopted to determine the covariance of galaxy correlation function in Sloan or using data themselves (for e.g., Scranton et al. 2001).
Also required for this analysis is the precise redshift distribution of background and foreground galaxies. While there is limited knowledge on this, with photometric data calibrated based on spectroscopic observations, this is likely to improve in the future. To keep contaminants small, it is important that the two samples are disjoint in the redshift space when estimating the foreground galaxy-background source correlation function. We recommend that the measurement of the shear-galaxy correlation be followed in the future with a measurement of the foreground galaxy-background galaxy correlation and a correlation of the foreground galaxies themselves. A combined inversion of these correlation functions will clearly improve our knowledge on the cross clustering between galaxies and mass as well as biasing properties of galaxies themselves. As more details on Sloan’s lensing results become public, we will implement such an approach in the future.
5 Summary
We have discussed two probes of the cross power spectrum between galaxies and mass which effectively use two aspects of weak lensing involving shearing of background images in one case and the magnification of background images in the other. The two probes, though similar in most aspects, probe different physical scales of the galaxy-mass cross power spectrum due to a subtle difference in the kernel which projects three dimensional clustering to the observable two-dimensional angular space. When combined, effectively with the same sample of foreground galaxies whose redshift distribution is known a priori, these two probes allow a study of the galaxy-mass cross power spectrum from linear to non-linear scales.
While the galaxy-mass cross power spectrum provides information on how galaxies are correlated with mass, the galaxy-galaxy power spectrum provides information on biasing. Thus, a complete study, which can be easily carried out with imaging data such as from the Sloan survey is to measure the angular correlation of foreground galaxies, and associated lensing correlation functions discussed here. The three functions can then be inverted in a consistent manner to obtain much needed knowledge on galaxy clustering relative to mass. As a first example of such an approach, we have inverted the background shear-foreground galaxy correlation function measured by the Sloan Digital Sky Survey and have provided a first estimate of the cross power spectrum between mass and galaxies at low redshifts as appropriate for Sloan sample of galaxies in the r’ band.
Acknowledgments
We thank useful discussions with, and help from, Scott Dodelson on inversions, Ravi Sheth on halo models and lensing correlation functions, and Albert Stebbins on Sloan’s shear-galaxy correlation. This work was funded from a senior research fellowship at Caltech from the Sherman Fairchild foundation and from a grant from the US Department of Energy.
References
- [Bartelmann & Schneider] Bartelmann, M., Schneider, P. 2001, Physics Reports, 340, 291.
- [Blandford et al] Blandford, R. D., Saust, A. B., Brainerd, T. G., Villumsen, J. V. 1991, MNRAS 251, 60
- [Cooray] Cooray, A. R. 1999, A&A, 348, 673
- [Cooray & Sheth] Cooray, A., Sheth, R. K., 2002, to appear in Physics Reports.
- [Dodelson et al.] Dodelson, S. & Gaztañaga, E. 2000, MNRAS, 312, 774
- [Dodelson et al.] Dodelson, S., Narayanan, V. K., Tegmark, M. et al. 2001, ApJ in press (astro-ph/0107421).
- [Dolag & Bartelmann] Dolag, K. & Bartelmann, M. 1997, MNRAS, 292, 446
- [Eisenstein & Zaldarriaga] Eisenstein, D. J. & Zaldarriaga, M. 2001, 546, 2.
- [Fischer et al] Fischer, P., McKay, T. A., Sheldon, E. et al. 2000, AJ, 120, 1198.
- [Guzik & Seljak] Guzik, J. & Seljak, U. 2001, MNRAS, 321, 439.
- [Guzik & Seljak] Guzik, J. & Seljak, U. 2002, MNRAS submitted (astro-ph/0201448)
- [Kaiser & Squires] Kaiser, N. & Squires, G. 1993, ApJ, 404, 411
- [Limber] Limber, D. 1954, ApJ, 119, 655
- [Mckay et al. 2001] Mckay, T. A., Sheldon, E. A., Racusin, J. et al. 2001, ApJ submitted (astro-ph/0108013).
- [Moessner et al] Moessner, R., Jain, B., & Villumsen, J. V. 1997, MNRAS, 294, 291
- [Norman & Impey] Norman, D. J. & Impey, C. D. 2001, MNRAS, 121, 2392
- [Scranton] Scranton, R. 2002, ApJ submitted (astro-ph/0205517)
- [Scranton et al.] Scranton, R., Johnston, D., Dodelson, S. et al. 2001, ApJ submitted (astro-ph/0107416)
- [Seljak] Seljak, U. 2000, MNRAS, 318, 203.
- [Tyson & Angel] Tyson, A. & Angel, R. 2001, In The New Era of Wide Field Astronomy, ASP Conference Series, Vol. 232. Eds. Roger Clowes, Andrew Adamson, and Gordon Bromage (ASP: San Francisco).