via Moiariello 16, I-80131 Napoli 11email: iodice@na.astro.it 22institutetext: International School for Advanced Studied (ISAS), via Beirut 2-4, I-34014 Trieste 33institutetext: University of Wisconsin, Department of Astronomy,
475 N. Charter St., Madison, WI 44institutetext: RSAA, Mt. Stromlo, Canberra, Cotter Road,
Weston ACT 2611, Australia
Near-Infrared photometry in the J, H and Kn bands for Polar Ring Galaxies:
We present new Near-Infrared (NIR) observations, in the J, H and Kn bands, for a sample of Polar Ring Galaxies (PRGs), selected from the Polar Ring Catalogue (Whitmore et al. PRC (1990)). Data were acquired with the CASPIR near-IR camera at the 2.3 m telescope of Mount Stromlo and Siding Spring Observatory. We report here on the detail morphological study for the central host galaxy and the polar structure in all PRGs of our sample. Total magnitudes, bulge-to-disk decomposition and structural parameters are computed for all objects. These data are crucial for an accurate modeling of the stellar population and the estimate of the star formation rates in the two components.
Key Words.:
Galaxies: peculiar – Galaxies: photometry – Galaxies: fundamental parameters1 Introduction
Polar Ring Galaxies (PRGs) are classified as dynamically peculiar systems, as they show the coexistence of two luminous components, the central host galaxy and ring, with their angular momentum vectors in two nearly orthogonal planes (Schweizer et al. Schweizer83 (1983); Whitmore et al. PRC (1990)). The presence of almost two perpendicular angular momentum vectors cannot be explained through the collapse of a single protogalactic cloud: a “second event” must have occurred in the formation history of these systems. In the last years, a number of observational studies were produced to constrain the origin of PRGs (Reshetnikov Resh97 (1997); see also the review by Sparke & Cox Cox2000 (2000)). In almost all PRGs the morphology of the host galaxy resembles that of an early-type object (elliptical or S0 galaxy), because of its structure-less appearance and no HI: kinematical studies on some PRGs have confirmed that this component is rapidly rotating (Schechter et al. Schechter84 (1984); Whitmore et al. PRC (1990)). The integrated colors and gas-to-dust ratio, together with the large ratio for the whole system suggest that PRGs may be quite similar to the late-type spirals (Arnaboldi et al. magda95 (1995)). Very recent works on NGC 4650A, which is considered the prototype of the class of wide PRGs, (Arnaboldi et al. magda97 (1997); Iodice et al. 2002a ; Gallagher et al. 4650aG (2002)) have shown that the polar structure appears to be a disk of a very young age; moreover the host galaxy integrated colors and light distribution do not resemble that of a typical early-type system.
The main goal of the present work (Paper I) is to provide accurate photometry in the NIR for a sample of PRGs; in a second paper (Iodice et al. 2002c , Paper II) they will be compared with the predictions from different formation scenarios for these peculiar systems. Near-IR photometry is necessary to reduce as much as possible the dust absorption that strongly affects the starlight distribution in the host galaxy and in the ring (Whitmore et al. PRC (1990)). Since the dust optical depth decreases toward longer wavelengths, photometry in the NIR will be relatively free from this problem, and the inner structures of the host galaxy and ring may be easily identified. The NIR photometry is also more representative of the light emitted by the older stellar population, which contains most of the mass: any dynamical modeling of PRGs will be more accurate when using the light distribution for the different components in the NIR rather than those at the optical wavelength. In addition, the study of optical and NIR integrated colors will yield information about the age and metallicity of dominant stellar population in the different components of a PRG system.
In this paper we present new NIR observations, obtained for a selected sample of PRGs from the Polar Ring Catalogue, listed in Table 1, and have applied the same procedures adopted to study the polar ring galaxy NGC 4650A (Iodice et al. 2002a ). Observations and data reduction are presented in Sec.2; the morphology, light and color distribution of the two components (host galaxy and ring) are discussed in Sec.3 and Sec.4. In Sec.5 the integrated colors derived for different regions of each PRG are presented. The two-dimensional model of the host galaxy light distribution is discussed in Sec.6,a detailed description of each selected PRG is given in Sec.7. The final summary of the data is presented in Sec.8.
| Object name | PRC name | (J2000) | (J2000) | diameters | |
|---|---|---|---|---|---|
| (km/s) | (arcmin) | ||||
| A0136-0801 | A-01 | 01h38m55.2s | -07d45m56s | 5500 | 0.41 x 0.3 |
| ESO 415-G26 | A-02 | 02h28m20.1s | -31d52m51s | 4604 | 1.3 x 0.6 |
| ARP 230 | B-01 | 00h46m24.2s | -13d26m32s | 1742 | 1.3 x 1.2 |
| AM 2020-504 | B-19 | 20h23m54.8s | -50d39m05s | 4963 | |
| ESO 603-G21 | B-21 | 22h51m22.0s | -20d14m51s | 3124 | 1.1 x 0.6 |
2 Observations and data reduction
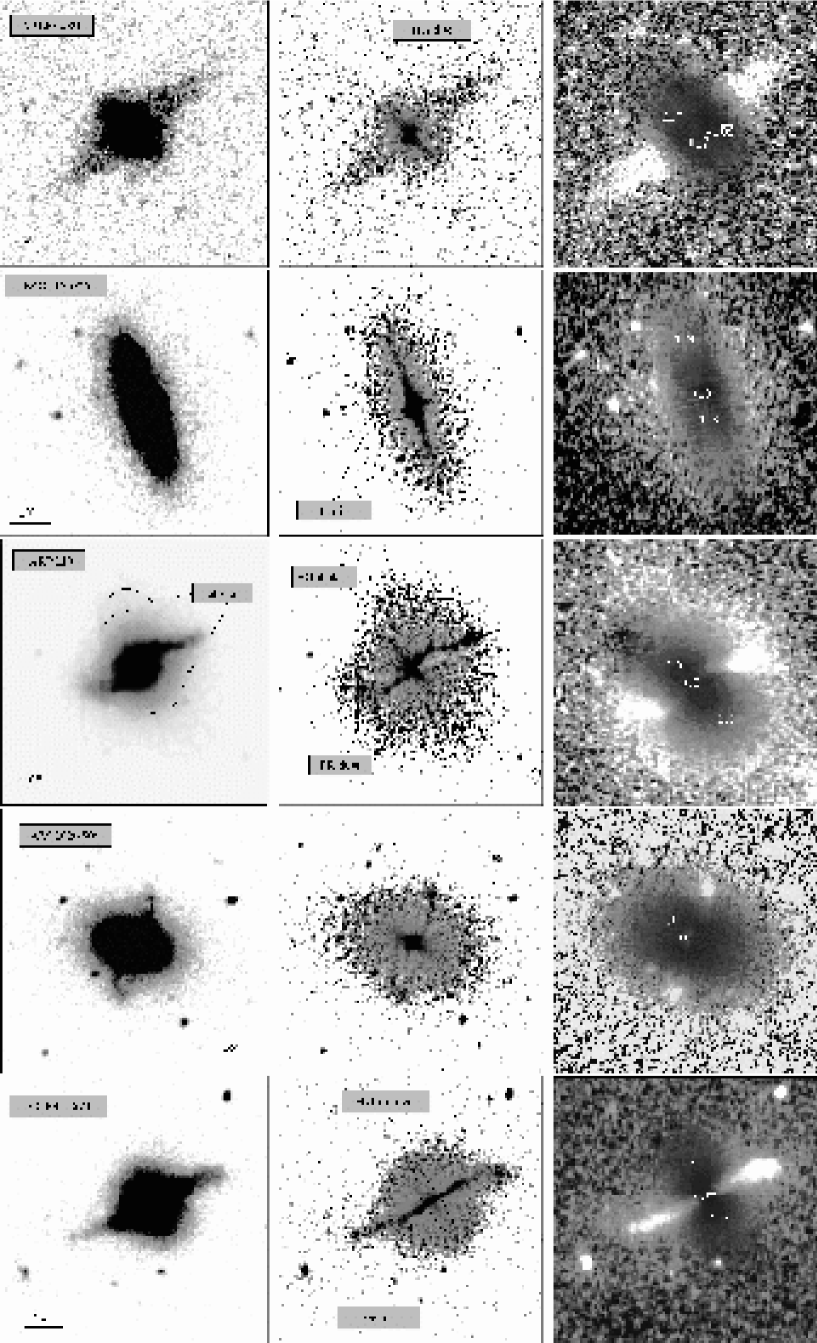
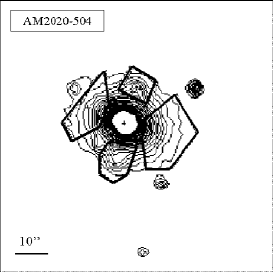
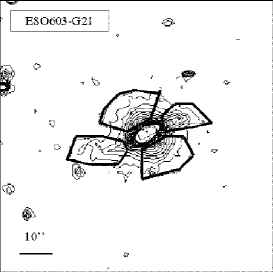
The near-infrared J, H and Kn data were acquired during several observing runs at the 2.3 m telescope of the Mt. Stromlo and Siding Spring Observatory, with the CASPIR infrared camera (McGregor McG94 (1994)), by M. Arnaboldi and K.C. Freeman. The angular resolution of the data is 0.5 arcsec pixel-1 and covering a field of view of . The observing log for these data is summarized in Table 2. Images were acquired in the offsetting mode: a cycle was defined containing 5 images on target, interspersed with 5 sky frames; each object frame was taken with a small offset from the galaxy center and the sky frames were taken before and after each galaxy frame. Dark frames were acquired at the beginning and end of each cycle, while bias frames were obtained at the beginning and end of each set of cycles. More cycles were obtained in the Kn band than in the J and H band, in order to have a better estimate of the background level. For A0136-0801 only the H band observations are available. The data reduction is carried out by using the CASPIR package in the IRAF111IRAF is distributed by the National Optical Astronomy Observatories, which is operated by the Associated Universities for Research in Astronomy, Inc. under cooperative agreement with the National Science Foundation. (Image Reduction and Analysis Facility) environment. The main strategy adopted for each data-set includes linearization, flatfielding correction, sky subtraction and rejection of bad pixels. Finally, all frames were registered and co-added into the final scientific frame. Several standard stars, from Carter & Meadows (carter95 (1995)), were observed at the beginning, middle and at the end of each observing night, in order to transform instrumental magnitudes into the standard J, H and Kn band systems. All the objects of the sample are small: they subtend a diameter of about on the sky and therefore they lie well inside the detector field, and allow for a suitable estimate of the sky background. The calibrated H-band images of each object are shown in Fig. 1 (left panels).
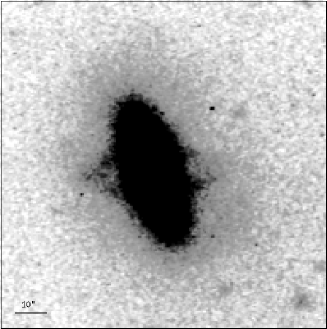
To study the stellar population ages of the two components in PRGs (see Paper II), we need the optical data for all the objects of our sample. The B band images for the polar ring galaxies ESO 603-G21, AM 2020-504 and ARP 230, used in the present work were obtained by Arnaboldi and collaborators (Arnaboldi et al. magda95 (1995)). For ESO 415-G26, new B band data were acquired in January 2001, by K.C. Freeman, at the Mt. Stromlo and Siding Spring Observatory (SSO) 2.3 m telescope. The imager at the SSO 2.3 m telescope has a field of view of and an angular resolution of 0.59 arcsec pixel-1. The data-set included 3 bias frames, 3 different images of the twilight sky (to derive the flatfield image) and 5 object frames taken with the offsetting mode. The total integration time of the object frames is 1200 seconds. Moreover, standard stars in the E2-region (Graham, graham82 (1982)) wer observed in B and V bands in order to establish the photometric zero point for the B band system. To obtain the final B band image for ESO 415-G26 (Fig.2), the data reduction is similar to that described for the NIR images. The CCDRED package in IRAF was used to linearise, flatfield and combine these B band images.
| Object | Filter | Tot. int. | FWHM | Date |
|---|---|---|---|---|
| (s) | (arcsec) | |||
| A0136-0801 | H | 900 | 3.7 | 20/08/1995 |
| ESO 415-G26 | J | 600 | 3.1 | 20/08/1995 |
| H | 600 | 1.9 | 19/08/1995 | |
| H | 600 | 2.3 | 20/08/1995 | |
| Kn | 900 | 1.4 | 18/08/1995 | |
| Kn | 300 | 1.3 | 19/08/1995 | |
| ARP 230 | J | 900 | 1.5 | 19/08/1995 |
| H | 900 | 1.6 | 19/08/1995 | |
| Kn | 2100 | 1.6 | 18/08/1995 | |
| AM 2020-504 | J | 1200 | 2.2 | 18/08/1995 |
| H | 1200 | 1.4 | 18/08/1995 | |
| Kn | 900 | 1.8 | 19/08/1995 | |
| Kn | 1200 | 2.0 | 20/08/1995 | |
| ESO 603-G21 | J | 900 | 1.5 | 19/08/1995 |
| H | 1200 | 1.6 | 19/08/1995 | |
| Kn | 1800 | 1.5 | 20/08/1995 |
3 Host galaxy and polar ring morphology
The NIR images of all objects in the sample show that most of the NIR light comes from the host galaxy and its morphology resembles that of a flattened ellipsoid, most likely a lenticular S0 galaxy (see left panels of Fig.1). In all the objects, but A0136-0801, the polar ring is within the optical radius of the central galaxy. In A0136-0801 (Fig.1, left panel), the polar ring is more extended in radius than the host galaxy, it has a considerable width and hosts several star formation regions, as suggested by its irregular light distribution.
We wish to identify the high frequency residuals with respect to the homogeneous light distribution. To this aim, we produce a median filtered image (computed with the FMEDIAN package in IRAF) where each original pixel value is replaced with the median value in a sliding rectangular window. After several tests, a window size of pixels was chosen because it provides the optimum enhancement of the S0 inner structures. The final un-sharp masked images are obtained as ratios between the coadded galaxy frame and its median filtered image: this ratio represents the “high-frequency residual image” and it is produced for all NIR bands (see Fig.1, middle panels, for the H band).
The most important result obtained from this analysis is the identification of a disk-like structure along the major axis of the host galaxy for all objects, but AM 2020-504 (Fig.1). Furthermore the high-frequency residual images in ESO 603-G21 and ARP 230 reveal additional fainter structures in the inner regions of the host galaxy, which are probably related to the polar ring (Fig.1). All these luminous components become stronger in the H and Kn bands, as the perturbations due to dust absorption decrease in these bands.
The resolution of our groundbased NIR data does not allow us to establish whether the polar structure extends all the way in to the galaxy center, as Iodice et al. (2002a ) found in NGC 4650A. A0136-0801 is the only wide polar ring in our sample with a similar morphology to NGC 4560A, but HST data are not available for this galaxy to perform a similar study as for NGC 4650A.
In Sec.7, the high-frequency residual images for all objects and in all bands are discussed in details.
4 Photometry: light and color distribution
For each object, the J, H and Kn luminosity profiles were derived along the major axis of the host galaxy and are shown in the left panels of Fig.3. To map the whole polar ring extension, we computed the surface brightness profiles for this component as an average of several profiles extracted in a cone, centered on the host galaxy and several degrees wide, at the Position Angle (P.A.) of the ring major axis (right panels of Fig.3). The width of the cone depends on the inclination respect to the line-of-sight and the radial extension of the ring.
The J-H and H-K color maps, derived for ESO 415-G26, ARP 230, AM 2020-504 and ESO 603-G21, are shown in Fig.4: in all PRGs, but AM 2020-504, there is a redder region which corresponds to the disk-like component already identified in the high-frequency images (Sec.3). The characteristics of the light and color distributions in each object will be discussed in detail in Sec.7.


5 Integrated magnitudes and colors
For each PRG of the sample, the total integrated magnitudes are computed in the NIR, J, H and Kn bands, inside a circular aperture of a given radius. Such radius depends on the average extension of the object, which can be easily deduced from the light profiles shown in Fig. 3. Total magnitudes were corrected for the extinction within the Milky Way, by using the absorption coefficient in the B band () and the color excess derived from Schlegel et al. (Schlegel98 (1998)). The absorption coefficients for the J, H and Kn bands (, , ) are derived by adopting , and using the curve from Cardelli et al. (1989). The values of the absorption coefficients adopted for each object are listed in Table 3. Total magnitudes are listed in Tab. 4; furthermore for A0136-0801, ARP 230 and ESO 603-G21 the table includes the total magnitudes derived from the Two Micron All Sky Survey (2MASS) data, in the same regions. The average uncertainties which affects the 2MASS magnitudes listed in Tab. 4 varies between 0.02 and 0.04 mag. However, these values are computed for the Poissonian noise, and they do not include additional photometric uncertainties222Atmospheric OH airglow emission variations contribute extra noise particularly in the H band, where the total photometric error can be about 0.15 mag. which affect these data and cause the total photometric error to be about three times larger (Jarrett et al. 2mass (2000)).
The J, H and Ks total magnitudes derived from the 2MASS data are on average 0.16 mag brighter than the J, H and Kn CASPIR magnitudes (see Tab.4). The non-Poissonian background fluctuations, which affects both CASPIR and 2MASS images, particularly in H band, can only account for such differences.
In order to compute a detailed analysis of the stellar population content of the main components in PRGs (host galaxy and polar ring) we have derived the integrated magnitudes and colors in five different areas. The five areas are chosen as follows: one is coincident with the nucleus; two areas are placed within the host galaxy stellar component, but outside the nucleus and in regions unperturbed by the polar ring), and two areas for the polar ring. In Fig.5 these regions are shown for each object of the sample. The polygon contours limit these areas and are determined in the J image; the same polygons are used for H and Kn bands, after the images where registered to the J image. Polygons are marked by using the IRAF task POLYMARK and the integrated magnitude are computed using the IRAF task POLYPHOT. A detailed discussion on the photometric errors is given in AppendixA. The integrated magnitudes and colors derived in each area were corrected for the extinction within the Milky Way, by using the absorption coefficients listed in Table 3. The corrected integrated magnitudes and colors are listed in Table 5.
| Object | ||||
|---|---|---|---|---|
| (mag) | (mag) | (mag) | (mag) | |
| A0136-0801 | 0.115 | 0.024 | 0.015 | 0.01 |
| ESO 415-G26 | 0.073 | 0.015 | 0.01 | 0.006 |
| ARP 230 | 0.083 | 0.017 | 0.011 | 0.007 |
| AM 2020-504 | 0.185 | 0.039 | 0.025 | 0.016 |
| ESO 603-G21 | 0.144 | 0.030 | 0.019 | 0.012 |
| Object | r | ||||||
|---|---|---|---|---|---|---|---|
| (arcsec) | (mag) | (mag) | (mag) | (mag) | (mag) | (mag) | |
| A0136-0801 | 40 | 12.90 | 12.62 | 12.49 | 12.05 | ||
| ESO 415-G26 | 30 | 12.48 | 11.86 | 11.38 | |||
| ARP 230 | 25 | 12.00 | 12.00 | 11.41 | 11.31 | 11.14 | 10.96 |
| AM 2020-504 | 25 | 12.50 | 11.83 | 11.60 | |||
| ESO 603-G21 | 30 | 12.79 | 12.64 | 12.08 | 11.88 | 11.65 | 11.52 |
| Object | component | region | (mag) | (mag) | B-H | J-H | H-K | J-K |
|---|---|---|---|---|---|---|---|---|
| ESO 415-G26 | PR | SE | 17.97 | 16.25 | 2.17 | 0.45 | 0.36 | 0.81 |
| PR | NW | 17.22 | 15.90 | 2.13 | 0.32 | 0.41 | 0.73 | |
| HG | SW | 17.16 | 14.96 | 2.84 | 0.64 | 0.45 | 1.09 | |
| HG | NE | 16.78 | 14.87 | 2.64 | 0.72 | 0.51 | 1.23 | |
| HG | center | 15.80 | 13.42 | 3.32 | 0.80 | 0.54 | 1.34 | |
| ARP 230 | PR | SE | 15.96 | 14.24 | 2.29 | 0.57 | 0.29 | 0.85 |
| PR | NW | 16.24 | 14.81 | 1.94 | 0.51 | 0.29 | 0.81 | |
| HG | SW | 15.71 | 13.89 | 2.3 | 0.48 | 0.20 | 0.67 | |
| HG | NE | 16.25 | 15.02 | 1.81 | 0.57 | 0.19 | 0.76 | |
| HG | center | 16.42 | 13.97 | 3.21 | 0.75 | 0.32 | 1.08 | |
| AM 2020-504 | PR | NW | 18.10 | 15.96 | 2.54 | 0.57 | 0.27 | 0.86 |
| PR | SE | 17.96 | 16.07 | 2.32 | 0.60 | 0.19 | 0.81 | |
| HG | SW | 18.03 | 15.03 | 3.40 | 0.60 | 0.17 | 0.79 | |
| HG | NE | 18.19 | 15.43 | 3.22 | 0.63 | 0.21 | 0.85 | |
| HG | center | 16.63 | 13.50 | 3.73 | 0.77 | 0.25 | 1.04 | |
| ESO 603-G21 | PR | SE | 17.71 | 15.92 | 1.90 | 0.46 | 0.45 | 0.91 |
| PR | NW | 17.68 | 14.95 | 2.07 | 0.58 | 0.37 | 0.96 | |
| HG | SW | 17.29 | 14.83 | 3.03 | 0.57 | 0.37 | 0.94 | |
| HG | NE | 17.24 | 14.83 | 3.00 | 0.59 | 0.33 | 0.92 | |
| HG | center | 18.96 | 14.19 | 5.71 | 0.94 | 0.40 | 1.34 |
6 Two dimensional model of the host galaxy light distribution
One of the open issues in the study of PRGs is the nature of the host galaxy. A qualitative morphological inspection suggests that this component is similar to an early-type galaxy, most likely an S0 (Sec.3). In this paper we present the structural parameters from the two-dimensional (2D) bulge-to-disk decomposition, while the analysis of the results and the comparison with standard S0 systems will be presented in Iodice et al. 2002c (Paper II).
The 2D model fit to the host galaxy light distribution is based on the super-position of two components, each one characterized by concentric and co-axial elliptical isophotes with constant flattening (see Iodice et al. Iodice2001 (2001)). One of this component may be thought as the projection of a spheroid with finite intrinsic thickness, i.e. the bulge. The other component is a disk. The projected surface brightness distribution of the spheroidal component follows the Sersic law:
| (1) |
with and ; , and are the apparent axial ratio, the effective surface brightness and the effective radius respectively. The total luminosity of this component is then (Caon et al. caon93 (1993)), where is a function of the parameter and . The Sersic law is able to fit an exponential behaviour when the n parameter is close to 1.
The projected surface brightness distribution of the disk follows an exponential behavior, as described by Freeman’s exponential law (freeman70 (1970)):
| (2) |
with ; , , and are the apparent axial ratio, the central surface brightness and the scalelength of the disk, respectively. The central surface brightness corrected for the inclination of the disk with respect to the line of sight is given by , and the total luminosity for this component is , with (Freeman, freeman70 (1970)). The total Bulge to Disk ratio (B/D) is given by the ratio between the total luminosities of the bulge and disk components ().
For all PRGs of the sample, the 2D model of the host galaxy light distribution is performed in the Kn band, because the dust absorption is weaker in this band. For the polar ring galaxy A0136-0801 only the H band data were available, so the study of the light distribution for this object is done in this band. However, we have derived the effective surface brightness of the bulge and the central surface brightness of the disk in the Kn band by using the average H-K colors computed from the 2MASS magnitudes, available for this system (see Tab. 4). Since the host galaxy morphology in AM 2020-504 seems to be more similar to that of an elliptical rather than an S0 galaxy (see Sec.3), its light distribution was modeled with a single component, given by the Sersic law. The regions affected by foreground stars and by the polar ring light were accurately masked before performing the fit to the light distribution. Particular attention was given to the seeing effects: to avoid biased results caused by seeing, we have masked out the central regions of the galaxy, before performing the fit. The dimension of the masked area is as large as the measured PSF in that image. Each galaxy point in the fitting algorithm is weighted by its luminosity, as brighter points are affected by smaller errors. Then the models for the host galaxy in the J and H bands are the scaled versions of the Kn band model, based on the average colors of this component (see Sec.4). The structural parameters derived for each object, and the relative error estimated by the algorithm are listed in Table 6. In the last line of Table 6 we reported the for each fit: values for represent good fits (as described by Schombert & Bothun schombert87 (1987)).
In ESO 603-G21 and ARP 230 the ring radius is not large enough for the PR to be clearly separated from the host galaxy, (see Fig.1): here the structural parameters, in particular the apparent axial ratios, for these two objects are affected by larger errors than for the other PRGs in the sample. Fig. 6 and Fig. 7 show the comparison between the observed surface brightness profiles and those derived by the fit, along the principal axis of the host galaxy, in each PRGs. In regions where the central host galaxy light dominates ( arcsec), the modeled surface brightness distribution differs from the observed one of about magnitude, and magnitude in the outer regions.
In Fig. 1 (left panels) we show the ratio between the whole galaxy image and the host galaxy model, which is computed in the H band, for each PRG. This ratio is showed in the H band in order to allow for an easy comparison of the residuals from the 2D fit with the higher frequency residuals from the unsharp-masking of NIR images (Sec.3). In the regions perturbed by dust absorption, due to the ring component, the model is brighter than the galaxy, and this ratio has values less than . In these figures the polar ring structure stands out clearly and some peculiar luminous features related to the galaxy, as the outer shells in ARP 230 (Fig. 1 bottom panels).
| Parameter | A0136-0801 | ESO 415-G26 | ARP 230 | AM 2020-504 | ESO 603-G21 |
|---|---|---|---|---|---|
| (arcsec) | |||||
| (kpc) | |||||
| (arcsec) | |||||
| (kpc) | |||||
| 1.4 | 1.3 | 1.5 | 1.1 | 1.6 |


7 Description and discussion of each galaxy
Here we review in detail the main features which characterize the light and color distribution in the NIR for each PRG in our sample. We will also review other important properties of these objects reported in literature, which we will use in Paper II.
A0136-0801 - This is one of the best case of kinematically confirmed polar ring galaxy (Schweizer et al. Schweizer83 (1983); Whitmore et al. PRC (1990), PRC): it is characterized by a wide polar structure, which is three times more extended than the optical radius of the central host galaxy. Along the polar ring major axis the surface brightness profile in the H band (see Fig.3) is given by two exponential segments with different slopes: the light inside from the center is associated with the host galaxy, whereas the ring component is extended out to . Both the H band image and luminosity profiles (Fig.1 and Fig.3) show that the polar ring is less luminous than the central galaxy, and the bulk of H band light is concentrated at smaller radii. The high-frequency residual image in the H band (see Fig.1) shows the presence of a nearly edge-on disk in the central host galaxy. From the 2MASS database we have derived the J, H and Ks data for this object and we have computed the total integrated magnitudes in a circular area, with a radius in order to include the whole ring. This is the same area used to compute the total magnitude in CASPIR H band (see Tab. 4). Due to the very short exposure (1.3 sec), in the 2MASS images the polar structure is very faint, and most of the light comes from the central galaxy. Thus the J-H and H-K colors derived from these data (, ) are more rapresentative of the host galaxy, and they are comparable with the J-H and H-K colors obtained for host galaxy of other PRGs in our sample. This object was mapped in HI with the Very Large Array (VLA) by van Gorkom et al. (vgorkom87 (1987)) and Cox (Cox96 (1996)): all HI emission is found within the polar ring, whose outer HI contours appear to warp away from the poles. The total HI mass estimated for this object is about (Cox Cox96 (1996)). The regular HI distribution and optical appearance, an apparent lack of HII regions and other signs of recent star-formation activity (Mould et al. Mould82 (1982)) suggest that the polar structure is quite old and possibly dynamically stable.
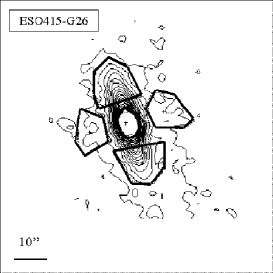
ESO 415-G26 - This is a well-known polar ring galaxy. Unlike A0136-0801, the polar ring is less extended than the central host galaxy in the optical band (see Fig.2). Deeper exposures show a lot of debris at a position angle which is intermediate between those of the host galaxy major axis and the ring. They also show shells and loops in the outer regions (Whitmore et al. whitmore87 (1987)). In the NIR bands (Fig.1, middle panels) the polar ring is so faint that it is hardly detected. The central host galaxy is the dominant luminous component: the analysis of the light distribution shows that this is a nearly edge-on S0 galaxy with an exponential bulge. Among the PRGs of our sample, ESO 415-G26 is characterized by a highest B/D ratio (see Table 6). The NIR color maps (Fig.4) and J-H vs. H-K colors in different regions of host galaxy and ring (see Sec.5) show that the nucleus of the system is characterized by the reddest color and that the polar ring is much bluer than the central host galaxy. The HI map for this object was obtained with the VLA by van Gorkom et al. vgorkom87 (1987) and by van Gorkom & Schiminovich vgorkom97 (1997). They noted that the neutral hydrogen lies along the major axis of the polar ring, with some degrees of correlation between the HI and the outer shells (van Gorkom & Schiminovich vgorkom97 (1997)). The most accurate estimate of the total HI mass is about (Schiminovich et al. Schiminovich97 (1997)). This object is characterized by a considerable amount of molecular hydrogen: Galletta et al. (galletta97 (1997)) estimated the total mass to be about .
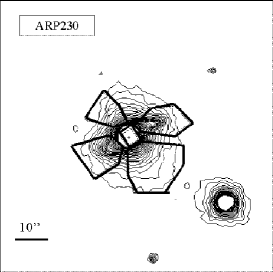
ARP 230 - This object, also known as IC 51, was studied by Wilkinson et al. (wilkinson87 (1987)) as a well-known example of shell elliptical galaxies: in the NE and SW directions, outer shells are clearly visible (Hernquist and Quinn Hernquist88 (1988)), which are more luminous in the B band (see Whitmore et al. PRC (1990), PRC) than in the NIR ones (Fig.1, bottom panels). It is also classified as a PRG because it has a fast rotating disk-like structure, made up by gas, stars and dust, perpendicular to the apparent major axis of the central galaxy, , (Mollenhoff et al. Mollenhoff92 (1992)). Both optical and NIR images (Fig.1, bottom panels) of this polar ring galaxy show that the ring-like component, along SE and NW directions, has the size of the inner galaxy, and it has a very well-defined outer edge, where dust absorption is present. The high-frequency residual images (Fig.1 right panels), show a very distorted structure for the ring component: it seems strongly warped at about from the center, with associated absorption features. An elongated structure nearly orthogonal to the ring suggests that the central host galaxy is more similar to a disk galaxy, an S0, than an elliptical galaxy. In this case it is very difficult to distinguish the morphology of the central component. The 2D model of the light distribution also suggests that it may be an S0 galaxy with an exponential bulge (Table 6), but the peculiar ring structure produces a very uncertain estimate of all the structural parameters; the apparent axial ratios at larger radii are also influenced by the presence of the outer shells. The bright edges of the ring (in the NW and SE directions) and outer shells are clearly visible as bright residuals in the image ratio between the whole galaxy and the 2D model of the central component (see Fig.1, lower left panels). The central host galaxy shows similar J-H colors to the polar ring component, and bluer H-K colors (see Table 5). The very red colors of the nucleus of the system are possibly due to dust absorption in the ring, which passes in front it. Near-IR images, in J, H and Ks bands, are also available for this object in the 2MASS database. Taking into account the average uncertainties which affect these data (see Sec.5), the 2MASS total magnitudes are comparable with those derived from the CASPIR data (see Tab.4. This object was mapped in HI of the VLA by Schiminovich et al. (Schiminovich97 (1997)), and they found that the neutral hydrogen is all associated to the ring and shows rotation along this component. They estimated a total HI mass of about . This PRG was also mapped by Cox (Cox96 (1996)) in the radio continuum, at 20 cm and 6 cm, with the VLA: she found an extended emission aligned with the ring structure and additional filaments which are extended above the ring plane. By comparing the radio continuum and the far-infrared (FIR) emission333The far-infrared (FIR) emission was detected and by Moshir et al. Moshir90 (1990), the IRAS Faint-Source Catalog), Cox (Cox96 (1996)) deduced that this PRG falls on the radio/FIR correlation for star-forming galaxies.
AM 2020-504 - Previous photometric and spectroscopic observations showed that the central host galaxy in this object is very similar to an elliptical galaxy, which is characterized by a decoupled rapidly rotating core within from the center, (Whitmore et al. whitmore87 (1987); Arnaboldi et al. magda93 (1993), magda95 (1995)). The narrow polar ring, which is observed along the host galaxy minor axis, is brighter in the optical than in the NIR images (Fig.1). In all bands, the light distribution of this component is peaked between and (see Fig.3). As pointed out in the previous Sections, this object shows different properties with respect to the other polar ring galaxies studied here. In the high-frequency residual images (Fig.1, middle panel), there is no trace of any disk-like structures associated with the host galaxy major axis, which is observed in all the other polar ring galaxies studied here. The absence of a disk in the host galaxy suggested the use of a Sersic law (Eq.1) for the 2D fit of the light distribution in this component; the results indicate that the AM 2020-504 central component is an elliptical rather than an S0 galaxy.
ESO 603-G21 -
The prominent structure which appears in the B band image of this object
is the warped dusty ring (in the SE and NW directions) which
surrounds a bright round stellar system (see Whitmore et al. PRC (1990) and
Arnaboldi et al. magda95 (1995)).
This central component is much fainter in the NIR images (Fig.1) and
is embedded in a very luminous disk-like structure. The
high-frequency residual images (Fig.1) reveal that this disk is
nearly edge-on.
A further fainter “filamentary” structure, which was already detected by
Arnaboldi et al. (magda95 (1995)), is visible perpendicular to this
disk, and aligned with the apparent major axis of the central
spheroid (). The extension of this filamentary structure
is less than .
The reddest regions in the NIR color maps
(Fig.4) correspond to the disk component, while
the central spheroid is bluer. ESO 603-G21 is the object in our sample
with the reddest nuclear regions (see Table 5).
Very recently, Reshetnikov et al. (Resh02 (2002)) have performed a detailed
surface photometry of ESO 603-G21 in the optical B, V and R bands:
they found that the central component has an exponential light
distribution and is surrounded by an extended, warped, edge-on disk/ring
structure.
These results are consistent with our findings.
The surface brightness profiles along the bright edge-on disk have an
exponential behavior (see Fig.3) and the comparison
with the surface brightness profiles along the orthogonal direction shows that
this disk is the dominant luminous component also in the NIR bands,
unlike all the other polar rings which are faintest in the NIR.
This peculiarity makes ESO 603-G26 similar to a late-type spiral galaxy with a
kinematically-decoupled extended bulge (e.g. NGC 4672 and NGC 4698, see
Bertola et al. bertola99 (1999) and Sarzi et al. sarzi2000 (2000)) rather
than a polar ring galaxy, as also suggested by Reshetnikov et
al. (Resh02 (2002)).
As we will show in Paper II, the central component of ESO 603-G26 has
colors, age and light distribution properties quite similar to those of
the host galaxy in the other PRGs of our sample. In particular, the
surface brightness distributions is well-fit by the super-position of
two components (bulge + disk) rather than by only an bulge,
as in NGC 4672 and NGC 4698. The available spectroscopic data for
this object, which should help us to understand what kind of
object ESO 603-G26 is,
are quite uncertain (Arnaboldi et al. magda95 (1995)):
they show rotation of the stellar component along the two axis
corresponding to and .
This result may suggest that the underlying central spheroid is triaxial.
The rotation curve derived from the strong emission seen in the
disk/ring spectrum shows a constant velocity gradient along this
component (Arnaboldi et al. magda95 (1995)). This may suggest that we are
indeed looking at a ring.
However, these data are strongly influenced by the dust absorption,
so no definite conclusion can be derived.
The J, H and Ks total magnitudes derived from the 2MASS data, available
for this system, are on average 0.16 mag brighter than the J, H and Kn CASPIR
magnitudes (see Tab.4). As already discussed in Sec.4,
the non-Poissonian background fluctuations, which affects both CASPIR
and 2MASS images, particularly in H band, can explain such differences.
Radio data for this object shows CO emission corresponding to
of molecular hydrogen (Galletta et al.
galletta97 (1997)) and in HI (van Driel et al.
vdriel2000 (2000)).
Radio continuum emission was detected for this object by Cox
(Cox96 (1996)) in the central regions of the candidate polar ring
(i.e. along , as in the
PRC). FIR emission, at and , was detected for this PRG
(Moshir et al. Moshir90 (1990), the IRAS Faint-Source Catalog),
this object too falls on the radio/FIR correlation
for star-forming galaxies rather than for an AGN (Cox Cox96 (1996)).
8 Summary
Here we have presented accurate NIR photometry in J, H and Kn bands for a sample of PRGs. These data were used to compute luminosity profiles, perform bulge-to-disk decomposition and derive the structural parameters for the central host galaxy of each PRG in the sample. Total magnitudes and integrated colors were obtained for the two components (host galaxy and ring) in all objects. A detailed morphological inspection performed for all PRGs in our sample has revealed the presence of a disk-like structure along the major axis of the host galaxy in all PRGs of our sample, except for AM 2020-504. This feature makes the central galaxy similar to an S0 system. In the J-H and H-K color maps this disk-like structure is quite red. The structure-less appearance of AM 2020-504 suggests that this object is more similar to an elliptical galaxy. The extension of the polar structure in all PRGs, except for A0136-0801, is comparable to the host galaxy optical radius. In the case of A0136-0801 this component is at least 2 times more extended then the host galaxy. In all PRGs, except for ESO 603-G26, most of the NIR light comes from the central host galaxy; in ESO 603-G26 a bright exponential disk along the ring direction is the dominant luminous component in these bands.
The NIR photometry obtained for this sample of PRGs is crucial for the ongoing research about the formation scenarios for these peculiar objects, which will be discussed in detail in Iodice et al. 2002c (Paper II).
Acknowledgements.
We thank the referee, V. Reshetnikov, for several helpful comments and suggestions. E.I and M.A. wish to thank Prof. Capaccioli and the staff from the Observatory of Capodimonte for the help and support during the realization of this work. E.I. would like to thank Prof. F. Combes and Prof. G. Galletta for comments and suggestions during her Ph.D. thesis, which is the basis of this work. E.I wish to thank Prof. P. Salucci for the many useful discussions. E.I. ad M.A. wish to thank Dr. P. McGregor for providing many information on the CASPIR infrared camera. This publication makes use of data products from the Two Micron All Sky Survey (2MASS), which is a joint project of the University of Massachusetts and the Infrared Processing and Analysis Center/California Institute of Technology, funded by the National Aeronautics and Space Administration and the National Science Foundation. This research has made use of the NASA/IPAC Extragalactic Database (NED) which is operated by the Jet Propulsion Laboratory, California Institute of Technology, under contract with the National Aeronautics and Space Administration.References
- (1) Arnaboldi, M., Capaccioli, M., Barbaro, G., Buson, L., and Longo, G., 1993, A&A, 268, 103
- (2) Arnaboldi, M., Freeman, K. C., Sackett, P. D., Sparke, L. S. and Capaccioli, M., 1995, Planetary and Space Science, 43, 1377
- (3) Arnaboldi, M., Oosterloo, T., Combes, F., Freeman, K. C. and Koribalski, B. 1997, AJ, 113, 585
- (4) Bertola, F., Corsini, E.M., Vega Beltran, J.C. et al. 1999, ApJ, 519, L17
- (5) Caon, N., Capaccioli, M. and Capaccioli, M. 1993, MNRAS, 265, 1013
- (6) Carter, B. S. and Meadows, V. S. 1995, MNRAS, 276, 734
- (7) Cox A., 1996, PhD Thesis, Univ. of Wisconsin, Madison, USA
- (8) Freeman, K. C. 1970, ApJ, 160, 767
- (9) Gallagher, J.S., Sparke, L.S., Matthews, L.D., Frattare, L.M., English, J., Kinney, A.L., Iodice, E., Arnaboldi, M. 2002, ApJ, 568, 199
- (10) Galletta, G., Sage, L. J. and Sparke, L. S., 1997, MNRAS, 284, 773
- (11) Graham, J. A., 1982, PASP, 94, 244
- (12) Hernquist, L. and Quinn, P.J., 1988, ApJ, 331, 682
- (13) Iodice, E., Arnaboldi, M., De Lucia, G., Gallagher, J.S., Sparke, L.S. and Freeman, K.C. 2002, AJ, 123, 195.
- (14) Iodice, E., Arnaboldi, M., Sparke, L.S. and Freeman, K.C. 2002, A&A, in press.
- (15) Iodice, E., D’Onofrio, M. and Capaccioli, M. 2001, Ap&SS, 276, Issue 2/4, 869
- (16) Jarrett, T. H., Chester, T., Cutri, R.,,Schneider, S., Skrutskie, M. and Huchra, J. P. 2000, AJ, 119, 2498
- (17) Matthews, L.D. & Gallagher, J.S. 1997, AJ, 114, 1899
- (18) McGregor, P. J. 1994, PASP, 106, 508
- (19) Moellenhoff, C., Hummel, E. and Bender, R. 1992, A&A, 255, 35
- (20) Moshir, M., Kopan, G., Conrow, T., McCallon, H., Hacking, P., Gregorich, D., Rohrbach, G., Melnyk, M., Rice, W., Fullmer, L., White, J. and Chester, T. 1990, Bulletin of the American Astronomical Society, Vol. 22, p. 1325
- (21) Mould, J., Balick, B., Bothun, G. and Aaronson, M. 1982, ApJ, 260, L37
- (22) Reshetnikov, V.P., Faundez-Abans, M. and de Oliveira-Abans, M., 2002, A&A, 383, 390
- (23) Reshetnikov, V.P. 1997, A&A, 321, 749
- (24) Sarzi, M., Corsini, E.M., Pizzella, A. et al. 2000 A&A, 360, 439
- (25) Schechter, P. L., Boksenberg, A. and Ulrich, M.-H., 1984, ApJ, 277, 526
- (26) Schiminovich, D., van Gorkom, J., van der Hulst, T., Oosterloo, T. and Wilkinson, A. 1997, in The Nature of Elliptical Galaxies, 2nd Stromlo Symposium. ASP Conference Series, Vol. 116, p.362, ed. M. Arnaboldi, G. S. Da Costa and P. Saha
- (27) Schlegel, D. J., Finkbeiner, D. P. and Davis, M. 1998, ApJ, 500, 525
- (28) Schombert, J.M. and Bothun, G.D., 1987, AJ, 93, 60
- (29) Schweizer, F., Whitmore, B. C. and Rubin, V. C., 1983, AJ, 88, 909
- (30) Sparke, L. S. and Cox, A. L., 2000 in Dynamics of Galaxies: from the Early Universe to the Present, Eds. Francoise Combes, Gary A. Mamon, and Vassilis Charmandaris, ASP Conference Series, Vol. 197, p. 119.
- (31) van Driel, W., Arnaboldi, M., Combes, F. and Sparke, L. S., 2000, A&AS, 141, 385
- (32) van Gorkom, J. and Schiminovich, D. in The Nature of Elliptical Galaxies, 2nd Stromlo Symposium. ASP Conference Series, Vol. 116, p.310, ed. M. Arnaboldi, G. S. Da Costa and P. Saha
- (33) van Gorkom, J. H., Schechter, P.L. and Kristian, J., 1987, ApJ, 314, 457
- (34) Whitmore, B. C., Lucas, R. A., McElroy, D. B., Steiman-Cameron, T. Y., Sackett, P. D. and Olling, R. P. 1990, AJ, 100, 1489
- (35) Whitmore, B. C., McElroy, D. B. and Schweizer, F. 1987, ApJ, 314, 439
- (36) Wilkinson, A., Browne, I.W.A. and Wolstencroft, R.D. 1987, MNRAS, 228, 933
Appendix A Tests on the background noise distribution and error estimate
The uncertainties which affect the integrated magnitudes, derived for each object of the sample, are strictly related to the noise in the image background level. The background noise is made up by the residual random fluctuations in the data, which appear after the background level has been subtracted from the image. Usually, a Poisson distribution is assumed to describe these fluctuations. A non correct flatfield correction may introduce further fluctuations in the background, which may strongly influenced the uncertainties on magnitudes. Thus, the error estimate, must take into account both the background noise and flatfield errors (see also Matthews and Gallagher MG97 (1997)). In order to verify whether the background noise in the NIR images is well described by the Poisson distribution, we sampled the sky background around the edge of the image, in each band and for each image. We then performed the following test: in our summed, sky-subtracted images, we considered boxes on the sky, whose areas increase from 25 to even larger areas. The largest area depends on how extended the galaxy is on detector field. For each size, we examined 6 different boxes, in which the mean value is derived. We computed the average of the mean values and derived the relative standard deviation (). In Fig.8 is plotted the the vs , derived for the Kn band images. The diagonal line corresponds to Poisson noise, if the count in each pixel has unit standard deviation. This plot suggests that decreases as the area increases, but it has larger values than those predicted from a Poissonian statistics. Therefore there is more noise within moderate sky regions than predicted by a pure counting model. The error estimate must take into account this “extra noise”.
We estimated the total error in a given area (), which includes both the Poissonian error and the extra-noise, from the standard deviation of the mean counts per pixel multiplied by the area, i.e. . Furthermore, one should take into account the error due to bad flatfield corrections. We can derive an estimate of this quantity with this second test: we derived the statistics on several (30) sky boxes (20x20 pixels) for the J, H and Kn images, in which we tried to avoid stars. We derived, for each band, the average of the mean values and the standard deviation (). These values give an estimate for the flatfield error in each band. The total error, relative to each pixel value, includes both contributions. We derived the errors on magnitudes and colors for each bands in the following way: the integrated magnitudes (Table 5) are given by , with is the instrumental magnitude, is the zero point, and are the correction coefficients for the atmospheric and galactic extinction. The uncertainties on these last two parameters are negligible and we consider only the errors relative to and . These are independent quantities, so the error in our derived magnitude is given by
| (3) |
with and is the total flux in the area. The average errors on the integrated magnitudes are about 0.05 mag, and an average error of about on NIR colors.
There is no easily explanation for the no longer Poissonian distribution of the background noise. In the NIR images the background level is very high and subject to rapid changes: therefore even if carefull subtraction is performed residuals may still cause deviations from poissonian behaviour.
