11email: vladilo@ts.astro.it
Chemical abundances of Damped Ly Systems:
A new method is presented for recovering the abundances of Damped Ly systems (DLAs) taking into account the effects of dust depletion. For the first time, possible variations of the chemical composition of the dust are taken into account in estimating the depletions. No prior assumptions on the extinction properties of the dust are required. The method requires a set of abundances measured in the gas and a set of parameters describing the chemical properties of the dust. A large subset of these parameters is determined from interstellar observations; the others are free parameters for which an educated guess can be made. The method is able to recover the abundances of the SMC starting from SMC interstellar measurements apparently discrepant from the stellar ones. Application of the method to 22 DLAs with available [Fe/H] and [Si/Fe] measurements gives the following results: (1) the mean metallicity of the corrected data is dex, about 0.5 dex higher than that of the original data; (2) the slope of the [Fe/H] versus redshift relation is steeper for the corrected data ( dex) than for the original ones ( dex); (3) the corrected [Si/Fe] ratios are less enhanced, on average, than those found in Galactic stars of similar, low metallicity; (4) a decrease of the [Si/Fe] versus [Fe/H] ratios, expected by ”time delay” models of chemical evolution, is found for the corrected data; (5) the [Si/Fe] ratios tend to increase with redshift once corrected; (6) consistency between [Si/Fe] and [S/Zn] measurements, two independent estimators of the /Fe ratio, is found only for the corrected abundances.
Key Words.:
Galaxies: abundances, ISM, high-redshift; Quasars: absorption lines1 Introduction
High resolution spectroscopy of QSO absorption line systems is a very powerful tool for probing structures in the early universe, including galaxies in the faint end of the luminosity function. With this technique, elemental abundances can be measured in galaxies up to redshift and used to probe the early stages of chemical enrichment. In fact, abundance measurements have been obtained for a relatively large number of damped Ly systems (DLAs), the class of QSO absorbers most clearly associated with intervening galaxies (Lu et al. 1996, 1998; Pettini et al. 1997, 1999, 2000; Prochaska & Wolfe 1999; Centurión et al. 1998, 2000; Molaro et al. 2000; Petitjean et al. 2000; Prochaska et al. 2001).
Abundance measurements can be rather accurate in DLAs: column densities of H i and of metal species can easily be determined with errors dex or even dex; ionization corrections are generally negligible for most of the elements considered (Vladilo et al. 2001; see also Izotov et al. 2001). However, the final accuracy of DLA abundances can be severely affected by the effects of dust. Evidence of dust in DLAs comes from extinction and abundance studies. The reddening of QSOs lying behind DLA absorption is a clear sign of dust extinction (Pei et al. 1991; Pei & Fall 1995). Evidence of elemental depletion similar to that observed in the nearby ISM (Savage & Sembach 1996) was first reported by Pettini et al. (1994) from the behaviour of the Zn/Cr ratio in DLAs. The enhancement of the Zn/Cr ratio relative to the solar value was interpreted as being due to a different degree of incorporation into dust grains of zinc, a volatile element, and chromium, a refractory element. Similar results have been found for other pairs of elements with differing degrees of affinity with dust, e.g. Zn/Fe. Recent abundance studies give further support to the presence of dust depletion in DLAs (Hou et al. 2001, Prochaska & Wolfe 2002), indicating that abundances taken at face value are of little use in understanding the chemical properties of DLA galaxies.
Various approaches have been used to circumvent the problem of dust depletion in studies of DLAs abundances. One way is to focus on elements essentially undepleted, such as N (Lu et al. 1998, Centurión et al. 1998), O (Molaro et al. 2000, Dessauges-Zavadsky et al. 2001; Levshakov et al. 2002), S (Centurión et al. 2000), and Zn (Pettini et al. 1997, 1999; Prochaska & Wolfe 1999, 2001; Vladilo 2000). Another is to study DLAs with low dust content (Pettini et al. 2000; Molaro et al. 2000, López et al. 2002). Although these studies do not depend, essentially, on the properties of the dust, their application is limited to certain elements and to particular sub-samples of DLAs. The only way to perform a general study of DLAs abundances is to quantify the effects of dust depletion.
By comparing the abundance ratios observed in DLAs with those measured in the interstellar gas of the Galaxy it is possible to derive some indication on the depletions of DLAs. Studies of this kind show a similarity to the depletions typical of Galactic warm gas (Lauroesch et al. 1996; Kulkarni et al. 1997; Savaglio et al. 2000). In this type of work, two different types of intrinsic DLA abundances have been considered: solar abundances and abundances typical of metal-poor stars in the Milky Way. Clearly, it is rather difficult to disentangle the intrinsic abundance patterns of DLAs with this type of approach.
A method for recovering the intrinsic abundances in individual systems was presented by Vladilo (1998, hereafter Paper I). In that work the chemical composition and extinction properties of the dust were assumed to be the same as those of the dust in Galactic warm gas. The amount of dust extinction for a given level of metallicity, i.e. the dust-to-metals ratio, was allowed to vary among DLAs. The dust-to-metals ratio of individual DLAs was estimated assuming that zinc tracks the iron-peak elements and that the observed overabundances of Zn/Cr or Zn/Fe are due entirely to differential depletion. A limitation of that method is that the dust composition may actually vary in different environments, even within the Milky Way (Savage & Sembach 1996). In addition, some recent investigations indicate that zinc may not exactly follow other iron-peak elements (Primas et al. 2000; Umeda & Nomoto, 2001). According to Prochaska & Wolfe (2002), the assumptions adopted in Paper I may force the dust-corrected abundances to become closer to solar values. To overcome these limitations, a new procedure for estimating dust depletion in DLAs is presented in this paper. The equations of the procedure are based on a new expression for scaling dust depletions up or down according to changes of the physical/chemical conditions of the interstellar gas (Vladilo 2002, hereafter Paper II). This expression allows the dust chemical composition to vary according to changes of the dust-to-metals ratio and of the intrinsic abundances of the medium. With this new formulation, deviations of the intrinsic Zn/Fe ratios from solar values can be consistently accounted for. At variance with Paper I, the present method does not make any assumption concerning the extinction properties of the dust in DLAs. The method is presented in Section 2, some examples of application are described in Section 3, and the results are discussed and summarized in Section 4.
2 The method
The starting point of the method is the expression for scaling depletions up or down derived in Paper II:
| (1) |
where is the fraction in dust of the element X; the index ”medium” refers to the totality of the atoms (gas and dust); the index indicates a phase of the Galactic ISM for which can be determined empirically; the index the ISM of an external galaxy (for instance, a DLA system); Y is an element used as a reference for expressing relative abundances. The scaling law (1) is derived assuming that the abundances in the dust, , are a function of the dust-to-metals ratio, , and of the intrinsic abundances, , i.e.
| (2) |
The dust-to-metals ratio is defined as the fraction in dust of the reference element, i.e. . At variance with Paper I, the extinction properties of dust grains do not appear in this definition. In Eq. (1) the intrinsic abundances are accounted for in the term . The parameters and are dimensionless derivatives of with respect to and to , respectively. Given the function (2), the scaling law (1) is always correct for infinitesimal changes of and . For discrete variations of these parameters, the law is valid if and are constant. Comparison with the observations indicates that a set of constant parameters is able to model all the typical depletion patterns of the Galactic ISM by only varying in Eq. (1). By allowing both and to vary, the few extragalactic patterns observed so far111 Only some interstellar lines of sight to the Magellanic Clouds are currently available. can be modeled as well. We refer to Paper II for more details.
The depletion patterns that can be successfully modeled by Eq. (1) originate in different types of interstellar gas, characterized by a variety of physical conditions (e.g. cold gas vs. warm gas), metallicities (e.g. 1 vs. 0.25 of the solar level), locations (e.g., Galactic halo vs. disk), and extinction properties (e.g., strong vs. weak 217.5 nm emission bump). For these reasons we feel justified in applying the same scaling law to the ISM of distant galaxies, including DLAs.
2.1 Equations of the method
The relation between the observed and the intrinsic abundances can be derived from the Eq. (1) above and from Eq. (4) of Paper I:
| (3) |
where is the dust-to-metals ratio normalized to , [X/H]obs the abundance observed in the gas phase, [X/H]j the intrinsic abundance and .
In order to recover the intrinsic abundances we first need to determine . To do this, we use the expression
| (4) |
which can be derived by applying Eq. (3) to the generic element X and to the reference element Y. In practice, the solution of Eq. (4) requires a measurement of [X/Y]obs and an educated guess of [X/Y]j.
Once is known, we can determine the relative abundance in the medium from the expression
| (5) |
which can be derived by rearranging Eq. (4). Clearly, this second expression can be applied to elements X different from the one used in Eq. (4).
Eqs. (4) and (5) can be solved analytically only in particular cases, depending on the values of the parameters and . These equations have the general form
| (6) |
and can be solved by iterations given the coefficients and and the exponent . In general, the uniqueness of the solution is not guaranteed. If multiple solutions are present, one needs to restrict the search for the roots within a limited interval of . This interval has to be justified on physical grounds.
In the case of Eq. (4) and . The exponent can attain values higher than unity (see adopted values of in Table 1). A unique solution is found searching for the roots in the interval , where is the dust-to-metals ratio corresponding to a fraction of iron in dust of 100%. Values outside of this interval are obviously unphysical.
In the case of Eq. (5) and . As explained below, a choice of the exponent in the range allows us to probe two extreme possibilities concerning the dependence of the dust composition on the composition of the medium. For these values of the solutions of Eq. (5) are unique and there is no need to restrict the search for the roots to a particular interval of intrinsic abundances .
| Element | a | |
|---|---|---|
| Si | ||
| Mg | ||
| Mn | ||
| Cr | ||
| Fe | ||
| Ni | ||
| Zn | b | b |
a
The parameters have been determined
by comparing the fractions in dust of the warm gas with those of the cold
gas in the Galactic disk.
b
Warm disk fraction in dust not available for zinc; the adopted
values are based on the observed zinc depletions
in the cold disk and in the warm disk+halo gas scaled up or down
with relation (1).
2.2 Input parameters
To apply the procedure various sets of interstellar parameters are required. The fractions in dust and the parameters can be determined from Galactic interstellar studies, as shown in Paper II. In Table 1 we list the set of and parameters that allow one to model simultaneously all types of Galactic depletion patterns by only varying . The Galactic depletion patterns include the cold disk, warm disk, warm disk+halo, and warm halo ones, as defined by Savage & Sembach (1996)222 The depletions from Savage & Sembach (1996) have been updated according to revised values of Mg ii (Welty et al. 1999 and refs. therein) and Ni ii (Fedchak & Lawler 1999; Howk et al. 1999) oscillator strengths. Zinc has been added to the original list by including measurements of the same lines of sight selected by Savage & Sembach (Roth & Blades 1995). Solar reference values from Anders & Grevesse (1989) are adopted consistently in the present paper. .
In principle, the parameters can be determined from extragalactic interstellar observations. The preliminary study of the Small Magellanic Cloud described in Paper II indicates that the observed depletions can be reproduced for , or somewhat below unity. However, this result could be specific to the few extragalactic lines of sight investigated. Therefore, in the present work we prefer to consider as a free parameter. Luckily, an educated guess of can be made considering the physical meaning of this parameter. As shown in Paper II, . In other words, indicates the sensitivity of the abundance ratio X/Y in the dust to changes of the same ratio in the medium. The case is what one may expect on intuitive grounds: the more abundant an element is, the more atoms of that element will be available for being incorporated into the dust. However, given the complexity of the processes involving dust formation, accretion and destruction, the composition of the medium might play a secondary role in determining the composition of the dust, at least for some elements, in which case . Values do not have a special appeal from the intuitive point of view and are not supported by the interstellar study of the SMC carried out in Paper II. Based on these considerations, we adopt here or as two limiting possibilities. The diversity (similarity) between the results obtained in these two cases indicates the weakness (robustness) of the method due to the poor knowledge of the function . Given the form of the equations (3), (4) and (5), the uncertainty of will significantly affect the results only if the intrinsic abundances deviate significantly from solar ratios.
| Set | [Zn/Fe]j | ||
|---|---|---|---|
| S00 | +0.0 | 0 | 0 |
| S10 | +0.0 | 1 | 0 |
| S01 | +0.0 | 0 | 1 |
| S11 | +0.0 | 1 | 1 |
| E00 | +0.1 | 0 | 0 |
| E10 | +0.1 | 1 | 0 |
| E01 | +0.1 | 0 | 1 |
| E11 | +0.1 | 1 | 1 |
2.2.1 The intrinsic [Zn/Fe] ratio
Interstellar studies indicate that the fraction of zinc in dust is relatively small while iron is heavily depleted (Savage & Sembach 1996). On the other hand, studies of Galactic stars indicate that the zinc abundance nearly tracks that of iron-peak elements down to metallicities [Fe/H] dex (Sneden et al. 1991). Should zinc track iron in DLAs precisely (i.e., [Zn/Fe]j =0), the [Zn/Fe] ratio would be a perfect indicator of depletion and an optimal choice for determining the dust-to-metals ratio with Eq. (4). However, Galactic stars show a significant enhancement of the ratio [Zn/Fe] at metallicities [Fe/H] dex (Primas et al. 2000). This result suggests a difference in the nucleosynthetic origin of zinc and iron (Umeda & Nomoto 2002) and makes the use of the [Zn/Fe] ratio as an indicator of depletion less reliable (Prochaska & Wolfe 2002). The metallicities of DLAs are generally higher than dex. In this range the [Zn/Fe] ratio in Galactic stars is consistent with the solar value within the errors, with a scatter of about dex at 1 level and tentative evidence for an enhancement of dex. Therefore, we may expect that the enhancement of the intrinsic ratio [Zn/Fe]j in DLAs is little or negligible in the same range of metallicities. The DLAs with the lowest metallicity and dust content should reveal an intrinsic enhancement, if present. The best example at our disposal, the DLA at towards Q0000-26, with [Zn/H] dex (Molaro et al. 2000), shows very little evidence for [Zn/Fe] enhancement. In the rest of this paper we consider [Zn/Fe]j as an input parameter to which we assign values 0.0 or +0.1 dex in the solution of our problem.
2.3 Abundances of individual velocity components
The absorption spectrum of DLAs is often characterized by the presence of multiple components. These may be associated with parcels of gas located in different regions of the intervening galaxy. The method presented here can be applied to the analysis of individual components. However, while the velocity components of metal lines may be resolved in high resolution spectra, those of H i lines are not. This implies that Eqs. (4) and (5) can be applied to individual components, but Eqs. (3) cannot. In other words, relative abundances and dust-to-metals ratios can be obtained for individual components. The absolute abundances can be corrected for dust effects only as far as the integrated absorption is concerned (i.e. the total column densities inside the DLA). This contraint is set by the nature of the measurements and not by a theoretical limitation of the method.
3 Applications of the method
Some examples of application of the method are presented in this section. First, the method is tested in a nearby galaxy, namely the Small Magellanic Cloud. The SMC is the only external galaxy with several accurate interstellar measurements available and with intrinsic abundances known from stellar observations. We show that the method is successful in recovering the intrinsic SMC abundances, a result that gives us more confidence in applying the same procedure in high redshift DLAs with unknown stellar abundances. In Section 3.2 the method is used to correct [Fe/H] metallicities and [Si/Fe] ratios in DLAs.
In all the applications presented here Fe is adopted as the reference element Y. The Zn/Fe ratio is used to determine the normalized dust-to-metals ratio with Eq. (4). Errors in are estimated by taking into account the measurement errors of the Zn ii and Fe ii column densities. The dust-corrected abundances are obtained by solving Eq. (5) analytically for and . The errors of the dust-corrected abundances shown in Table 3 and in the figures are derived from the propagation of the errors and of the [X/Fe]obs or [Fe/H]obs errors. The adopted parameters and derived from interstellar studies are listed in Table 1. The sets of educated guesses of the [Zn/Fe]j and parameters are shown in Table 2. Since we are interested in deriving the absolute abundance of the reference element, [Fe/H], the analysis of individual velocity components is not considered (see Section 2.5).
3.1 SMC interstellar lines of sight
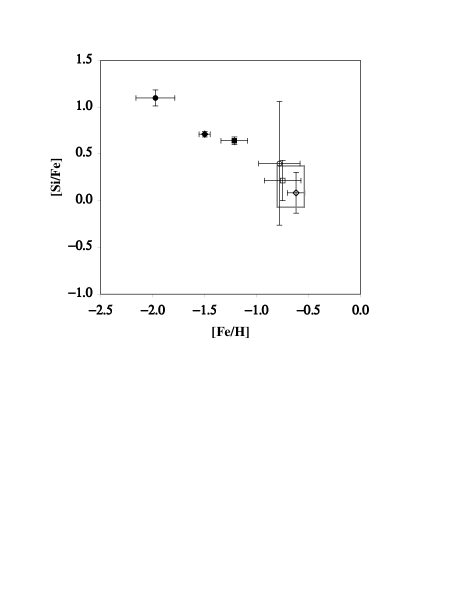
The interstellar lines of sight of the SMC considered here are those towards the stars Sk 78, Sk 108, and Sk 155, for which accurate abundance measurements are available (see Paper II). In Fig. 1 we plot the [Si/Fe] versus [Fe/H] results for these three SMC lines of sight. For the sake of clarity, only one set of Table 2 input parameters is considered in the figure. The uncorrected abundances (filled symbols) suggest the existence of a spread of the [Fe/H] metallicity and of the [Si/Fe] ratio among the different lines of sight. However, none of them is in agreement with the abundances representative of the SMC (box in the figure). The corrected ratios (open symbols) yield instead consistent results, all in good agreement with the intrinsic SMC ratios. Since the three different lines of sight are treated independently, each with its own value of the parameter, it is remarkable that they give consistent results only when the dust correction is applied.
Similar results are obtained from the study of the [Mg/Fe], [S/Fe], [Cr/Fe], [Mn/Fe], and [Ni/Fe] ratios in the same SMC lines of sight. These different ratios are corrected independently of each other, since each element X has its own value of . Therefore, it is remarkable that each one of them matches the corresponding SMC [X/Fe] ratio only when the dust correction is applied. The results are not significantly affected by the choice of the input parameters listed in Table 2.
In summary, the interstellar abundances not corrected for dust depletion do not match the intrinsic SMC abundances. The corrected abundances yield consistent results for different elements and different lines of sight, all in agreement with the intrinsic SMC abundances. Most of the results are modestly affected by the choice of the [Zn/Fe]j and parameters.
3.2 Dust-corrected abundances in DLAs
Iron is often used as a tracer of metallicity in DLAs because many Fe ii transitions with different oscillator strengths can be detected in a broad range of absorption redshift. Silicon is the only -capture element which has been extensively observed in DLAs, with over 30 measurements available. Therefore, the Si/Fe ratio is the only abundance ratio of -capture over iron-peak elements for which a statistically significant sample can be analyised. As a first application of the new method to DLAs we present here a list of dust-corrected [Fe/H] and [Si/Fe] abundances. Only DLAs with good quality measurements of H i, Si ii, Fe ii, and Zn ii have been considered. The Zn data are required to derive the dust-to-metals ratio . The resulting sample of 22 systems is shown in Table 3 together with the relevant references for the adopted abundances. The [Fe/H] and [Si/Fe] measurements with and without dust correction are compared in the table. Four sets of corrected abundances are shown, corresponding to the sets of input parameters S00, S11, E00, and E11 in Table 2. The results are not strongly affected by the choice of these parameters.
The values of obtained from the [Zn/Fe] data indicate that the level of depletion is always smaller than that found in the cold gas of the Galactic disk. In fact, the median value of the sample is 0.74 and 0.61 for [Zn/Fe] and dex, respectively. These values of imply that the iron fraction in dust in DLAs is lower, on average, than that in Galactic warm halo gas, (Paper II). The broad similarity between depletion in DLAs and depletions in warm halo gas found in previous work (Lauroesch et al. 1996; Savaglio et al. 2000) is therefore confirmed by the present analysis. In the rest of this section we present some general conclusions derived from the dust-corrected sample of Table 3.
3.2.1 Metallicity
As in the case of SMC interstellar data, also in DLAs the use of [Fe/H] without dust correction can lead to a severe underestimate of the real metallicity of the system. As shown in Table 3, the difference between between original and corrected measurements can be as high as 1 dex in some cases. The statistical properties of the sample are severely affected by this effect. For instance, the mean metallicity of the original measurements is dex, but that of the corrected data is dex. Also metallicity versus redshift studies are affected. For instance, a linear regression of [Fe/H] versus for the sample of Table 3 yields slopes333 The slope is obtained from the least-squares method and is defined as , where and are the mean values of the sample. and for the data with and without dust correction, respectively. The slope is steeper for the corrected data, as expected if dust depletion is more important at higher metallicities. The slope of the corrected metallicities is similar to that found by Savaglio et al. (2000) and by Vladilo et al. (2000). In the former work a large sample of absorbers was corrected for dust effects assuming that the intrinsic abundance ratios in DLAs are solar. In the work by Vladilo et al. (2000) the uncorrected [Zn/H] ratio was used as a dust-free indicator of metallicity. While the interpretation of any possible trend between metallicity and redshift is very complex, it is clear that studies of this type based on [Fe/H] data not corrected for dust should be considered with caution.
3.2.2 [Si/Fe] abundance ratios
The abundance ratio of -capture over iron-peak elements is an indicator of chemical evolution. In Galactic stars of low metallicity the /Fe ratio is enhanced relative to the solar value and decreases with increasing [Fe/H] (e.g. Ryan et al. 1996). This behaviour can be naturally explained by models of galactic evolution in terms of a ”time delay” between the enrichment of elements and that of Fe-peak elements (e.g. Matteucci 1991 and refs. therein).
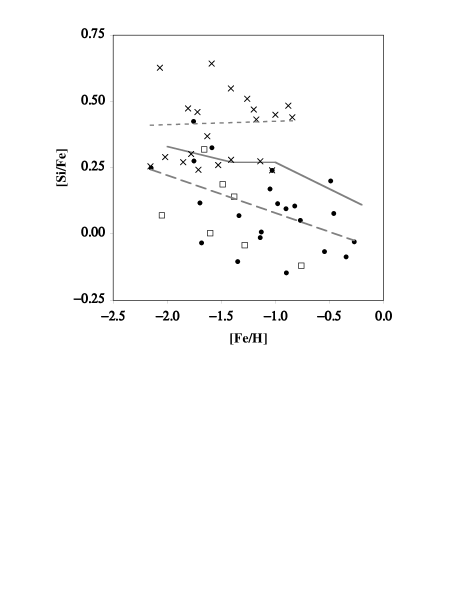
Observed trends of /Fe ratios in DLAs, particularly the Si/Fe ratio, have been used to characterize the evolutionary status of DLA galaxies (Lu et al. 1996; Prochaska & Wolfe 1999, 2002; Pettini et al. 2000; Molaro et al. 2000). The [Si/Fe] ratios taken at face value are significantly enhanced at low metallicity ( dex), and this fact was originally taken as an indication that DLAs may be undergoing a chemical evolution similar to that of a young Milky Way (Lu et al. 1996). Subsequent work on dust free /Fe ratios (Centurión et al. 2000; Molaro et al. 2000) and on dust-corrected Si/Fe ratios (Paper I) has seriously questioned this point of view. The enlargement of the abundance data base gives now a convincing evidence that the [Si/Fe] enhancement is largely due to dust depletion, as shown for instance by the behaviour of the [Si/Fe] versus [Zn/Fe] ratios (Prochaska & Wolfe 2002). In any case, as we show in Fig. 2, both the original [Si/Fe] measurements and the corrected ones indicate a behaviour of DLAs different from that typical of metal-poor Galactic stars. In fact, most of the non-corrected data lie above the ”midmean vector” representative of Galactic stars (continuous line; Ryan et al. 1996), while most of the corrected data lie below. This is true for all the different sets of input parameters considered in Table 2. The filled circles in Fig. 2 indicate the data corrected with the set of parameters E11. Very similar results are obtained for the other sets of parameters with enhanced [Zn/Fe]j ratio (E00, E01, E10). The corrected data lie even more below the Galactic stars adopting the sets of parameters with solar [Zn/Fe]j ratio (S00, S01, S10, S11).
The amount of [Si/Fe] enhancement at the lowest DLA metallicities ( dex) is a probe of the earliest stages of the chemical evolution. From the analysis of the [Si/Fe] versus [Si/H] data, Prochaska & Wolfe (2002) find evidence for a [Si/Fe] plateau ([Si/Fe] dex) at [Si/H] dex, that they attribute to the lack of dust depletion at low metallicities. The present analysis indicates that 2 out of 6 DLAs with metallicities dex have non-negligible [Si/Fe] depletion (Table 3). This indicates that some systems may be depleted even in the Prochaska & Wolfe’s [Si/Fe] plateau.
In addition to the degree of enhancement, the possible presence of a slope in the [Si/Fe] data gives important information on the chemical evolution. Independent of the specific prescriptions of the models, the time delay between the injection of elements and that of Fe-peak elements implies that the /Fe ratio must decrease with increasing [Fe/H]. The [Si/Fe] measurements in DLAs taken at face value do not show such a trend. The untilted dotted line in Fig. 2 represents the linear regression through the non-corrected data. On the other hand, the corrected ratios do show evidence for a decrease of [Si/Fe] with [Fe/H]. As an example, the tilted dashed line in Fig. 2 represents the linear regression through the data corrected with the E11 parameters. The slope resembles that of metal-poor stars, even if the ratios are lower on the average.
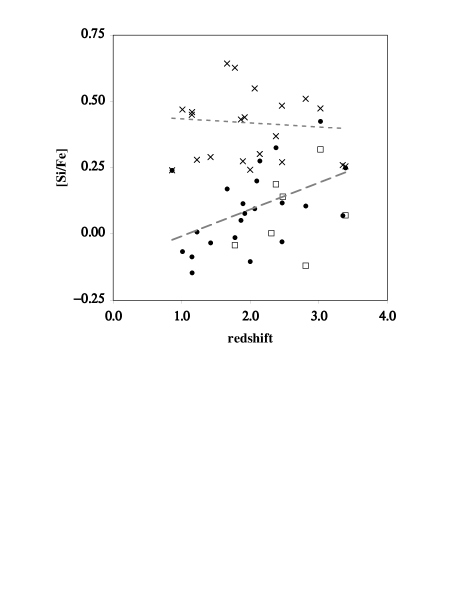
Once corrected for dust depletion, the [Si/Fe] ratios show a tendency to increase with redshift which is not seen in the original measurements (Fig. 3). The typical value is [Si/Fe] dex at and increases up to [Si/Fe] dex at , with a large dispersion at all redshifts. This possible trend of decreasing [Si/Fe] with cosmic time is consistent with the general expectations of the time delay models. Since DLAs probably represent an heterogeneous collection of different types of galaxies, the interpretation of this result is quite complex and will be considered in a separate work. In any case, the fact that only the dust-corrected ratios show the expected trends is rather encouraging.
An important support to the validity of the correction procedure comes from the comparison with [S/Zn] data. Since S and Zn are almost unaffected by depletion, the S/Zn ratio can be considered a sort of dust free /Fe ratio (Centurión et al. 2000). If the method presented here works properly, we expect that the corrected [Si/Fe] ratios and the non-corrected [S/Zn] ratios show a similar behaviour.444 Apart from little differences that may be present if S does not track perfectly Si, and Zn does not follow exactly Fe. The limited sample of [S/Zn] data (Lu et al. 1996; Kulkarni et al. 1996; Molaro et al. 1998; Prochaska & Wolfe 1999; Centurión et al. 2000) shown as open squares in Figs. 2 and 3, confirms this expectation. The non-corrected [Si/Fe] ratios are generally inconsistent with the [S/Zn] data.
| Identifier | [Zn/H]obs | [Fe/H]obs | [Si/Fe]obs | Refsb | [Fe/H] | [Fe/H] | [Si/Fe] | [Si/Fe] | |
|---|---|---|---|---|---|---|---|---|---|
| S00 & S11 | E00 & E11 | S00 & S11 | E00 & E11 | ||||||
| 0000-263 | 3.3901 | -2.05 0.09 | -2.16 0.09 | 0.26 0.04 | Mol&00 | -2.05 0.10 | -2.15 0.09 | 0.15 0.07 | 0.25 0.05 |
| -2.15 0.09 | 0.15 0.07 | 0.25 0.05 | |||||||
| 0149+33 | 2.1400 | -1.65 0.14 | -1.78 0.10 | 0.30 0.05 | P&W99 | -1.65 0.15 | -1.75 0.12 | 0.18 0.12 | 0.28 0.08 |
| -1.75 0.12 | 0.18 0.12 | 0.28 0.08 | |||||||
| 0201+365 | 2.4620 | -0.27 0.06 | -0.88 0.04 | 0.48 0.01 | P&W96 | -0.09 0.10 | -0.30 0.08 | -0.07 0.01 | -0.01 0.03 |
| -0.27 0.09 | -0.11 0.21 | -0.03 0.05 | |||||||
| 0302-223 | 1.0095 | -0.56 0.12 | -1.20 0.12 | 0.47 0.06 | Pet&00 | -0.36 0.17 | -0.58 0.15 | -0.08 0.03 | -0.04 0.06 |
| -0.55 0.16 | -0.14 0.35 | -0.07 0.12 | |||||||
| 0347-383 | 3.0250 | -1.66 0.11 | -1.81 0.12 | 0.47 0.07 | Pro&01 | -1.66 0.15 | -1.76 0.14 | 0.32 0.11 | 0.42 0.10 |
| -1.76 0.14 | 0.32 0.11 | 0.42 0.10 | |||||||
| 0454+039 | 0.8597 | -1.01 0.11 | -1.03 0.07 | 0.24 0.10 | Pet&00 | -1.01 0.09 | -1.03 0.07 | 0.22 0.11 | 0.24 0.10 |
| -1.03 0.07 | 0.22 0.11 | 0.24 0.10 | |||||||
| 0515-4414 | 1.1510 | -0.99 0.11 | -1.72 0.22 | 0.46 0.27 | dlV&00 | -0.70 0.44 | -0.97 0.37 | -0.08 0.09 | -0.08 0.17 |
| -0.90 0.44 | -0.20 2.52 | -0.15 1.08 | |||||||
| 0528-2505 | 2.8110 | -0.76 0.12 | -1.26 0.15 | 0.51 0.12 | Lu&96 | -0.67 0.26 | -0.83 0.22 | 0.01 0.14 | 0.11 0.17 |
| -0.82 0.23 | 0.01 0.15 | 0.11 0.13 | |||||||
| 0841+129 | 2.3745 | -1.49 0.10 | -1.63 0.17 | 0.37 0.15 | P&W99 | -1.49 0.23 | -1.59 0.20 | 0.23 0.22 | 0.33 0.18 |
| -1.59 0.20 | 0.23 0.22 | 0.33 0.18 | |||||||
| 1104-1805 | 1.6616 | -1.02 0.01 | -1.59 0.02 | 0.64 0.03 | Lop&99 | -0.88 0.05 | -1.07 0.04 | 0.06 0.03 | 0.16 0.03 |
| -1.05 0.04 | 0.08 0.06 | 0.17 0.03 | |||||||
| 1117-1329 | 3.3511 | -1.24 0.10 | -1.53 0.09 | 0.26 0.06 | Per&02 | -1.23 0.13 | -1.34 0.12 | -0.03 0.10 | 0.07 0.10 |
| -1.34 0.12 | -0.03 0.10 | 0.07 0.10 | |||||||
| 1210+1731 | 1.8918 | -0.88 0.10 | -1.14 0.12 | 0.27 0.07 | Pro&01 | -0.87 0.14 | -0.98 0.14 | 0.01 0.10 | 0.11 0.10 |
| -0.98 0.14 | 0.01 0.09 | 0.11 0.10 | |||||||
| 1215+33 | 1.9990 | -1.27 0.08 | -1.71 0.09 | 0.24 0.06 | P&W99 | -1.21 0.14 | -1.35 0.12 | -0.18 0.06 | -0.10 0.08 |
| -1.35 0.12 | -0.20 0.06 | -0.10 0.08 | |||||||
| 1223+178 | 2.4661 | -1.60 0.10 | -1.85 0.10 | 0.27 0.02 | Pro&01 | -1.59 0.11 | -1.70 0.11 | 0.02 0.04 | 0.12 0.04 |
| -1.70 0.11 | 0.02 0.04 | 0.12 0.04 | |||||||
| 1247+267 | 1.2232 | -1.04 0.26 | -1.41 0.13 | 0.28 0.16 | Pet&99 | -1.01 0.37 | -1.13 0.32 | -0.09 0.27 | 0.01 0.31 |
| -1.13 0.33 | -0.09 0.23 | 0.01 0.30 | |||||||
| 1331+170 | 1.7764 | -1.28 0.05 | -2.07 0.04 | 0.63 0.00 | P&W99 | -0.94 0.07 | -1.24 0.06 | -0.02 0.00 | 0.01 0.01 |
| -1.14 0.07 | -0.06 0.45 | -0.01 0.24 | |||||||
| 1351+318 | 1.1491 | -0.36 0.16 | -1.00 0.13 | 0.45 0.16 | Pet&99 | -0.16 0.33 | -0.38 0.26 | -0.09 0.08 | -0.05 0.15 |
| -0.35 0.30 | -0.16 0.91 | -0.09 0.30 | |||||||
| 1354+258 | 1.4200 | -1.60 0.14 | -2.02 0.11 | 0.29 0.16 | Pet&99 | -1.55 0.25 | -1.69 0.21 | -0.12 0.18 | -0.03 0.21 |
| -1.68 0.22 | -0.13 0.17 | -0.03 0.21 | |||||||
| 2206-199A | 1.9200 | -0.39 0.10 | -0.84 0.10 | 0.44 0.02 | P&W97 | -0.32 0.11 | -0.47 0.10 | -0.02 0.02 | 0.08 0.03 |
| -0.46 0.11 | -0.02 0.02 | 0.08 0.02 | |||||||
| 2230+025 | 1.8642 | -0.70 0.09 | -1.18 0.09 | 0.43 0.02 | P&W99 | -0.63 0.10 | -0.78 0.09 | -0.04 0.03 | 0.05 0.04 |
| -0.77 0.10 | -0.05 0.02 | 0.05 0.03 | |||||||
| 2231-0015 | 2.0662 | -0.86 0.10 | -1.41 0.12 | 0.55 0.07 | P&W99 | -0.74 0.17 | -0.92 0.15 | 0.00 0.07 | 0.10 0.09 |
| -0.90 0.16 | 0.00 0.15 | 0.10 0.07 | |||||||
| 2359-0216 | 2.0950 | -0.75 0.10 | -1.67 0.10 | 0.90 0.03 | P&W99 | -0.31 0.12 | -0.64 0.12 | 0.05 0.01 | 0.12 0.03 |
| -0.49 0.13 | 0.17 1.00 | 0.20 0.68 |
a When necessary, the column densities of the literature have been revised
using the oscillator strengths given by Welty et al. (1999).
b References for the H i, Si ii, Fe ii, and Zn ii
column densities, with the following exceptions:
H i in Q0000-26 and Q2231-0015 (Lu et al. 1996);
Fe ii in Q0841+129 (Centurión et al. 2000);
Zn ii in Q0347-383 (Levshakov et al. 2002).
c For each system, the values in the first row are relative to the sets of
parameters S00 or E00; the values in the second row to the sets S11 or E11;
the corrected [Fe/H] ratios are equal in the cases S00 and S11; see Table 2.
References
dlV&00: de la Varga et al. 2000;
Lóp&99: López et al. 1999;
Lu&96: Lu et al. 1996;
Mol&00: Molaro et al. 2000;
Pér&02: Péroux et al. 2002;
Pet&97: Pettini et al. 1997;
Pet&99: Pettini et al. 1999;
Pet&00: Pettini et al. 2000;
P&W96: Prochaska & Wolfe 1996;
P&W97: Prochaska & Wolfe 1997; P&W99: Prochaska & Wolfe 1999;
P&W00: Prochaska & Wolfe 2000; Pro&01: Prochaska et al. 2001.
4 Discussion and summary
Chemical abundances of DLAs probe the effects of nucleosynthesis in high H i density regions of the universe seen at different cosmic epochs throughout a considerable fraction of the Hubble time. However, disentangling the effects of nucleosynthesis from those of dust depletion is a rather difficult task. In this work a new method has been presented for quantifying dust effects, with the aim of recovering the intrinsic abundances starting from the observed ones. There are several important differences with respect to the original method presented in Paper I and previous work on the same subject.
The first difference concerns the definition of the dust-to-metals ratio. In Paper I this was defined in terms of extinction per unit level of metallicity, with the aim of estimating indirectly the extinction of DLAs from the elemental depletions measured in each system. The broad agreement of such indirect estimates with the direct, but rather uncertain, estimates obtained from QSO reddening studies (Pei et al. 1991) is a positive test of consistency of the results obtained in Paper I. However, in order to compare these two types of estimates it is necessary to assume that the extinction is proportional to the amount of dust present in the system. This assumption is risky, since the extinction is also determined by the geometry and size distribution of the dust grains. The present work focuses only on the abundances in the dust and in the medium (gas plus dust). In order to avoid any assumption on the extinction of the dust, we have defined the dust-to-metals ratio as the fraction of atoms in dust form of an element Y chosen as a reference, i.e. .
The second difference is the way that elemental depletions are scaled up or down as a function of the dust-to-metals ratio. In the work by Kulkarni et al. (1997) and in Paper I the dust-to-metals ratio was allowed to change, but the abundances in the dust were kept constant. In this case, the fractions in dust of all elements are scaled up or down together. Therefore, all fractions in dust are proportional to that of the reference element, i.e. . In the present work the fraction in dust of various elements have different dependence on , according to the general law . This law has been derived and calibrated in Paper II and is able to reproduce all the types of depletion patterns observed in the Milky Way interstellar gas (Savage & Sembach 1996) with a single set of parameters.
The third difference is that, for the first time, elemental depletions are allowed to vary also as a function of the overall abundances of the medium. As shown in Paper II, the dependence of the fraction in dust on the intrinsic abundances must be of the type . The introduction of the parameter allows us to consider different behaviours of the dust composition. When , the composition of the dust does not vary with the composition of the medium. This extreme case could be valid, for instance, if the number ratio of two elements in the dust is uniquely determined by the capability of these two elements to have chemical bonds. In general, however, we may expect that the abundance ratio X/Y in the dust will track the abundance ratio X/Y in the medium, in which case . By considering both cases and we can take into account very different behaviours of the dust composition with respect to changes of the overall abundances, without entering into the details of the complex physical processes of dust formation, accretion and destruction.
As in Paper I, the present method can be applied to individual DLA systems. If the quality of the observational data is good enough, the method can be used for studying the abundances of distinct velocity components inside a given DLAs. The main steps of the procedure for recovering intrinsic abundances can be summarized as follows. First, the dust-to-metals ratio is derived with Eq. (4). The most natural choice for the [X/Y] ratio to be used in that equation is the [Zn/Fe] ratio. In practice, the dust-to-metals ratio is derived from the observed [Zn/Fe] value and an educated guess of the intrinsic [Zn/Fe] value. Since the equations of the new method take into account the dependence of the abundances in the dust on the abundances in the medium, possible changes of the intrinsic [Zn/Fe] ratio in DLAs can now be treated self-consistently. Therefore the unknown value of the intrinsic [Zn/Fe] ratio is now considered as an input parameter which, at variance with Paper I, may also assume values different from zero. At this point the abundances of elements other than Zn can be recovered from the observed ones by means of Eqs. (3) and (5). The dust-corrected abundances can be obtained for different sets of input parameters. In this way, we can test the stability of the results for different values of the parameter and of the intrinsic [Zn/Fe] ratio.
The new method has been applied to correct the few existing interstellar abundances measured with accuracy in a nearby galaxy, namely the SMC. The results of this exercise support the validity of the procedure. In fact, for all the abundance ratios considered (Fe/H, Mg/Fe, Si/Fe, S/Fe, Cr/Fe, Mn/Fe, and Ni/Fe) the corrected interstellar abundances are in agreement with the intrinsic SMC abundances (known from stellar data). The method yields consistent results for the different lines of sight considered. The importance of the dust correction procedure is illustrated by the fact that the non-corrected interstellar data would indicate an SMC metallicity , a strong enhancement of the [/Fe] ratios, and a high degree of inhomogeneity of the SMC. All these indications are contradicted by stellar data.
The successful results obtained for a low-metallicity galaxy such as the SMC are encouraging since the final goal of the method is recovering the abundances of DLA systems, also characterized by a low metallicity level. There are other reasons why we feel justified in applying the dust correction method to DLAs systems. In fact, the adopted scaling law (Eq. 1) can successfully model depletion patterns originated in a variety of interstellar environments, with different physical conditions (e.g. cold vs. warm), locations (e.g. Galactic halo vs. disk; SMC), and extinction properties (e.g., strong vs. weak 217.5 nm emission bump).
The results obtained by applying the present method to the sample of DLAs with available H i, Si ii, Fe ii, and Zn ii measurements can be summarized as follows.
The mean metallicity of the sample is dex for the dust-corrected data, significantly higher than that of the original data, dex. The difference between observed and corrected metallicities can be as high as 1 dex in some cases. Also the [Fe/H] versus redshift relation in DLAs is affected by dust effects, the slope being and for the data with and without dust correction, respectively.
Also the Si/Fe ratio, the most frequently measured /Fe ratio in DLAs, is significantly affected by depletion. Most of the dust-corrected [Si/Fe] ratios lie below the median values representative of Galactic stars. The [Si/Fe] enhancement at low metallicities ([Fe/H] dex) is typically [Si/Fe] dex. This value is somewhat lower than the [Si/Fe] dex plateau of the original [Si/Fe] data found by Prochaska & Wolfe (2002) at the same metallicities, suggesting that some depletion is present also in that plateau.
Possible trends of [Si/Fe] versus [Fe/H] and versus redshift are also affected by depletion effects. The corrected [Si/Fe] data decrease with increasing [Fe/H] and increase with . Both trends are qualitatively consistent with the expectations of the time delay between the injection of -capture elements and that of Fe-peak elements, predicted by models of chemical evolution. The uncorrected [Si/Fe] ratios do not show such trends.
An important test of the dust correction method is provided by the comparison between Si/Fe and S/Zn data. In fact, the S/Zn ratio is an indicator of the /Fe ratio which does not require dust correction to be applied since both S and Zn are essentially undepleted in the interstellar gas. The [Si/Fe] ratios show a behaviour similar to that of the [S/Zn] ratios only if the corrections are applied. This result supports the validity of the method.
A detailed interpretation of the intrinsic DLA abundances is quite complex since DLAs represent a heterogeneous, and probably biased, collection of interstellar regions associated with different types of galaxies. A detailed comparison of the dust-corrected abundances with the predictions of chemical evolution models of different types of galaxies will be presented in a separate paper (Calura et al. 2002).
Acknowledgements.
I wish to thank Irina Agafonova for providing routines for the solution of Eq. (6). The data for the DLA system towards BR 1117-1329 have been kindly provided by Céline Péroux and collaborators in advance of publication.References
- (1) Anders, E., & Grevesse, N. 1989, Geochim. Cosmochim. Acta, 53, 197
- (2) Calura, F., Matteucci, F., & Vladilo, G. 2002, submitted to MNRAS
- (3) Centurión, M., Bonifacio, P., Molaro, P., & Vladilo, G. 1998, ApJ, 509, 620
- (4) Centurión, M., Bonifacio, P., Molaro, P., & Vladilo, G. 2000, ApJ, 536, 540
- (5) de la Varga, A., Reimers, D., Tytler, D., Barlow, T., & Burles, S. 2000, A&A, 363, 69
- (6) Dessauges-Zavadsky, M., D’Odorico, S., McMahon, R. G., et al. 2001, A&A, 370, 426
- (7) Fedchak, J.A., & Lawler, J.E. 1999, ApJ, 523, 734
- (8) Hou, J.L., Boissier, S., Prantzos, N. 2001, A&A, 370, 23
- (9) Howk, J.C., & Savage, B.D., & Fabian, D. 1999, ApJ, 525, 253
- (10) Izotov, Y.I., Schaerer, D., & Charbonnel, C. 2001, ApJ, 549, 878
- (11) Kulkarni, V. P., Huang, K., Green, R.F., et al. 1996, MNRAS, 279, 197
- (12) Kulkarni, V.P., Fall, S.M., & Truran, J.W. 1997, ApJ, 484, L7
- (13) Lauroesch, J.T., Truran, J.W., Welty, D.E., & York, D.G. 1996, PASP, 108, 641
- (14) Levshakov, S. A., Dessauges-Zavadsky, M., D’Odorico, S., & Molaro, P. 2002, ApJ, 565, 696
- (15) López, S., Reimers, D., D’Odorico, S., & Prochaska, J. 2002, A&A, 385, 778
- (16) Lu, L., Sargent, W.L.W., & Barlow, T.A., Churchill, C.W., & Vogt, S. 1996, ApJS, 107, 475
- (17) Lu, L., Sargent, W.L.W., & Barlow, T.A. 1998, AJ, 115, 55
- (18) Matteucci, F. 1991, in SN1987A and other Supernovae, eds. I.J. Danziger & K.Kjar, ESO Proc.37, (Garching:ESO), 703
- (19) Molaro, P., Bonifacio, P., Centurión, et al. 2000, ApJ, 541, 54
- (20) Molaro, P., Centurión, & Vladilo, G. 1998, MNRAS, 293 L37
- (21) Pei, Y.C., & Fall, S.M. 1995, ApJ, 454, 69
- (22) Pei, Y.C., Fall, S.M., & Bechtold, J. 1991, ApJ, 378, 6
- (23) Péroux, C., Petitjean, P., Aracil, B., & Srianand, R. 2002, submitted to New Astronomy
- (24) Petitjean, P., Srianand, R., & Ledoux, C. 2000, A&A, 64, L26
- (25) Pettini, M., Ellison, S.L., Steidel, C.C., & Bowen, D.V. 1999, ApJ, 510, 576
- (26) Pettini, M., Ellison, S.L., Steidel, C.C., Shapley, A.E., & Bowen, D.V. 2000, ApJ, 532, 65
- (27) Pettini, M., King, D.L., Smith, L.J., & Hunstead, R.W. 1997, ApJ, 478, 536
- (28) Pettini, M., Smith, L.J., Hunstead, R.W. & King, D.L. 1994, ApJ, 426, 79
- (29) Primas, F., Brugamyer, E., Sneden, C., et al. 2000, The First Stars, ed. A. Weiss, T.G. Abel, & V. Hill, (Berlin:Springer), 51
- (30) Prochaska, J.X., & Wolfe, A.M. 1996, ApJ, 470, 403
- (31) Prochaska, J.X., & Wolfe, A.M. 1999, ApJS, 121, 369
- (32) Prochaska, J.X., & Wolfe, A.M. 2000, ApJ, 533, L5
- (33) Prochaska, J.X., & Wolfe, A.M. 2002, ApJ, 566, 68
- (34) Prochaska, J. X., Wolfe, A. M., Tytler, D., et al. 2001, ApJS, 137, 21
- (35) Roth, K.C., & Blades, C., 1995, ApJ, 445, L95
- (36) Russell, S.C., & Dopita, M.A. 1992, ApJ, 384, 508
- (37) Ryan , S.G., Norris, J.E., & Beers, T.C. 1996, ApJ, 471, 254
- (38) Savage, B.D., & Sembach, K.R. 1996, ARA&A, 34, 279
- (39) Savaglio, S., Panagia, N., & Stiavelli, M. 2000, Cosmic Evolution and Galaxy Formation, eds. J.Franco et al., ASP Conf. Ser. 215, 65
- (40) Sneden, C., Gratton, R., & Crocker, D.A. 1991, A&A, 246, 354
- (41) Umeda, H., & Nomoto, K. 2002, ApJ, 565, 385
- (42) Vladilo, G. 1998, ApJ, 493, 583 (Paper I)
- (43) Vladilo, G. 2002, ApJ, 569, 295 (Paper II)
- (44) Vladilo, G., Bonifacio, P., Centurión, M., & Molaro, P. 2000, ApJ, 543, 24
- (45) Vladilo, G., Centurión, M., Bonifacio, P., & Howk, J.C. 2001, ApJ, 557, 1007
- (46) Welty, D.E., Hobbs, L.M., Lauresch, J.T., et al. 1999, ApJS, 124, 465
- (47) Welty, D.E., Lauroesch, J.T., Blades J.C., Hobbs, L.M., & York, D.G. 1997, ApJ, 489, 672
- (48) Welty, D.E., Lauroesch, J.T., Blades J.C., Hobbs, L.M., & York, D.G. 2001, ApJ, 554, L75