A Chandra Observation of the Luminous NLS1 1H 0707495
Abstract
We present preliminary results from a long Chandra HETG observation of the luminous Narrow-line Seyfert 1 galaxy 1H 0707495. We find a complex X-ray spectrum comprised of a two-component continuum with superimposed emission and absorption lines. The short time scale X-ray variability is different than observed in other AGN: the soft X-rays vary markedly less than the hard X-rays. This behavior is similar to that of high-state Galactic black holes. We also investigated the long time scale variability, and discovered an apparent bimodal flux distribution. We postulate that the bimodality is the signature of the radiation pressure instability, and note that this instability may be expected in luminous NLS1s.
1 Introduction
Narrow-line Seyfert 1 galaxies (NLS1s) are subclass of active galaxies (AGN) identified by their optical emission-line properties. They have narrow permitted lines (H FWHM ), weak forbidden lines (O III/H), and they frequently show strong optical Fe II.
New attention was focused on this class of AGN when it was discovered that their X-ray spectrum, both in the soft X-rays observed by ROSAT (Boller, Brandt & Fink 1996), and in the hard X-rays observed by ASCA (e.g. Leighly 1999b and references therein), is significantly steeper than that of Seyfert 1 galaxies with broad optical lines. It was also discovered that NLS1s show more rapid X-ray variability than broad-line objects, and sometimes large amplitude flares are seen (e.g. Leighly 1999a).
The origin of these characteristic properties is not yet known. Early on, it discovered that the NLS1 RE 1034+39 had an X-ray spectrum composed of a strong soft excess and a weak steep power law that strongly resembled that of Galactic black hole objects in their high state. From this, Pounds, Done, & Osborne (1996) proposed that NLS1s are high-state active galaxies. Since then, it was recognized that the X-ray properties are correlated with the optical/UV properties (the so-called Eigenvector 1; e.g. Boroson & Green 1992), and all may be driven by a high accretion rate relative to Eddington.
While this scenario describes the general properties of the X-ray spectrum and variability well in a schematic way, there are also a number of uncertainties:
-
•
The strong soft excess in Galactic black hole candidates can be directly interpreted as mildly Comptonized blackbody emission from an accretion disk around a non-rotating black hole. This simple model is problematic for NLS1s, as the temperature expected from the standard disk model and large black hole mass is far too low to be seen in the X-ray band.
-
•
Many Galactic black holes in the soft state have variable hard X-rays and reduced soft X-ray variability (e.g. Churazov, Gilfanov, & Revnivtsev 2001). But NLS1s most often show little color variability, and most frequently their spectra become a little softer when brighter (e.g. Leighly 1999a).
-
•
The X-ray properties of NLS1s do not seem to be uniform as a class (Leighly 1999b). While most objects show a soft excess, the fraction of energy in that component compared with the power law spans a wide range, and soft excess strength is correlated with variability amplitude. Furthermore, several of the objects with the strongest soft excess have a peculiar absorption feature near 1 keV (Leighly et al. 1997).
-
•
NLS1s are common in soft X-ray selected samples (e.g. Grupe et al. 1999). This implies that they are strong soft X-ray sources, and soft X-rays dominate the spectrum. However, among NLS1s there are a handful of higher luminosity objects that appear to be remarkably weak in soft X-rays. An example is PHL 1811, a very luminous NLS1 that is anomalously weak in X-rays (Leighly et al. 2001).
1H 0707495 () is a particularly interesting NLS1. ASCA observations of this object revealed a strong soft excess, high amplitude variability, and an apparent absorption feature around 1 keV (Leighly et al. 1997; Leighly 1999ab). We observed 1H 0707495 with Chandra in order to identify the 1 keV absorption feature. In this contribution, we describe the results, preliminary analysis, and tentative interpretations of the observation.
2 The Chandra Observation
The proposed 100 ks observations of 1H 0707495 was made in two segments, 34 ks and 55 ks in length, that were separated by 15 hours. 1H 0707495 was bright during the observation. The average flux was approximately 1.6 times that of the 1995 ASCA observation, and the shape of the spectrum seems very similar as well. We obtained 9025 photons in the MEG first order spectra between 0.5 and 5 keV.
We obtained about the same number of photons in the zeroth order between 0.5 and 10 keV, yielding a count rate of 0.1 count/s. We estimate that the zeroth order spectrum is about 10% piled up, implying that it can be analyzed. We have commenced analyzing the spectrum using the ISIS package, and the analysis is still underway.
3 The Chandra Spectrum
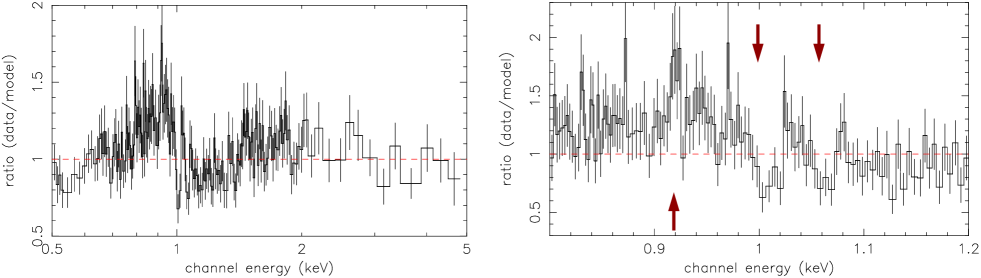
The summed MEG first order spectrum was first fitted with a power law, black body, and Galactic absorption. The fit was not acceptable, yielding for 339 degrees of freedom (d.o.f.). The cause of the poor fit is z-shaped continuum residuals between 0.8 and 2 keV (Fig. 1). These occur because the spectrum suffers a sharp drop at around 1 keV, and this drop is too steep to be modelled by a black body.
Several discrete emission and absorption line-like features also contribute to the poor fit. Given the poor signal to noise, many of the features are detected with low confidence. An exception is the absorption line appearing at 1.046 keV in the rest frame. This line has an equivalent width of 6 eV (depending on how the continuum is modelled) and appears to be marginally resolved.
The spectral modelling is not yet complete. However, we find that the following probably contribute:
-
•
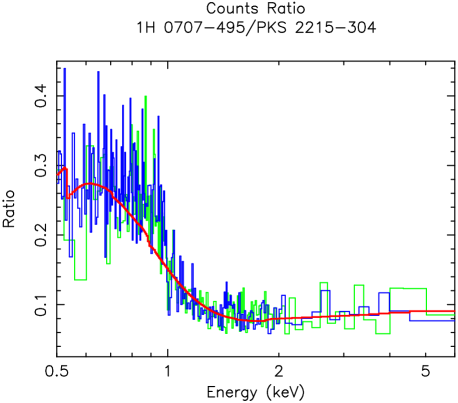
The effective areas of the different types of CCDs in the HETG grating spectrometer do not agree (H. Marshall 2001, p. comm.) In particular, a drop in the spectrum between 0.9 and 1.4 keV may be caused by low effective area for the back-illuminated CCDs relative to the front-illuminated ones. To divide out this calibration uncertainty, we plot the flux ratio of the 1H 0707495 spectrum with that of the calibration source, the BL Lac PKS 2155304 (Fig. 2). The ratio of the best fitting models are also shown (pl+bb for 1H 0707495, and pl for PKS 2155304). This plot shows that the sharp decrease near 1 keV remains, and is not simply a consequence of calibration uncertainties. Adjusting the ancillary response file (ARF) to account for the calibration differences (H. Marshall 2002, p. comm.) reduced the by 42 (339 dof).
-
•
We used a power law plus black body to model the continuum. In reality, if the power law is Comptonized black body photons, it should break toward low energies. This would result in a sharper break at the junction between the soft excess and power law. We modelled the spectrum using the EQPAIR Comptonization model (e.g. Gierliński et al. 1999) and found a reduction in by 15.
-
•
Emission and absorption features contribute to the spectrum around 1 keV, as suggested by the line-like features shown in Fig. 1. Why there no strong absorption features at lower energies? Nicastro, Fiore & Matt (1999) proposed that the steep X-ray spectrum will overionized light elements with opacity at low energies, leaving only highly-ionized iron ions that have significant opacity above 1 keV. Furthermore, iron L can contribute line emission below 1 keV. The combination of emission and absorption features may contribute to the sharp drop. We are in the process of modelling this situation using XSTAR, and preliminary results indicate significant improvement when emission and absorption are considered.
In November 2000, 1H 0707495 was observed using XMM-Newton (Boller et al. 2002). During this observation, a spectacular sharp absorption feature was observed at 7.1 keV in the rest frame. When modelled simply as an edge, Boller et al. derive an optical depth of . We cannot observe this region of the spectrum using the gratings; the sensitivity for this low-flux object is much too low. However, we can observe it using zeroth order. We find that an edge is not statistically necessary and (90% confidence for one parameter of interest). We caution that we have not yet taken pileup into account. As noted above, the count rate is sufficiently low that pileup is not expected to present a severe problem; however, it could artificially decrease the depth of an edge.
4 Short-term Variability
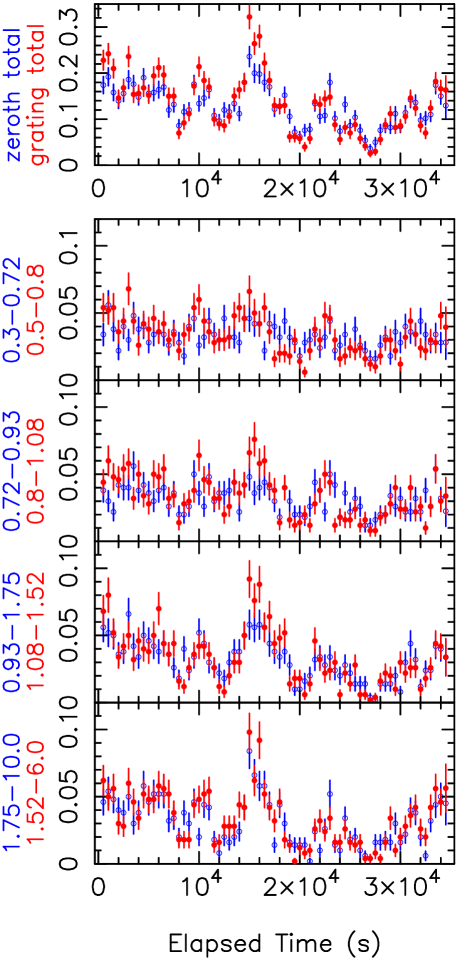
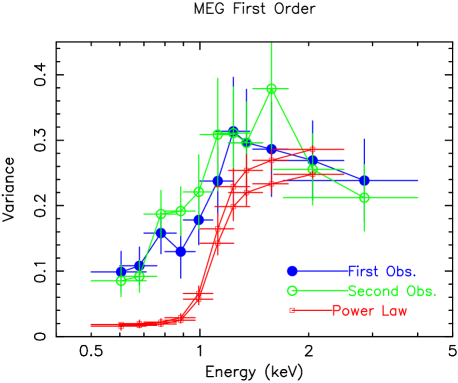
During the 40 ks observation XMM-Newton observation, large amplitude variability was observed (Boller et al. 2002). The fractional amplitude of variability was 40%, and the variability was color-independent. During the Chandra observation, a strikingly different result was obtained: the soft X-rays are much less variable than the hard X-rays. This is clearly seen in the light curves (Fig. 3), and can also be seen by the decrease in mean-normalized variance toward lower energies (Fig. 4).
As discussed in Section 3, the X-ray continuum from 1H 0707495 can be grossly fit with two components: a power law and a soft excess. It is possible that reduced variability in soft X-rays is a consequence of a variable power law normalization and a stationary soft excess (red curve in Fig. 4). The figure shows that this simple hypothesis is ruled out, because it predicts too little variability at low energies. It is possible that the variable hard X-ray continuum has curvature, steepening toward soft X-rays. Physical origins could be reflection from an ionized disk, or intrinsic curvature. Alternatively, the component emitting the soft X-rays may itself vary at a lower amplitude. Detailed time series analysis, now underway, may allow us to distinguish between these possibilities.
5 Long-term Variability
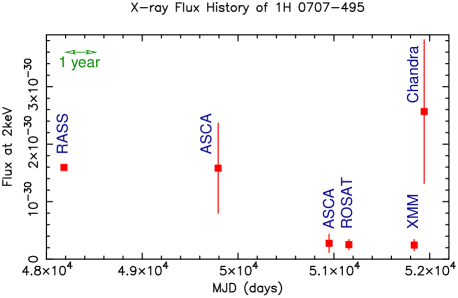
When 1H 0707495 was observed using Chandra, the average flux was about 10 times that when it was observed with XMM-Newton. Fig. 5 shows the long term flux history of 1H 0707495. The light curve is quite striking. Generally, when multiple observations are available, AGN X-ray fluxes range rather continuously between highest and lowest states (e.g. Grandi et al. 1992) and the full range is generally a factor of a few. In contrast, although we only have information for 6 separate epochs for 1H 0707495, we see that the variability appears to be bimodal, with the difference in high and low states being about a factor of 10.
We postulate that the bimodal long time-scale X-ray variability is a consequence of the radiation pressure instability (e.g. Honma, Matsumoto & Kato 1991). Why should we see this instability in luminous NLS1s? NLS1s are thought to have a high accretion rate, which implies that a larger portion of the accretion disk is radiation-pressure dominated. Furthermore, luminous NLS1s appear to be generally weak hard X-ray sources, and although part of this should be due to a cooler corona, the corona may be weak as well. Some models predict a weak corona when the accretion rate is high (Liu et al. 2002). Dissipation of the accretion energy in the corona effectively stabilizes the disk (e.g. Svensson & Zdziarski 1994), so a weak corona may also enhance the radiation pressure instability.
The time scale of the instability should depend on black hole mass, accretion rate, and the viscosity. While different models predict somewhat different time scales, we find that they may be roughly consistent the time scales inferred from Fig. 5. For example, the radiation pressure instability model has been successfully applied to the variability of the microquasar GRS 1915105 by Janiuk, Czerny, & Siemiginowska (2000). Scaling from the observed time scale of seconds for a 10 black hole, we predict a cycle of 3 years for a black hole.
Acknowledgements.
We acknowledge support for Chandra analysis (GO0–1162X), and NLS1 studies (NAG5-10171).References
- [1] Boller, Th., Brandt, W. N., & Fink, H., 1996, A&A, 305, 53
- [2] Boller, Th., Fabian, A. C., Sunyaev, R., Trümper, J., Vaughan, S., Ballantyne, D. R., Brandt, W. N., Keil, R., & Iwasawa, K., 2002, MNRAS, 329, L1
- [3] Boroson, T. A., & Green, R. F. 1992, ApJS, 80 109
- [4] Churazov, E., Gilfanov, M., & Revnivtsev, M., 2001, MNRAS, 321, 759
- [5] Gierliński, M., Zdziarski, A. A., Poutanen, J., Coppi, P. S., Ebisawa, K., & Johnson, W. N. 1999, MNRAS, 309, 496
- [6] Grandi, P., Tagliaferri, G., Giommi, P., Barr, P., & Palumbo, G. G. C., 1992, ApJS, 82, 93
- [7] Grupe, D., Beuermann, K., Mannheim, K., & Thomas, H.-C., 1999, A&A, 350, 805
- [8] Honma, F., Kato, S., & Matsumoto, R., 1991, PASJ, 43, 147
- [9] Liu, B. F., Mineshige, S., Meyer, F., Meyer-Hofmeister, E., & Kawaguchi, T., 2002, ApJ, in press
- [10] Janiuk, A., Czerny, B., & Siemiginowska, A., 2000, ApJL, 542, 33
- [11] Leighly, K. M., Mushotzky, R. F., Nandra, K., & Forster, K., 1997, ApJL, 469, 14
- [12] Leighly, K., 1999a, ApJS, 125, 297
- [13] Leighly, K., 1999b, ApJS, 125, 317
- [14] Leighly, K. M., Halpern, J. P., Helfand, D. J., Becker, R. H., & Impey, C. D. 2001, AJ, 121, 2889
- [15] Nicastro, F., Fiore, F., & Matt, G., 1999, ApJ, 517, 108
- [16] Pounds, K. A., Done, C., & Osborne, J. 1996, MNRAS, 277, L5
- [17] Svensson, R., & Zdziarski, A. A., 1994, ApJ, 436, 599