Broad-band X-ray measurements of the black hole candidate XTE J1908+094
XTE J1908+094 is an X-ray transient that went into outburst in February 2002. After two months it reached a 2-250 keV peak flux of 1 to erg cm-2s-1. Circumstantial evidence points to an accreting galactic black hole as the origin of the the X-radiation: pulsations nor thermonuclear flashes were detected that would identify a neutron star and the spectrum was unusually hard for a neutron star at the outburst onset. We report on BeppoSAX and RXTE All Sky Monitor observations of the broad-band spectrum of XTE J1908+094. The spectrum is consistent with a model consisting of a Comptonization component by a keV plasma (between 2 and 60 keV this component can be approximated by a power law with a photon index of 1.9 to 2.1), a multicolor accretion disk blackbody component with a temperature just below 1 keV and a broad emission line at about 6 keV. The spectrum is heavily absorbed by cold interstellar matter with an equivalent hydrogen column density of cm-2, which makes it difficult to study the black body component in detail. The black body component exhibits strong evolution about 6 weeks into the outburst. Two weeks later this is followed by a swift decay of the power law component. The broadness of the 6 keV feature may be due to relativistic broadening or Compton scattering of a narrow Fe-K line.
Key Words.:
accretion, accretion disks – binaries: close – X-rays: stars: individual (XTE J1908+094)1 Introduction
XTE J1908+094 was discovered serendipitously in 2–30 keV observations of SGR 1900+14, at 24′ distance, with the Proportional Counter Array (PCA) on board RXTE on 2002 February 21 (Woods et al. 2002). The source spectrum was consistent with an absorbed power law with a photon index of and an equivalent hydrogen column density of cm-2. The power density spectrum failed to show coherent pulsations and exhibited a flat spectrum between 1 mHz and 0.1 Hz and a broken power law beyond that up to 4 Hz, with a fractional rms amplitude of 43% between 1 mHz and 4 Hz.
XTE J1908+094 was also strongly detected in a 15–250 keV serendipitous observation of SGR 1900+14 on March 9.4–12.2 (UT) with the Phoswich Detection System (PDS) on BeppoSAX (Feroci & Reboa 2002). The spectrum was seen to have a cutoff at about 100 keV.
XTE J1908+094 was first imaged with the 2–10 keV Medium-Energy Concentrator Spectrometer (MECS) on BeppoSAX on April 2.4-3.8 and an accurate (20″ error radius at 90% confidence) was obtained (In ’t Zand et al. 2002a). This enabled Rupen et al. (2002) to identify a radio transient inside the MECS error circle at 4.86 and 8.46 GHz from observations with the Very Large Array on March 21 and 22. No obvious variability nor extension was detected. The association of the radio source with the X-ray source is confirmed by a short (1 ksec) spatially high-resolution X-ray observation with the ACIS-S detector on the Chandra X-ray observatory on April 15. We have analyzed the wings of the heavily piled-up source image and find, if ones assumes that the point spread function is symmetric, that the centroid is at equatorial coordinates and with an uncertainty of 1″. The radio source is 086 from this Chandra position.
The hard spectrum and lack of pulsations provide evidence that we are dealing with an X-ray binary in which the compact object is a stellar black hole (BH; Woods et al. 2002). Proof of this needs to come from the measuring the mass function through the radial velocity curve of the companion. The prospects for this are not negligible despite the large absorption; a near-infrared counterpart of mag has been identified by Chaty & Mignani (2002) whose location is consistent with that of the radio counterpart. Searches in (Wagner & Starrfield 2002) and (Garnavich et al. 2002) were negative with thresholds of 23 and 22 mag, respectively.
In this paper, we report on the follow-up observations of this source with two of the four Narrow-Field Instruments (NFI) on BeppoSAX (Boella et al. 1997a) during March 31 through April 3 that provide unique information on the broad-band spectrum of XTE J1908+094. This analysis is supported with observations done with RXTE’s All-Sky Monitor and BeppoSAX’ Wide Field Cameras.

2 Observations and data analysis
2.1 ASM
The RXTE All-Sky Monitor (ASM; Levine et al. 1996) measures the 1.5–12 keV flux of XTE J1908+094 up to 30 times a day during 90 s long dwells with one of three Scanning Shadow Cameras. The flux is measured in 3 channels. Figure 1 show the light curve derived by binning the data in one-day intervals. A first detection is apparent on about 2002 February 15 (MJD 52320) at a level of about 1.5 c s-1 in the 1.5 to 12 keV band. Subsequently the flux increased for two months at which point it reached 7 c s-1 or roughly one tenth the intensity of the Crab source. The dwell-by-dwell light curve does not reveal higher fluxes. The peak was maintained for just a short time, perhaps a few days. After that the source decayed over the course of about 2 months. There were no prior detections in the ASM database that goes back to early 1996.

The ASM light curves hint at quick spectral changes during the outburst. The first transition started on March 31 (MJD 52364) and lasted four days during which the 5-12 keV to 1.5–5 keV hardness ratio dropped from about 6 to 2. A second transition started on April 16 (MJD 52380) and also lasted four days when the ratio dropped further from 1.9 to 1.2, but now the drop is due to a decrease of the 5-12 keV flux rather than a 2–5 keV flux increase like in the first transition.
2.2 NFI
The discovery prompted a target-of-opportunity observation (TOO) by BeppoSAX. Since operations of BeppoSAX were seriously affected in January 2002 when one of the two batteries experienced a partial malfunction, power constraints prohibited the use of more than one Narrow-Field Instrument at the same time. Therefore, two observations were carried out on XTE J1908+094: the first on March 31.7 through April 1.9 with the PDS (net exposure time 44.9 ksec) and the second on April 2.4 through 3.8 with the MECS (56.6 ksec). The latter observation was the basis for the above-mentioned accurate X-ray localization. The timing of the observations was fortunate, because they cover the first spectral state transition as seen with the ASM.
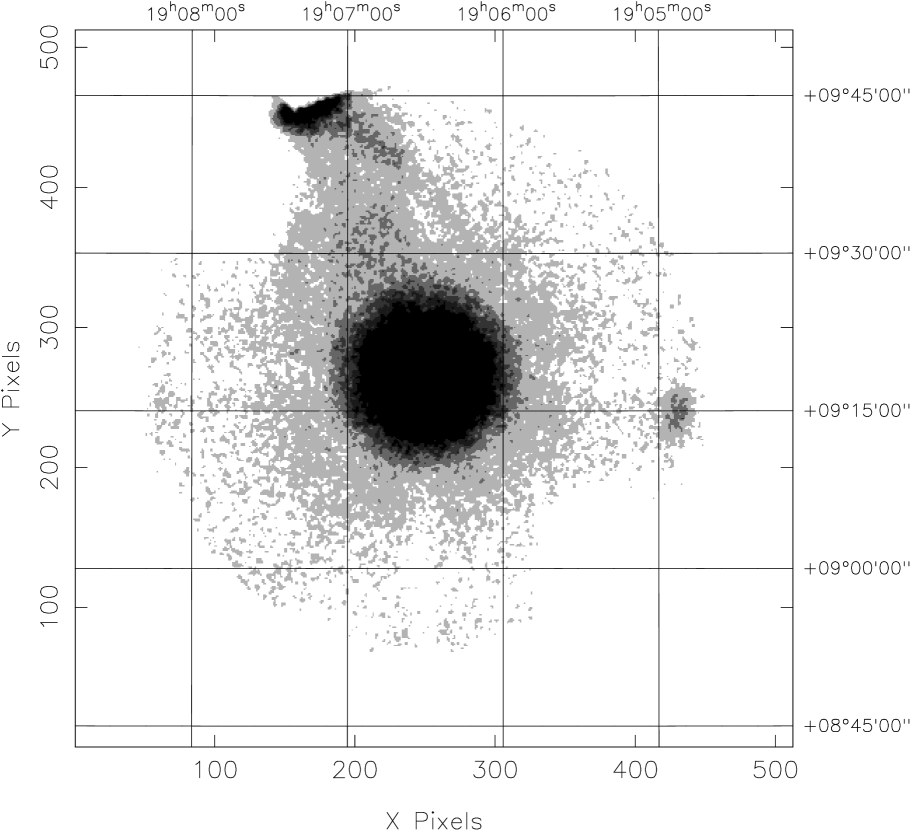
The MECS operates between 1.8 and 10.5 keV and is an imaging device with a field of view of about 50′ diameter with few-arcmin resolution (Boella et al. 1997b). Fig. 2 shows the full-bandpass image obtained from the MECS data. It shows three sources. Apart from XTE J1908+094, they are the accretion-powered X-ray pulsar 4U 1907+097 (for a recent paper, see Baykal et al. 2001) and the soft gamma-ray repeater and rotation-powered pulsar SGR 1900+14 (e.g., Kouveliotou et al. 1999). 4U 1907+097 has a pulse period of 441 s which is clearly detectable. The photon count rate of SGR 1900+14 is too small for a significant detection of its 5.16 s pulse period. MECS data on XTE J1908+094 were extracted within 4′ from the source centroid. The background was obtained from long independent measurements near the galactic poles, and was checked from an offset position in the present observation. Spectra were binned to oversample the resolution (8% FWHM at 6 keV) by a factor of 3, and to obtain at least 20 photons per bin to validate the use of the statistic. A 1% systematic error per bin was assumed to allow for small remaining calibration uncertainties.
The PDS acts between 15 and 250 keV, is a non-imaging device and consists of 4 units that pair-wise rock between an on-source pointing and two off-source pointings on opposite sides of the on-source pointing at a distance of 25 (Frontera et al. 1997). Each unit has a collimator that restricts the field of view to 13 (FWHM). Apart from XTE J1908+094, the field of view of the on-source pointing contains two other bright X-ray sources that we are aware of, namely those detected in the MECS image. We note that the Chandra observation does not show any other bright source within 5′. The field of views of the two off-source pointings contain no bright X-ray sources.
Figure 3 shows the time profiles in two energy bands of the background-subtracted photon rate as determined from the PDS data and in two bands as determined from the MECS data. There are trends on long time scales that differ strongly from band to band. The largest change in the flux occurs below 5 keV (3rd panel from the top) which increases 40% and appears to reach a maximum just before the end of the observation. The rise accelerates at 2.2 s after the start of the PDS observation. This change at low energies must be related to the first spectral transition seen in the ASM data. The PDS is likely contaminated by the same two sources that are visible in the MECS data. Fortunately, these have a unique signature which make them easy to identify in the PDS data: both are pulsars. The PDS data show a clear 441 s signal from 4U 1907+097 below 30 keV. The 5.16 s pulsar in SGR 1900+14 is not detectable. Therefore, we ignore keV data as well as the variability in that band (Fig. 3, 1st panel). We note that no other remarkable features, such as bursts or dips, were detected in the light curve (up to a time resolution of 1 sec).
We have performed a period search of the MECS data from 0.2 to 104 s and on the whole bandpass, as well as below and above 5 keV, and find no evidence for coherent oscillations with a 3 upper limit to the amplitude of 1% for a sinusoidal pulse profile. No pulsations were discovered in the PDS data as well, with an upper limit about 6 times as high as for the MECS data.
We also analyzed the PDS data that were reported by Feroci & Reboa (2002). This pertains to an exposure time of 96.6 ksec for both PDS units combined, taken between March 9.4 and 12.2. The target was SGR 1900+14, so that XTE J1908+094 is at a 24′ off-axis position which implies a vignetting factor of 0.69. 4U 1907+097 is also in the field of view at an off-axis angle of 47′. No bursts were detected.
In the following all quoted errors are the parameter ranges for which which is equivalent to 90% confidence for a single parameter.
2.3 WFC
The BeppoSAX Wide Field Cameras (WFCs; Jager et al. 1997) measured XTE J1908+094 during two short exposures in the final days of operation. The first was from April 27.6 to 27.8 UT for a net exposure time of 6.7 ksec and the second from April 29.4 to 29.7 for 8.1 ksec. Both were with WFC unit 2. No variability was detected.
3 Broad band spectrum

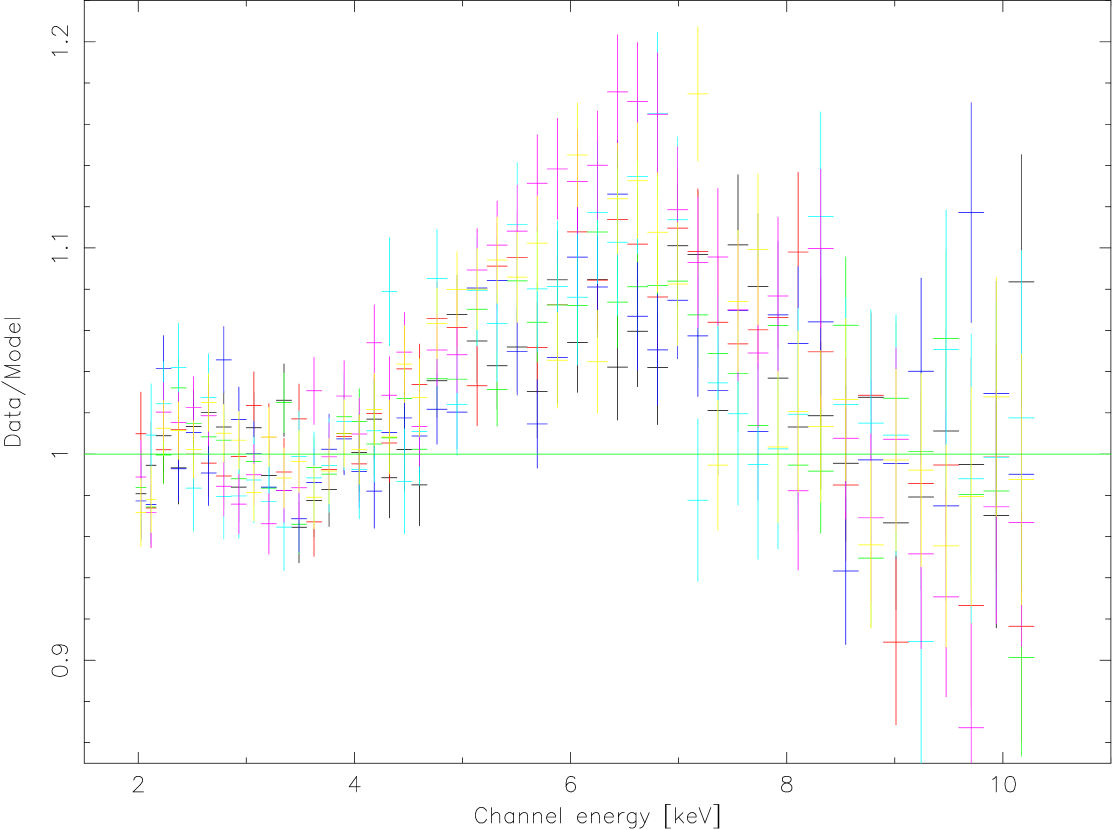
In order to understand the nature of the energy-dependent flux changes, we divided the MECS data in seven time intervals in which the source shows a particular state in the 2–5 keV data. The time spans are between 15 and 20 ksec. Figure 4 illustrates the spectral variability by showing the spectra for the first and seventh interval. This, again, shows strong changes below about 5 keV and weak and unrelated changes above that. The first spectrum is fairly well described by a simple absorbed power law (, ) with a hydrogen column density of cm-2 (assuming the model by Morrison & McCammon 1983) and a photon index of . This model does not fit the last spectrum (, ). Inspection of the fit residuals suggests the presence of an extra component between 2 and 4 keV which is obvious from Fig. 4. When modeling this by a multicolor accretion disk black body (Mitsuda et al. 1984) the fit becomes satisfactory (, ). Therefore, we simultaneously fitted all seven spectra (335 spectral bins) with an absorbed power law plus a multicolor disk black body, leaving free over all spectra the black body and power law normalizations, while coupling , the accretion disk inner edge temperature k and the power law index. Since k is well below the lower threshold of the bandpass (and the spectrum maximum just at that threshold), there is a strong dependence between this and the black body normalization and we refrain from varying the temperature. The resulting fit is inadequate (, ). The fit residuals show a noisy excess between 4 and 7 keV which is illustrated in Figs. 5 and 6. Therefore, we included a Gaussian function in the model that is constant over all seven spectra. The improvement in is dramatic, down to 1.020 (). For this fit, cm-2 and k keV. In Fig. 7 are shown the fitted values for the black body normalization and the photon count rate in the MECS below 5 keV as predicted for the power-law component. It is clear that the increase in flux is fully explained by the black body component, while the power law component remains rather stable. We note that the ASM measurements show an increase in keV flux as well which must have occurred shortly after the end of the MECS observation.


| MECS data | |
|---|---|
| Model‡ | wa(po+diskbb+gauss) |
| cm-2 | |
| k | 0.77 keV |
| Gauss | 5.90 keV |
| Gauss line width | 3.2 keV (FWHM) |
| Gauss line flux | phot s-1cm-2 |
| Gauss line EW | 0.27 keV |
| Unabs. 2-10 keV flux | from 1.49 to 1.76 erg cm-2s-1 |
| 1.020 (315 dof, 1% systematic error) | |
| Model‡ | wa(po+diskbb+laor) |
| cm-2 | |
| k | 0.77 keV |
| Laor | 6.4+0.03 keV |
| Laor | 3.9 G/c2 |
| Laor inclination | deg |
| Laor line flux | phot s-1cm-2 |
| Laor line EW | 0.23 keV |
| Unabs. 2-10 keV flux | from 1.49 to 1.77 erg cm-2s-1 |
| 1.108 (314 dof, 1% systematic error) | |
| 30–250 keV PDS data March 31 | |
| Model‡ | pohighecut |
| 2.10 | |
| 65 keV | |
| 158 keV | |
| 30-250 keV flux | 2.1 erg cm-2s-1 |
| 0.750 (49 dof) | |
| 30–250 keV PDS data March 9 | |
| Model‡ | pohighecut |
| 1.90 | |
| 66 keV | |
| 143 keV | |
| 30-250 keV flux | 3.2 erg cm-2s-1 |
| 1.05 (48 dof) | |
‡wa - absorption following the model by Morrison & McCammon (1983); po - power law with photon index ; diskbb - multi-temperature disk black body following Mitsuda et al. (1984); gauss - Gauss line profile; laor - relativistically broadened line profile following Laor (1991); highecut - exponential cutoff function with e-folding cutoff energy above a certain threshold energy .
As an alternative to the Gaussian model for the 4-7 keV feature, we applied a model for a relativistically broadened emission line near a compact object following Laor (1991), leaving free the line energy (but limiting the freedom between 6.4 and 6.97 keV), the radius (in terms of Schwarzschild radii) of the inner edge of the accretion disk, the inclination angle and the flux. The fit is acceptable with (), and the fit parameters are given in Table 1. The inclination angle is high, testifying to the symmetry of the feature and the fact that a Gaussian line fits just as good or slightly better.
We tested for the presence of an absorption edge between 7.1 and 9.3 keV, as would be expected for the iron K-shell at these energies, but an f-test predicts a 36% chance probability for the observed improvement in the fit.
The 30-250 keV PDS data taken immediately before the MECS data are inconsistent with a single power law (, ). If an exponential cutoff is introduced, the fit becomes acceptable with () and the photon index of is consistent with the MECS data. The fitted values are listed in Table 1.
We performed a simultaneous fit to the first MECS spectrum (in 1.8–10.5 keV) and the data from the final 15% of the PDS observation (30–250 keV). These two spectra were taken about one day apart. The fit with the absorbed cut-off power law plus disk black body and gaussian line is quite good ( with ) and the normalization of the PDS to the MECS data is within limits (). The parameter values are consistent with those obtained when treating the data independently (see above). Alternatively, we fitted this 2–250 keV spectrum with a Comptonized spectrum (following Titarchuk 1994 whereby the soft photons that are up scattered are described by a Wien spectrum with a temperature below our bandpass) plus multicolor accretion disk black body. The fit is good as well ( with ). The fitted parameters are: cm-2, plasma temperature keV, optical depth (for a disk geometry) or (for a spherical geometry), and the PDS to MECS normalization is again within limits (). The 1.8-250 keV unabsorbed flux is 4.610-9 erg cm-2s-1. If the disk component extends to lower energies, the flux could be a factor of 2 higher. The 1.8-10 keV unabsorbed flux increases by 0.310-9 erg cm-2s-1 during the course of the MECS observation.
The PDS spectrum taken on March 9.4–12.2 by Feroci & Reboa (2002) looks quite similar above 30 keV to that taken between March 31.7 and April 1.9 (Table 1). The same cutoff law applies while the photon index is slightly harder (1.9 versus 2.1).
We combined the WFC spectral data from the observations on April 27 and 29, after verifying that the source was stable between both dates. The total exposure time is 14.9 ksec. The spectrum is much softer than during the MECS observation 24 days earlier, see Fig. 8. An absorbed power law with cm-2 fixed provides an adequate description of the data (, ) with keV, but a disk black body fits better with () and k and km (for a distance of 10 kpc). The unabsorbed 2–10 keV flux is 1.1 erg cm-2s-1, or 30% less than measured during the first MECS spectrum. However, compared with the black body component in the last MECS spectrum only, the flux is three times higher. There is no significant detection of a power-law component; it is at least a factor of 5 fainter than during the MECS observation.
4 Discussion
Woods et al. (2002) proposed a BH hypothesis for the compact object in XTE J1908+094, on the basis of a hard spectrum similar to other accreting BHs in the low/hard state (for a review, see Tanaka & Shibazaki 1996) and the lack of pulsations. Our observations support this proposal. We have analyzed a total of ksec exposure on XTE J1908+094 (excluding the ASM coverage), 2/3 of it above 15 keV, and fail to detect signatures of a neutron star: there are pulsations nor type-I X-ray bursts. Definitive proof for the BH nature needs to come from radial velocity measurements of the near-infrared counterpart identified by Chaty & Mignani (2002).
With this source, the total number of X-ray binaries suspected to inhabit a BH is about 31. Half of these have been dynamically confirmed (J. Orosz, priv. comm.) through a mass function larger than 3 M⊙.
The 2–250 keV spectrum is characterized by two continuum components: a multicolor accretion disk black body and a Comptonization spectrum. The black body component is on the rise during the MECS observation, when its flux triples within the bandpass. Since a major part of the black body is outside our bandpass (k0.8 keV) and the interstellar absorption is high (implying 90% absorption at 2 keV), it is impossible to study the evolution of its temperature and geometric size. However, it is reasonable to assume that the rise is associated with the inner edge of the disk getting closer to the compact object. During the WFC observation 24 days later, the 2–28 keV spectrum is dominated by this component but the temperature is still below 1 keV. The spectral evolution of the outburst is concentrated in two fairly discrete softening events around April 2 and 16. The first event is what was observed with the MECS. Here, the softening is mainly caused by a brightening of the black body component. The second event appears to be due to a strong decay of the Comptonization, as suggested by the ASM data. Perhaps the plasma is effectively cooled down by the black body photons at this point. The two spectral state transitions are probably related to changes in the mass accretion rate and another parameter, and are similar to what is observed in other (BH) transients (e.g., Nowak 1995; Tanaka & Shibazaki 1996; Belloni 2001; Homan et al. 2001): initially, the source was in the ’low/hard state’ () with a high fractional variability of 43% rms (Woods et al. 2002). The first transition is probably into the ’intermediate state’ when a disk black body appears while the power law remains present. Two weeks later the source appears to transit into the ’high/soft state’ when the Comptonized component drops significantly (as evidenced by the WFC observation) and the disk black body is considerably brighter. The source did not move to the ’very high state’ for which the disk temperature should increase to the 1-2 keV regime. More diagnostics, particularly pertaining to the timing behavior, may be deduced from (mostly private) PCA data.
In addition to the two continua components there is an emission feature centered on the location of the Fe-K complex which is very broad (3.2 keV FWHM). Similar features have been detected in other X-ray binaries, usually but not exclusively (e.g., Oosterbroek et al. 2001) in BH transients. A few recent examples of BH cases are XTE J1650-500 (Miller et al. 2002), SAX J1711.6-3808 (In ’t Zand et al. 2002b), XTE J2012+381 (Campana et al. 2002) and GRS 1915+105 (Martocchia et al. 2002). The widths are similar. Generally, two explanations are proposed for the broadening: Compton scattering in a corona or relativistic Doppler broadening in combination with gravitational redshift in a part of the accretion disk close to the black hole. As we have determined in our spectral analysis, relativistic Doppler broadening provides a good description of the line in XTE J1908+094. However, the same applies for Compton broadening in a keV/ plasma: following Czerny et al. (1991) one expects a line width of about 3.1 keV (FWHM).
A substantial part of the bolometric flux is outside the 2–10 keV band. During the MECS+PDS observation on March 31 through April 3, the 10–250 keV flux is roughly twice the 2–10 keV flux. Furthermore, there may be just as much flux below 2 keV as above and we estimate that the bolometric flux is about 1 erg cm-2s-1. Another measurement of the broad-band flux can be obtained if we combine the PCA observation on March 17 by Woods et al. (2002), which translates to an unabsorbed 2–30 keV flux of erg cm-2s-1, and the PDS measurement on March 9–12 of 3.2 erg cm-2s-1in 30–250 keV. The ASM light curve suggests that no substantial flux changes happened between both observations. The summed 2–250 keV flux is 7 erg cm-2s-1 which is 50% above the PDS+MECS measurement 3 weeks later. Since there are only two measurements above a few tens of keV and none possible below 2 keV due to the high interstellar absorption, it is uncertain what the peak bolometric flux is. Also, ASM measurements show an increase by a factor of two at energies above 5 keV soon after the MECS+PDS measurement. This could be due to the tail of the brightening black body component, or to an increase of the power-law component. Either way, we estimate that the 2-250 keV flux may be about erg cm-2s-1 during the peak as timed by the ASM light curve. Taking into account the invisible flux below 2 keV, we estimate that the peak bolometric flux may have been roughly erg cm-2s-1. The state transitions indicate that the source reached luminosities in excess of 10% of the Eddington limit (e.g., Nowak 1995) which is 21037 erg s-1 if we assume that the mass is greater than that of a neutron star. This yields a lower limit to the distance of 3 kpc (6 kpc if we are dealing with a BH with a minimum mass of 3 M⊙).
Acknowledgements.
We thank the BeppoSAX Mission Scientist Luigi Piro and the Time Allocation Committee for granting considerable amounts of Project Time to carry out the March 31 TOO, and the Mission Planning team for their enthusiastic effort to schedule it under many constraints. We are grateful to Marco Feroci for generously providing the PDS March 9 data on SGR 1900+14. JZ acknowledges financial support from the Netherlands Org. for Scientific Research (NWO).References
- (1) Baykal, A., Çagdas, I., Alpar, A., in ’t Zand, J.J.M., & Strohmayer, T. 2001, MNRAS 327, 1269
- (2) Belloni, T. 2001, in ’X-ray emission from accretion onto black holes’, Proc. JHU/LHEA workshop, June 2001, in press (astro-ph/0112217)
- (3) Boella G., Butler R. C., Perola G. C., et al., 1997, A&AS 122, 299
- (4) Boella G., Chiappetti L., Conti G., et al. 1997b, A&AS 122, 327
- (5) Campana, S., Stella, L., Belloni, T., et al. 2002, A&A 384, 163
- (6) Chaty, S., & Mignani, R.P. 2002, IAUC 7897
- (7) Czerny, B., Zbyszewska, M., Raine, D.J. 1991, in Proc. “Iron line diagnostics in X-ray sources” (Varenna 1990), eds. A. Treves, G.C. Perola & L. Stella, Lecture Notes in Physics (Berlin: Springer Verlag), vol. 385, 226
- (8) Feroci, M., & Reboa, L. 2002, IAUC 7861
- (9) Frontera F., Costa E., Dal Fiume D., et al. 1997, A&AS 122, 357
- (10) Garnavich, P., Quinn, J., & Callanan, P. 2002, IAUC 7877
- (11) Homan, J., Wijnands, R., van der Klis, M., et al. 2001, ApJS 132, 377
- (12) In ’t Zand, J.J.M., Capalbi, M., & Perri, M. 2002a, IAUC 7873
- (13) In ’t Zand, J.J.M., Markwardt, C.B., Bazzano, A., et al. 2002b, A&A, in press (astro-ph/0205339)
- (14) Jager R., Mels W., Brinkman A., et al. 1997, A&AS 125, 557
- (15) Kouveliotou, C., Strohmayer, T., Hurley, K., et al. 1999, ApJ 510, L115
- (16) Laor, A. 1991, ApJ 376, 90
- (17) Levine, A., Bradt, H., Cui, W., et al. 1996, ApJ 469, L33
- (18) Martocchia, A., Matt, G., Karas, V., Belloni, T., & Feroci, M. 2002, A&A 387, 215
- (19) Miller, J.M., Fabian, A.C., Wijnands, R., et al. 2002, ApJ 570, L69
- (20) Mitsuda, K., Inoue, H., Koyama, K., et al. 1984, PASJ, 36, 741
- (21) Morrison R., & McCammon D. 1983, ApJ 270, 119
- (22) Nowak, M.A. 1995, PASP 107, 1207
- (23) Oosterbroek, T., Barret, D., Guainazzi, M., & Ford, E.C. 2001, A&A 366, 138
- (24) Rupen, M.P., Dhawan, V., & Mioduszewski, A.J. 2002, IAUC 7874
- (25) Tanaka, Y., & Shibazaki, N. 1996, ARA&A 34, 607
- (26) Titarchuk, L. 1994, ApJ 434, 313
- (27) Wagner, R.M., Starrfield, S. 2002, ATel 86
- (28) Woods, P., Kouveliotou, C., Finger, M.H., et al. 2002, IAUC 7856