NGC 4258: a jet-dominated low-luminosity AGN?
Low-luminosity AGNs (LLAGNs) are a very important class of sources since they occupy a significant fraction of local galaxies. Their spectra differ significantly from the canonical luminous AGNs, most notably by the absence of the “big blue bump”. In the present paper, taking a typical LLAGN–NGC 4258–as an example, we investigate the origin of their spectral emission. The observational data of NGC 4258 is extremely abundant, including water maser emission, putting very strict constraints to its theoretical models. The infrared (IR) spectrum is well described by a steep power-law form , and may extend to the optical/UV band. Up until now there is no model which can explain such a steep spectrum, and we here propose a coupled jet plus accretion disk model for NGC 4258. The accretion disk is composed of an inner ADAF (or radiatively inefficient accretion flow) and an outer standard thin disk. A shock occurs when the accretion flow is ejected out of the ADAF to form the jet near the black hole, accelerating the electrons into a power-law energy distribution. The synchrotron and self-Comptonized emission from these electrons greatly dominates over the underlying accretion disk and can well explain the spectrum ranging from IR to X-ray bands. The further propagation of the shocked gas in the jet can explain the flat radio spectrum of NGC 4258. Several predictions of our model are presented for testing against future observations, and we briefly discuss the application of the model to other LLAGNs.
Key Words.:
accretion, accretion disks – black hole physics – galaxies: active – galaxies: nuclei – hydrodynamics1 Introduction
The nearby active galactic nucleus (AGN) in NGC 4258 (M106) offers us a rare opportunity to understand the powering of a class of AGNs because of its precisely determined black hole mass and distance. High resolution 22 GHz VLBI observations of the water maser emission reveal a thin circumnuclear disk in Keplerian orbit (Greenhill et al. 1995a; Miyoshi et al. 1995; Moran et al. 1995; Herrnstein, Greenhill, & Moran 1996). The maser emission extends from 0.13 pc to 0.26 pc, and the perfect Keplerian rotation curve requires a central binding mass, , of within 0.13 pc. This makes it one of the two strongest supermassive black hole candidates to date (the other being our own Galactic center, see Melia & Falcke 2001 for a recent review). By measuring maser spot acceleration or proper motions (Greenhill et al. 1995b; Herrnstein et al. 1999), the distance of the source can also be directly determined independently of Hubble constant, and is found to be .
In addition to the black hole mass and distance, the third critical parameter for AGN modeling is the mass accretion rate . The accretion rate in the maser disk can be determined from the observed water maser emission. The projected positions of individual maser spots indicate that the maser disk is significantly warped (Miyoshi et al. 1995; Greenhill et al. 1995a). Such a warped disk will inevitably be illuminated obliquely by the central X-ray source, and Neufeld, Maloney, & Conger (1994) show that X-ray irradiation of dense molecular gas is an effective mechanism for generating powerful water maser emission. This also naturally explains the association of water megamasers with AGNs (Claussen & Lo 1986; Braatz, Wilson, & Henkel 1994). By modeling the molecular annulus as a standard thin accretion disk (SSD; Shakura & Sunyaev 1973) illuminated by the X-ray photons, Neufeld & Maloney (1995, hereafter NM95) infer the mass accretion rate through the disk to be , here is the conventional viscosity parameter.
However the NM95 accretion rate is obtained from modeling the masering disk, which is very far away from the hole since 0.13 pc with is the Schwarzschild radius of the black hole. The viscous timescale at 0.13 pc is extremely long, yr, therefore, it is very unlikely that accretion has been steady during such period (Gammie, Narayan, & Blandford 1999, hereafter GNB99). It is thus likely that the accretion rate at the inner region of the accretion disk can has a different value from NM95 (GNB99).
There is a plethora of observational data for NGC 4258, ranging from the radio, IR, optical/UV, to X-ray bands, as we will review in Sect. 2. These broadband data indicate that NGC 4258 is very under-luminous, , where is the Eddington luminosity, making NGC 4258 an ideal candidate for an advection-dominated accretion flow (ADAF; see reviews by Narayan, Mahadevan, & Quataert 1999 and Kato, Fukue & Mineshige 1998). In particular, since a thin disk is observed at the region out of , a truncated ADAF model is viable in which an ADAF connects at a transition radius to an outer SSD. This would naturally explain why there is no maser emission inside 0.13 pc. Several transition mechanisms have been proposed (e.g., Meyer & Meyer-Hofmeister 1994; Honma 1996; Czerny, Rozanska, & Zycki 2000; Spruit & Deufel 2002), but a reliable prediction for the value of is still lacking.
Lasota et al. (1996) assume that such a hybrid accretion disk is responsible for the spectrum of NGC 4258. This model is later refined in GNB99. The X-ray spectrum of NGC 4258, which is hard to explain by a SSD alone, can be well explained by the ADAF. The IR spectrum of NGC4258 was not certain at the time when GNB99 was published, although GNB99 could well explain the IR flux which was available at that time. The IR spectrum in this model is produced by the outer SSD, therefore a very hard IR spectrum with the classical form of is predicted. The required accretion rate (GNB99). This is more than two orders of magnitude higher than the NM95 rate.
After the publication of GNB99, new IR observations determined a better spectrum (see next section for details), which is in serious conflict with the prediction of GNB99. The detected spectrum is very steep, with spectral index (. On the other hand, when fitting the spectrum of NGC4258 (or any source), an ADAF model usually does not take into account the role of the jet, which is believed to occur in the innermost region of the accretion disk. In some cases, the emission from the jet may dominate over the underlying accretion disk in sources such as blazars, M87 (Wilson & Yang 2002), and some classes of X-ray binaries (Markoff, Falcke, & Fender 2001).
In the present paper, we propose an alternative model to explain the spectrum of NGC 4258. We suggest that the main emission of NGC 4258 comes from the base of its jet rather than the accretion disk. In next section, we will present a review of the relevant observations of NGC 4258. Sect. 3 presents our model and explanations for the spectrum of NGC 4258, along with some theoretical predictions. The application of our model to LLAGNs in general is discussed in the last section.
2 Review of Observations
2.1 Radio
VLA observations reveal a compact radio source within of the maser emission, with a mJy flux density at 2 cm, and a spectral index of (Turner & Ho 1994), indicated by the short “slanted” line in Fig. 1.
Herrnstein et al. (1998) report that the 22 GHz radio emission traces a jet-like structure oriented along the rotation axis of the maser disk, and composed of distinct northern and southern components with flux density of mJy and 0.5 mJy, respectively. Because the relative position of the center of mass of the molecular disk can be measured to a fraction of a milliarcsecond with VLBI, NGC 4258 provides a rare opportunity to circumvent the ambiguity associated with core-jet emission. The centroids of the northern and southern components appear at mas and mas from the disk center, respectively. Both the flux and centroid of the northern component vary significantly with time. More interestingly, Herrnstein et al. (1998) report a 3 upper limit of 220 Jy on any 22 GHz continuum emission coincident with the central mass of the NGC 4258 maser disk. This result places an extremely strict constraint on theoretical models of NGC 4258, and is the main motivation for GNB99’s revisiting of the ADAF model after Lasota et al.’s (1996) work. GNB99 argue that such an upper limit requires the SSD-ADAF transition radius .
2.2 Optical/UV
Wilkes et al. (1995, hereafter W95) have measured the 5500 Å flux toward NGC 4258 in polarized light. This emission presumably arises in the central engine and has been scattered into our line of sight. They find that the spectral index is well-fit by a power law with . This value agrees well with the argument of Stüwe, Schulz, & Hühnermann (1992) that a continuum with can produce sufficient ionizing power to explain the observed strength of the optical emission lines in NGC 4258. The corresponding 5500 Å central engine luminosity is highly sensitive to the type of scattering screen invoked. W95 proposed two candidates for the polarization: scattering by electrons in an H II region surrounding the nucleus, and scattering by dust grains located above and below the molecular disk. The estimated luminosities are and , respectively. We denote both of them in Fig. 1 with empty circles because they are not very precise. However, we think that the latter is more likely because connecting the near-IR data to the former point would result in an unbelievably hard spectrum, in serious conflict with the observed polarization spectrum.
2.3 Infrared
Chary & Becklin (1997) present J, H, and K band Keck observations. Using the J band surface brightness profile as a baseline, they obtain the J-band subtracted H and K bands image which is consistent with a unresolved point source. The nucleus is then found to be very red. Such redness can be attributed to either a red central source or dust extinction of starlight. They argue for the former by showing that this color cannot be explained by uniform foreground dust extinction, assuming a late-type stellar population typical of the bulge. Assuming that the intrinsic spectrum has a similar power-law form with the optical/UV polarization spectrum obtained by W95, which gives , they deduce the extinction and luminosity.
Obviously such a spectral result, especially the value of the power-law spectral index, is not so certain. For example, a power-law fit of also works well, as pointed out by GNB99. Using HST (NICMOS), the 5.1 m Hale telescope and the Keck II telescope (MIRLIN), Chary et al. (2000) went on to present high-resolution images from 1 to 18 m, placing a much better constraint on the spectrum. They find that the mid-IR data before extinction-correction share a similar spectrum with the optical/UV polarization results. Since mid-IR suffers relatively little dust extinction, such a similarity strongly suggests that the IR spectrum has approximately the same power-law form as the optical/UV polarization spectrum. To make sure, they tested four predictions for the 3.5 m flux based on four different power-law spectral indexes, including . They find that only a steep power-law with a similar spectral index as the polarization spectrum of W95 can give a correct prediction with their observation (R. Chary, private communication). In addition, the extinction coefficient obtained from such a steep spectral fit across all the IR wavebands is consistent with the extinction derived from the N-band data point after including the 9.7 micron silicate feature (R. Chary, private communication). They therefore conclude that the intrinsic extinction-corrected IR spectrum of NGC 4258 can be well fitted with a steep power-law form, and their best fit extinction-corrected spectrum goes as . Considering W95, such a spectrum is very likely to extend to the optical/UV band. The data is listed in Table 1 and shown by filled circles in Fig. 1.
| Frequency(Hz) | Flux(mJy) | Reference |
|---|---|---|
| 3(s=-0.4a) | 1 | |
| 2.5-3.5, | 2 | |
| 435 | 3 | |
| 270 | 3 | |
| 195 | 4 | |
| 46 | 3 | |
| 25 | 3 | |
| 16 | 3 | |
| 10 | 3 | |
| 1.7,170c | 5 |
Notes and references:
a: s=-0.4 is the spectral index ()
b: 2.5-3.5mJy is the flux detected from the jet, while 0.22mJy is
the upper limit detected from the location coincident with the central mass
of the maser disk
c: the two values correspond to two scattering models
(1) Turner & Ho 1994;
(2) Herrnstein et al. 1998;
(3) Chary et al. 2000;
(4) Rieke & Lebofsky 1978;
(5) W95
Such IR and optical/UV spectral results, combining with the radio data, give an estimate the bolometric luminosity of NGC 4258 of . Spinoglio & Malkan (1989) suggest that the 12 luminosity is typically about 1/5 of the bolometric luminosity of AGNs, independent of whether the emission is thermal or nonthermal in origin. This argument gives for the mid-IR data of Chary et al (2000). The consistency between the two estimates again suggests that the steep power-law spectrum extends to the optical/UV, and that there is no big-blue-bump as usually found in luminous AGNs. The steep power-law spectrum, , found throughout the IR and possibly extending to optical/UV strongly suggests a non-thermal origin, and that the dust in NGC 4258 is likely to be cool and contribute only at wavelengths longer than mid-IR (Chary et al. 2000).
Such a steep IR spectrum is very unusual compared to the canonical luminous AGNs but seems to be common in LLAGNs, as we will illustrate in Sect. 4. It provides a strict constraint to the theoretical model of NGC 4258111Chary et al. (2000) did try to fit such a spectrum using an ADAF model, but their calculation is too simplified. A more exact ADAF calculation predicts an exponentially decreasing spectrum at IR band, as shown by, e.g., the dot-dashed line in Fig. 1 in the present paper.. In particular, this is in serious conflict with the prediction of by GNB99, as discussed in Sect. 1.
2.4 X-rays
Several telescopes have observed the X-ray emission of NGC 4258 in recent years, from ASCA nearly eight years ago to XMM-Newton reported this year. The reader can refer to Table 1 in Pietsch & Read (2002) for the values of spectral parameters. An interesting result we find is that the observed X-ray spectral indexes differ greatly for different observations, ranging from (Pietsch & Read 2002) to (Fiore et al. 2001). We put these two most extreme results in Fig. 1. While one reason for the discrepancy of the spectral index is likely due to the instruments, it is possible that the spectrum is intrinsically variable with time.
Reynolds, Nowak, & Maloney (2000) report their ASCA detection of the iron K line. They find the line is narrow222The detected iron K line is moderately strong. This is somewhat unusual since among LLAGNs the iron line is either extremely weak or absent (Terashima et al. 2002). The iron line in NGC 4258 may come from, e.g., the warping molecular disk., which constrains the inner radius of the SSD to be . Note in GNB99 the SSD-ADAF transition radius is , so it only marginally satisfies the iron line observation.
In the BeppoSAX observation of Fiore et al. (2001), large amplitude (100%) variability is observed on timescales of a few tens of thousands of seconds, while variability of is observed on timescales as short as 1 hr. The size of the X-ray source is then constrained to be .
2.5 Summary of Observations
In short, the spectrum of NGC 4258 is quite different from the usual luminous AGNs. As discussed above, the data puts very strict constraints on the theoretical models and challenges our understanding of the powering mechanism in NGC 4258. On the other hand, we note that NGC 4258 is somewhat analogous to Sgr A∗: both sources have flat radio and steep IR spectra, and both are low luminosity sources with the luminosity peaked at sub-mm or IR rather than optical as in luminous AGNs. However, the bolometric luminosity of NGC 4258 is about times higher than Sgr A∗ in units of Eddington luminosity, and the jet in NGC 4258 is much stronger than in Sgr A∗, which if present has not yet been detected. The spectral similarity between the two sources does, however, suggest a common physical mechanism. A jet-ADAF model has been found to be very successful at explaining the spectrum of Sgr A∗ from radio to hard X-ray (see Yuan, Markoff, & Falcke 2002 for details; hereafter YMF02)333 Recently the presence of a four-month cycle in the radio variability of Sgr A∗ was reported (Zhao, Bower, & Goss 2001; see also Yuan & Zhao 2002). By analogy with the plateau state of GRS 1915+105, it is suggested that such quasi-periodic variability is very likely to be produced through a jet (Zhao, Bower, & Goss 2001). If verified, this observation would strengthen arguments for a jet component in models of Sgr A∗.. We consider that the same type of model may be applicable to the spectrum of NGC 4258 as well. In this model, most of the emission comes from the base of the jet rather than the accretion disk. The much higher luminosity of NGC 4258 compared to Sgr A∗ is then due to its more powerful jet.
3 Jet Model for NGC 4258
The physical scenario of our model is as follows. The accretion flow outside of 0.13 pc (or smaller) is described as a SSD. At a certain radius, a SSD-ADAF (or more generally a radiatively inefficient accretion flow) transition occurs. Since the accretion onto the black hole must be transonic, the accretion flow becomes radially supersonic after passing through a sonic point (e.g., Narayan, Kato, & Honma 1997). When the radially supersonic accretion flow is subsequently ejected out of the disk to form the jet, a standing shock occurs due to the bending, as suggested by the general relativistic MHD numerical simulations of jet formation (Koide, Shibata & Kudoh 1998; Koide et al. 2000). After the shock, the kinetic energy of the pre-shock accretion flow will be transferred into the internal energy of the post-shock plasma and the temperature of the flow will be increased nearly to the thermal temperature , since the energy loss from the pre-shock ADAF is very small and can be neglected. Most of the emission from such a disk-jet system then stems from the high-temperature post-shock plasma. We find that the shock is radiative, i.e., the radiative cooling timescale is much shorter than the characteristic shock propagation time. We will show that the synchrotron emission will be responsible for the steep IR spectrum of NGC 4258 while its inverse Compton emission can explain the X-ray spectrum. The flat radio spectrum is explained by the emission from the outer part of the jet.
3.1 The Shock at the Jet Base
We denote the shock (or jet) radius as . Obviously, should be less than the sonic radius of ADAF, . Some accretion flow outside of may also go into the jet, but since it will not be shocked, its radiative contribution is small enough to be neglected.
We calculate the temperature of the post-shock plasma from the parameters of the pre-shock flow using the shock transition conditions. The post-shock equivalent temperature is determined by
| (1) |
The total thermal energy density of the post-shock plasma is then
| (2) |
Here the strong shock approximation and a parallel shock configuration are assumed. The adiabatic index since the protons are nonrelativistic while the electrons are relativistic, is the particle number density, is the pre-shock velocity of the accretion flow at the shock location . We obtain by solving the global solution for ADAFs.
However, since we do not know what fraction of the accretion flow will go into the jet, and because hydrostatic equilibrium in the vertical direction of the disk does not hold at the jet formation region, it is hard to determine the density of the post-shock plasma. As in YMF02, here we adopt the mass loss rate in the jet, , as a free parameter. Then the density of the post-shock plasma follows from
| (3) |
Here is the velocity of the post-shock flow and we calculate its value from the parameters of the pre-shock accretion flow using the shock transition conditions. Obviously should be smaller than the disk accretion rate .
We assume that electrons are accelerated in the shock to a power-law energy distribution, with a minimum Lorentz factor :
| (4) |
Generally is assumed in the literature for the injected distribution in the case of strong relativistic shock acceleration, e.g., Gamma-ray Bursts (GRBs). But in the present case, the shock is sub-relativistic and only moderately strong. For such a shock, we still know little about the form of the energy distribution of accelerated/heated electrons (e.g., Draine & McKee 1993). We conjecture that is likely somewhat larger, or even a thermal distribution is possible in the extreme case. We set in the present paper to relate it to the observed IR spectral index 444In the case of Sgr A∗, the IR upper limits require that must be much larger if assuming a power-law form, or, the distribution is approximately a relativistic Maxwellian form (YMF02). The discrepancy between NGC 4258 and Sgr A∗ may be due to the different physical parameters at the shock region, especially the shock strength. On the other hand, due to the poor constraints on the IR spectrum in Sgr A∗, we cannot exclude that some fraction of electrons may be accelerated into a very steep power-law distribution.. As the result of radiative losses, the steady distribution becomes steeper, i.e., (Kardashev, Kuz’min, & Syrovatskii 1962).
The value of is important for our spectral fitting. From Eq. (1), we can only determine the equivalent temperature of the post-shock plasma, but we do not know the respective temperature of electrons (or ) and protons. Another important quantity for determining the radiative cooling is the strength of the magnetic field. Both of these are difficult to estimate from first principles. We therefore follow the usual approach, using two parameters, and , to describe respectively the magnitude of the energy densities of random relativistic electron motions and of the magnetic field in terms of their ratios to the total thermal energy density of the post-shock plasma,
| (5) |
| (6) |
To calculate the synchrotron and self-Comptonized emission from the post-shock plasma, we still need to know the profile of the energy density after the shock front. We find to fit the spectrum, the shock must be radiative. This means and so the radiative cooling time of electrons due to synchrotron emission,
| (7) |
is much shorter than the dynamical time of the radiative region,
| (8) |
for typical values of , and in our model. We find that this holds true even when the self-absorption of synchrotron emission is taken into account.
In contrast to NGC 4258, the shock in Sgr A∗ is adiabatic. Besides the difference in mass between the two black holes, which will affect the dynamical timescale, this is due to the larger magnetic field in NGC 4258 compared to Sgr A∗. This seems consistent with the idea of jets having a magnetic origin, because a stronger magnetic field in NGC 4258 is consistent with its jet being much stronger.
The structure of radiative shocks has been discussed in many papers (e.g., Blandford & McKee 1976; Draine & McKee 1993; Granot & Königl 2001). In addition to a “shock transition zone” where the bulk of the kinetic energy of the pre-shock gas is dissipated and which can be treated as an infinitesimal front, there exists a thin “radiative zone” or “cooling layer” after the shock front, where most of the dissipated energy of electrons is radiated away. In particular, the magnetic field can be amplified due to the cooling compression of the gas. Thus if the pre-shock magnetic field in the plasma is already sufficiently strong, as in our present case of ADAF, the magnetic field in the cooling layer can reach or even exceed equipartition with the electron energy density, i.e., (e.g., Granot & Königl 2001)555 Such an approximate equipartition is also required in the modeling of blazars (Readhead 1994; Bower & Backer 1998), microquasars (Kaiser, Sunyaev, & Spruit 2000) and GRBs (Granot, Piran, & Sari 1999)..
Such a cooling layer is typically removed from the shock front by a short distance. An exact approach would be to calculate the radiation hydrodynamics of the post-shock plasma to obtain the distance-dependent profiles of , , and after the shock front. We here simply treat the cooling layer as a very thin homogeneous slab immediately after the shock front. The emission from the jet downstream of this slab can be neglected since almost all the energy of electrons will be radiated away in this thin layer until the electrons are accelerated again (see Sect. 3.3 below). The width of the cooling layer is determined by the post-shock velocity and cooling time of electrons,
| (9) |
where is the “cross section” of the cooling layer. The effect of the vertical component of velocity of post-shock plasma is neglected since it should be small at the beginning of the jet. The shock may be oblique and the shock normal direction may be between the radial and vertical directions, and the cross section of the shock front is likely a ring rather than a full circle (thus the jet may have a cocoon structure). We here approximate the cross section of the shock as . is the emitted total luminosity from electrons, and is obviously a function of , which we therefore calculate iteratively. Note that we cannot simply use the ratio between the energy and synchrotron power to calculate the electrons’ radiative lifetime because the effect of synchrotron self-absorption is significant. It is not, however, enough of an effect to change the “radiative” feature of the shock.
For a given set of parameters and , we numerically calculate the emitted luminosity and spectrum instead of using the simplified analytical formula because of the cutoffs in the emitting particle distributions. This is because the minimum frequencies of synchrotron and inverse Compton emission, and , fall in the mid-IR and soft X-ray bands, respectively, and the slope of the inverse Compton emission will thus be changing in the fitted region, as discussed in the next section.
We would like to note that the number of free parameters in our model is almost the same as the SSD-ADAF model of GNB99. There are five free parameters in our model, namely the shock radius , the mass loss rate in the jet , the electron energy spectral index , and the electron/magnetic energy parameters /. As a comparison, five free parameters are also required in GNB99, namely the accretion rate , the SSD-ADAF transition radius , the viscous parameter , the magnetic parameter , and the parameter describing the fraction of viscous energy that goes into the electrons, .
3.2 Infrared to X-ray Spectral Fitting Results

As we stated in Sect. 2, the X-ray spectral slope varies between the different observations, e.g., (Pietsch & Read 2002), (Makishima et al. 1994), (Reynolds et al. 2000), and (Fiore et al. 2001). In addition to instrumental reasons, it is very possible that such variations are intrinsic, as we know happens in some sources (e.g., Giebels et al. 2002). We will therefore fit both the steepest (, from BeppoSAX) and the flattest (, from XMM-Newton) X-ray data in the framework of our model.
Fig. 1 shows our best fit to the BeppoSAX results. The parameters are , , and . From these parameters we obtain G, , the length of the cooling layer , and the particle density . The long-dashed line in the figure shows the synchrotron emission, the dotted line shows its self-Comptonized radiation, and the thick solid line shows their sum. The power-law IR spectrum with is fitted by the synchrotron emission from electrons with a steady energy distribution of index . The predicted flux at the optical band is also roughly in agreement with the lower flux estimated in W95, which we feel is more likely (see Sect. 2.3). In the radio band, due to the strong synchrotron self-absorption and the fact that the emission from the region out of the cooling layer can be neglected, the synchrotron spectrum steeply decreases below the synchrotron peak so the Jy upper limit at 22 GHz is easily satisfied.
The X-ray spectrum is mainly due to the synchrotron self-Compton component. Due to the effect of the low-energy cutoff in the electron distribution, the power-law spectrum at keV is harder than . The exact value of the spectral index depends on the minimum frequency of inverse Compton emission, , here is the peak frequency of the synchrotron emission, which is mainly determined by the value of at the cooling layer. If is smaller, the spectrum would become steeper.
Also shown in Fig. 1 is the emitted spectrum from the underlying accretion disk, namely the ADAF (dot-dashed lines) and SSD (short-dashed lines). Because the value of the accretion rate is uncertain, we here adopt two values: (for the lower set of lines), and (for the upper set of lines). The transition radius is set to be 0.13pc, but our results are not sensitive to its exact value. The spectrum of ADAF is calculated by self-consistently solving the radiation hydrodynamic equations (e.g. Yuan et al. 2000). The ADAF with produces very low radio flux at 22 GHz because of small accretion rate, well satisfying the 220 Jy upper limit. The accretion rate is the largest rate for which an ADAF can satisfy the 22 GHz upper limit for pc 666The accretion rate can be even higher if the transition radius is smaller, as in GNB99.. In both cases, the contributions of ADAF and SSD to the spectrum of interest are rather small and can even be neglected. Decreasing will increase the contribution of SSD, but we find even for —which is prohibited by the iron line observation—the contribution of SSD is still too small to contribute to the spectrum for .
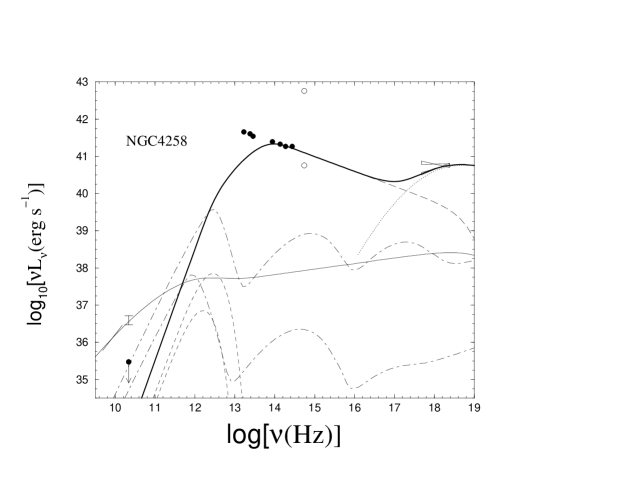
Fig. 2 shows our results of fitting the XMM-Newton X-ray data. The parameters are , , , and . Such parameters give G, , , and . The harder inverse Compton spectrum compared to Fig. 1 is due to the larger . Thus, we interpret the variations in the X-ray spectrum of NGC 4258 as due mainly to variations of , which could result physically from changes in the shock location . However, compared to Fig. 1, this set of parameters significantly underpredicts the mid-IR flux of Chary et al. (2000). This may be due to intrinsic variability in NGC 4258, since the broadband data is not simultaneous. According to our model, when the X-ray spectrum becomes harder, the mid-IR flux is decreased due to the increased self-absorption from the required lower-energy electrons. Our results would therefore be consistent if the high mid-IR flux detected by Chary et al. (2000) was obtained when the X-ray spectrum was as steep as the BeppoSAX result. Future simultaneous IR and X-ray observations would be a good test of this model.
The X-ray emission in our model comes from small spatial scales, , and therefore rapid variability as detected in Fiore et al . (2001) would be expected. On the other hand, we can easily set so our model will not produce a broad iron line, consistent with the observation of Reynolds, Nowak, & Maloney (2000).
In our model presented in Fig. 1., . If the accretion rate in the inner ADAF really equals , this result is unphysical. It is possible that this factor of discrepancy could be absorbed by the uncertainties in both the NM95 model and our own777For example, in addition to other simplifying approximations in our model, we assume that the proton density is the same with the electron density, when calculating from . It is also possible that proton-proton collisions in the post-shock plasma, and the ensuing pion creation and decays, would lead to significant amounts of additional . In this case , and the required would become smaller. We are investigating this possibility elsewhere (Markoff et al. in preparation).. However, as we show above, we can still be under the 22 GHz constraint with an accretion rate as high as . In this case, a fraction of (for Fig. 1) and (for Fig. 2) of accretion flow will be transferred into the jet. We speculate that the latter is more likely.
We now discuss why we require the accretion flow inside to be an ADAF (or more generally a radiatively inefficient accretion flow) rather than a SSD. To explain the spectrum of NGC 4258, especially the power-law IR spectrum whose luminosity is almost equal to the bolometric luminosity of NGC 4258, extremely relativistic electrons with power-law energy distribution are required. An ADAF is basically adiabatic, i.e., the potential energy of the accretion flow is stored in the protons without being radiated away. When the flow is shocked at , the stored energy in the pre-shock ADAF will be transferred into the thermal energy of post-shock plasma. Among them a large fraction, , will be used to accelerate electrons into a relativistic power-law distribution. Note that the radiative efficiency of the radiative shock is much higher than an ADAF, which follows,
| (10) |
Here we simply use the Paczyński & Wiita (1980) potential to mimic the geometry of the central black hole. If the ADAF were replaced by a SSD, the accretion energy would be radiated through a large range of radii. Therefore, even though a shock would still occur, only a small fraction of accretion energy would go into the thermal energy of the post-shock plasma. The electrons would not obtain a relativistic power-law energy distribution and their radiative efficiency would be .
There exists another possible piece of evidence for the existence of an ADAF rather than a SSD within pc. Observation indicated that within this radius the water maser emission disappears. In order to account for the absence of masers, NM95 propose that X-ray irradiation “shuts off” inside this radius. If this is true, Menou & Quataert (2001) show that for an accretion rate as low as , both MHD turbulence and gravitational instability will cease to be a viable angular momentum transport mechanism, therefore, the accretion in NGC 4258 should proceed very inefficiently or perhaps not at all. This excludes the possibilities of producing the bolometric luminosity of NGC 4258 through a SSD. The absence of masers may be due to the transition between SSD and ADAF. Thus the X-rays will irradiate both the SSD and the ADAF, and MHD turbulence will still be an efficient angular momentum transport mechanism even though the accretion rate in NGC 4258 is so low (Menou & Quataert 2001).
3.3 Radiation from the Outer Part of the Jet and Radio Observations
According to the above scenario, a large fraction of accretion flow will be ejected out of the ADAF and go into the jet after passing through a radiative shock. The emission from the thin cooling layer downstream of the shock front explains the IR and X-ray spectra of NGC 4258. We now follow the propagation of the plasma and discuss the emission from the jet downstream of the cooling layer. We consider only the northern jet in NGC 4258 since the southern jet is severely affected by the maser disk. If our model is correct, the propagated jet should be able to fit the radio spectrum detected by Turner & Ho (1994), Herrnstein et al. (1998), and the 22 GHz offset. We explain this by the canonical jet model of Blandford & Königl (1979) (see also Falcke & Biermann 1999). The numerical approach is presented in Falcke (1996) and Falcke & Markoff (2000). The plasma will become supersonic after being accelerated in a “nozzle”. The velocity profile along the jet is then calculated by solving the relativistic Euler equation. The opening angle of the jet is determined by the Mach number of the jet, . Given the mass loss rate in the jet determined at the base of the jet, , the density profile is then determined. After the radiative zone, the jet plasma initially emits very little since the electrons are very cool after radiating most of their energy away. However, we assume that after propagating a certain distance from the nucleus, , the electrons in the jet will be accelerated through, e.g., the internal shocks due to the velocity irregularities in the jet beam (Rees 1978). The electrons will then be accelerated again into a power-law form, , with and taking the standard strong shock value , although the model is not sensitive to the exact value. The average energy of electrons (or equivalently ) can be calculated by the relativistic shock transition condition,
| (11) |
Here is the bulk Lorentz factor of the jet at and is the energy density factor of electrons.
The shock location must be . Herrnstein et al. (1998) obtained the 22 GHz upper limit by extracting the emission located within an mas box centered on the peak of the northern jet emission located at mas. This requires that the contribution to the 22 GHz flux from the jet within the region must be below the 220Jy upper limit. We therefore set , but again the fit is not sensitive to its precise value.
Our calculation indicates that and for . Further assuming equipartition between the electrons and magnetic energy, and a viewing angle of (Miyoshi et al. 1995), we can calculate the emergent spectrum of the jet and the location of the peak, , of the emission at a frequency . The result is shown by the thin solid line in Fig. 1. We see that it fits the results of Turner & Ho (1994) and Herrnstein et al. (1998) very well 888We find the synchrotron emission in the jet in NGC 4258 is optically thin. This can be understood directly from observations (GNB99). Observation indicated that the opening angle of the jet is about (Herrnstein et al. 1997). The radio brightness temperature is K, which is much smaller than the kinetic temperature of electrons responsible for the emission, K.. Moreover, in our result, the 22 GHz emission mainly comes from the location mas from the nucleus, satisfying the observed (time variable) mas offset (Herrnstein et al. 1998). We explain the variation of the offset with time as due to the variation of the shock location . If , to fit both the 22GHz flux and its offset simultaneously, a much smaller would be required. But in this case, the synchrotron emission from the jet within the region would greatly exceed the 0.22 mJy upper limit. This supports our adopted , and further, our jet-ADAF model of NGC 4258.
As shown by the thin solid line in Fig. 1, the contribution from the outer part of the jet to the X-ray flux can be neglected compared to the cooling layer at the base of the jet. NGC 4258 is the only source for which, to our knowledge, both the offset and an upper limit of the 22 GHz emission from the nucleus are so precisely determined. This suggests that it may be possible that the X-ray spectra of some sources which were previously attributed to emission from the outer part of the jet actually comes from the base of the jet (or in other words, the coupling region between the jet and accretion disk). Of course, an additional important factor when we compare the respective contribution of the outer jet and base of jet is the Doppler factor (). At the base of the jet, , but for the outer part of the jet, in general deviates from 1 significantly, depending on the value of . For NGC 4258, , so , and the emission from the base of the jet dominates over that from the outer part of the jet. But for some sources like Blazars, , thus the emission from the outer part of the jet may dominate over that from the base of the jet. Taking the effect of into account, the candidates in which emission from the base of the jet may dominate over the outer jet are those having misaligned jets. M87 will be a good example.
3.4 Model predictions
Taking into account the emission from the outer part of the jet and the base of the jet, our model makes the following predictions for NGC 4258:
-
•
There exists an infrared bump peaked at m. The radio spectrum should be flat with spectral index of until a break frequency , with the exact value depending on the accretion rate of the underlying ADAF. These results can be tested by the future ALMA telescope.
-
•
Rapid variability at IR band with timescale of hr is expected as detected in X-ray band, and the IR and X-ray variability should be tightly correlated.
-
•
A somewhat weaker prediction of our model is that, if the mass ejection from the accretion disk suffers the same kind of ejection-related instability as in microquasar GRS 1915+105 ( Dhawan, Mirabel, & Rodriguez 2000) and maybe also Sgr A∗ (Zhao et al. 2001), a similar quasi-periodic variability at submm-IR bands should be detected. The period in the case of Sgr A∗ is about four months (Zhao et al. 2001; Yuan & Zhao 2002). Scaled with the mass of the black holes, we predict a variability period of about yrs at submm-IR bands in NGC 4258 .
-
•
Extending these predictions to other sources, we will argue in the next section that the spectra of some LLAGNs may have the same origin as NGC 4258. In this case we would predict strong correlations between the radio, submm, IR, and X-ray emission in these sources.
4 Discussion: is NGC 4258 a typical LLAGN?
Recently much attention has been paid to LLAGNs, a class which includes many of our nearby galactic neighbors. This class of AGN is very common in the local universe, e.g., 43% of all northern galaxies brighter than mag are active in the form of emission-line nuclei classified as Seyferts or LINERs (Ho, Filippenko & Sargent 1997; Ho et al. 2001). The spectral energy distribution of LLAGNs are markedly different with the canonical luminous AGNs which are usually associated with the big blue bump (e.g., Elvis et al. 1994). Ho (1999) presented the spectra of a sample of seven LLAGNs for which reasonably secure black hole masses have been determined by dynamical measurements. Several most obvious features of their spectra are as follows (Ho 1999).
-
•
The optical/UV slope is quite steep. The averaged power-law index is 1.5, if two possibly highly reddened objects are excluded, while in canonical AGNs it is 0.5-1.0.
-
•
The UV band is exceptionally dim relative to the optical and X-ray bands. There is no evidence for a big blue bump component in any of the objects. The spectrum reaches a local minimum somewhere in the far-UV or extreme-UV region.
-
•
If fitting the X-ray spectra with a power-law (), the spectral index obtained is very variable among the sources, 999After the publication of Ho (1999) paper, new X-ray observational data of two sources are available, namely for M87 (Böhringer et al. 2001; Wilson & Yang 2002), for NGC4579 (Eracleous et al. 2002), and for M81 (Page et al. 2002)..
-
•
There is tentative evidence for a maximum in the spectrum at mid-IR or longer wavelengths.
-
•
The nuclei have radio spectra that are either flat or inverted.
Ho (1999) argued that the absence of the big blue bump is a property intrinsic to the nuclei and not an artifact of strong dust extinction. In addition to the above spectral features, the iron line in LLAGNs is in general extremely weak or absent (Terashima et al. 2002).
In contrast with the obvious importance of LLAGNs, we are still not clear about their physics. From their low luminosity in units of Eddington luminosity, the absence of big blue bump, the weak or absent iron line, and other observational facts, we can deduce that the inner region of the accretion disk may be best described as an ADAF rather than SSD (e.g., Ho 2002). However, it is very hard for an ADAF to fit the spectra of LLAGNs. Quataert et al. (1999) use an SSD-ADAF transition model to fit the spectra of two LLAGNs, namely M81 and NGC4579. In addition to underpredicting the radio spectrum, which they attribute to the “contamination by jets”, the predicted optical/UV spectra are somewhat too steep. This is because in their model the optical/UV is mainly produced by a SSD whose spectrum is exponentially decreasing at this waveband. It may be even more challenging to fit the spectra of other LLAGNs in the sample of Ho (1999) with such a model.
On the other hand, the excellent agreement between the spectra of NGC 4258 and of general LLAGNs indicates that NGC 4258 is likely a typical LLAGN. In fact, it seems to be the LLAGN for which we have the best data so far, although Sgr A∗ is a close second. NGC 4258 is better, however, since in addition to the precise determination of the mass of the black hole, the distance to the source, and the broadband spectrum ranging from radio to hard X-ray, NGC 4258 has additional extremely important constraints. Specifically, the 220 Jy upper limit and the offset at 22GHz may provide ways to determine the mass accretion rate from the modeling of the water maser emission. Thus the success of our jet-ADAF model in explaining the spectra of both NGC 4258 and Sgr A∗ may be relevant to our understanding of other LLAGNs.
We therefore suggest that the spectra of LLAGNs are at least partly due to the emission of the jet, namely that the synchrotron emission from the base of the jet is responsible for the steep IR/optical/UV spectrum peaked roughly at mid-IR, and its self-Comptonized emission produces the X-ray spectrum. The flat/inverted radio spectrum comes from further out in the jet. In the radio wavebands, this seems to be already well-established (Falcke 2001; Ulvestad & Ho 2001; Nagar et al 2001). Several important results of radio observations, i.e., high brightness temperature, the flat spectra, and the compactness of the radio cores, all are best explained by the emission from the jet. In the X-ray wavebands, the variety of the X-ray power law spectral indexes can be explained as due to the variety of both the peak frequency of synchrotron emission--and among the sources, similar to the variations in the X-ray spectrum of NGC 4258 as we discussed in Sect. 3.2. The variety of optical/UV power-law indexes may be the reflection of the complexity of shock type (radiative or adiabatic) and shock acceleration (the value of ).
The uncertainty in the extent of the underlying disk contribution adds complexity to this picture. It is possible that, at some wavebands or for some sources the emission from the underlying ADAF, and maybe also SSD, will be comparable with or even dominate over that from the jet. For example, observations indicate that X-ray variability on timescales less than a day is lacking in many LLAGNs although short-term variability has been detected in some LLAGNs (Ptak et al. 1998; Terashima et al. 2002). This may be an evidence for the dominance of ADAFs over jets at X-ray band in these sources because in an ADAF the X-ray emission can be dominated by bremsstrahlung process whose corresponding variability timescale is very long. The relative contribution of ADAF and SSD depends on the transition radius between them, while the relative contribution of the jet and accretion disk depends on our viewing angle with respect to the jet axis and the fraction of the accretion flow transferred into the jet.
Acknowledgements.
F. Y. thanks R. Chary for discussions on the infrared observation results of NGC 4258. The comments of Bozena Czerny, Charles Gammie, Yuichi Terashima, and Andrew Wilson are also acknowledged. This work is partially supported by China 973 Project under NKBRSF G19990754 (F.Y.) and AUGER Theory Grant O5CU1ERA/3 from the BMBF (S.M.).References
- (1)
- (2) Blandford, R.D., & Königl, A. 1979, MNRAS, 232, 34
- (3) Blandford, R.D., & McKee, C.F. 1976, Phys. Fluids, 19, 1130
- (4) Bower, G.C., & Backer, D.C. 1998, ApJ, 507, L117
- (5) Böhringer, H., Belsole, E., Kennea, J. et al. 2001, A&A, 365, L181
- (6) Braatz, J.A., Wilson, A.S., & Henkel, C. 1994, ApJ, 437, L99
- (7) Chary, R., & Becklin, E.E., 1997, ApJ, 485, L75
- (8) Chary, R., Becklin, E.E., Evans, A.S., Neugebauer, G., Scoville, N.Z., Matthews, K., Ressler, M.E., 2000, ApJ, 531, 756
- (9) Claussen, M.J., & Lo, K.Y. 1986, ApJ, 308, 592
- (10) Czerny, B., Rozanska, A., & Zycki, P.Y. 2000, New Astron. Rev. 44, 439
- (11) Dhawan, V., Mirabel, I.F., & Rodriguez 2000, ApJ, 543, 373
- (12) Draine, B.T., & McKee, C.F. 1993, ARA&A, 31, 373
- (13) Elvis M., Wilkes, B.J., McDowell, J.C., Green, R. et al. 1994, ApJS, 95, 1
- (14) Eracleous, M., Shields, J. C., Chartas, G., & Moran, E. C. 2002, ApJ, 565, 108
- (15) Falcke, H., 1996, ApJ, 464, L67
- (16) Falcke, H. 2001, Reviews in Modern Astronomy, 14, 15
- (17) Falcke, H. & Biermann, P.L. 1999, A&A, 342, 49
- (18) Falcke, H. & Markoff, S., 2000, A&A, 362, 113
- (19) Fiore, F. Pellegrini, S., Matt, G., Antonelli, L.A., et al. 2001, ApJ, 556, 150
- (20) Gammie, C., Narayan, R., & Blandford, R. 1999, ApJ, 516, 177 (GNB99)
- (21) Giebels, B., Bloom, E.D., Focke, W., Godfrey, G., et al. 2002, ApJ, in press (astro-ph/0203335)
- (22) Granot, J., & Königl, A. 2001, ApJ, 560, 145
- (23) Granot, J., Piran, T., & Sari, R. 1999, ApJ, 527, 236
- (24) Greenhill, L.J., Henkel, C., Becker, R., Wilson, T.L., Wouterloot, J.G.A. 1995a, A&A, 304, 21
- (25) Greenhill, J.L., Jiang, D.R., Moran, J.M., Reid, M.J., Lo, K.Y., Claussen, M.J. 1995b, ApJ, 440, 619
- (26) Herrnstein, J.R., Greenhill, L., & Moran, J., 1996, ApJ, 468, L17
- (27) Herrnstein, J.R., Moran, J.M., Greenhill, L.J., Diamond, P.J., Miyoshi, M., Nakai, N., Inoue, M. 1997, ApJ, 475, L17
- (28) Herrnstein, J.R., Greenhill, L.J., Moran, J. M., Diamond, P.J., Inoue, M., Nakai, N., & Miyoshi, M. 1998, ApJ, 497, L69
- (29) Herrnstein, J.R., Moran, J.M., Greenhill, L.J., Diamond, P.J., et al. 1999, Nature, 400, 539
- (30) Ho, L. C. 1999, ApJ, 516, 672
- (31) Ho, L. C.,2002, to appear in Issues in Unification of AGNs, eds. R. Maiolino, A. Marconi, & N. Nagar (San Francisco: ASP), in press (astro-ph/0110439)
- (32) Ho, L. C., Feigelson, E.D., Townsley, L.K. et al. 2001, ApJ, 549, L51
- (33) Ho, L. C., Filippenko, A.V., Sargent, W. L. W. 1997, ApJ, 487, 568
- (34) Honma, F. 1996, PASJ, 48, 77
- (35) Kaiser, C.R., Sunyaev, R., & Spruit, H.C. 2000, A&A, 356, 975
- (36) Kardashev, N.S., Kuz’min, A.D., & Syrovatskii, S.I. 1962, Soviet Astron. A.J., 6, 167
- (37) Kato, S., Fukue, J., & Mineshige, S. 1998, Black-hole Accretion Disks (Kyoto University Press, Kyoto)
- (38) Koide, S., Meier, D.L., Shibata, K, Kudoh, T 2000, ApJ, 536, 668
- (39) Koide, S.. Shibata, K., & Kudoh, T 1998, ApJ, 495, L63
- (40) Lasota, J.-P., Abramowicz, M.A., Chen, X., Krolik, J., Narayan, R. & Yi, I. 1996, ApJ, 462, 142
- (41) Markoff, S., Falcke, H. & Fender, R. 2001, A&A, 372, L25
- (42) Makishima, K. Fujimoto, R., Ishisaki, Y., Kii, T. et al. 1994, PASJ, 46, L77
- (43) Menou, K. & Quataert, E. 2001, ApJ, 552, 204
- (44) Melia, F., & Falcke, H. 2001, ARA&A, 39, 309
- (45) Meyer, F. & Meyer-Hofmeister, E. 1994, A&A, 288, 175
- (46) Miyoshi, M., Moran, J., Herrnstein, J., Greenhill, L., Nakai, N., Diamond, P., & Inoue, M. 1995, Nature, 373, 127
- (47) Moran, J.M., et al. 1995, PNAS, 92, 11427
- (48) Nagar, N. M., Wilson, A. S., Falcke, H. 2001, ApJ, 559, L87
- (49) Narayan, R., Kato, S., & Honma, F. 1997, ApJ, 476, 49
- (50) Narayan, R., Mahadevan, R., & Quataert, E. 1999, in “The Theory of Black Hole Accretion Discs”, eds. M.A. Abramowicz, G. Bjornsson, and J.E. Pringle, (Cambridge University Press), p148
- (51) Neufeld, D.A., & Maloney, P.R. 1995, ApJ, 447, L17 (NM95)
- (52) Neufeld, D.A., Maloney, P.R., & Conger, S. 1994, ApJ, 436, L127
- (53) Paczyński, B., & Wiita, P. J. 1980, A&A, 88, 23
- (54) Page, M.J., Breeveld, A.A., Soria, R., & Wu, K. 2002, to appear in the proceedings of the symposium “New Visions of the X-ray Universe in the XMM-Newton and Chandra Era” (astro-ph/0203396)
- (55) Pietsch, W., & Real A.M. 2002, A&A, 384, 793
- (56) Ptak, A., Yaqoob, T. Mushotzky, R., Serlemitsos, P., & Griffiths, R. 1998, ApJ, 501, L37
- (57) Rieke, G.H. & Lebofsky, M.J. 1978, ApJ, 220, L37
- (58) Reynolds, C.S., Nowak, M., & Maloney, P.R. 2000, ApJ, 540, 143
- (59) Quataert, E., Di Matteo, T., Narayan, R., & Ho, L.C. 1999, ApJ, 525, L89
- (60) Readhead, A.C.S. 1994, ApJ, 426, 51
- (61) Rees, M.J. 1978, MNRAS, 184, 61
- (62) Shakura, N.I., & Sunyaev, R.A., 1973, A&A, 24, 337
- (63) Spinoglio, L., Malkan, M.A., Rush, B., et al. 1995, ApJ, 453, 616
- (64) Spruit, H.C., & Deufel, B. 2002, A&A, in press (astro-ph/0108497)
- (65) Stüwe, J.A., Schulz, H., & Hühnermann, H. 1992, A&A, 261, 382
- (66) Terashima, Y., Iyomoto, N., Ho, L.C., & Ptak, A. 2002, ApJS, 139, 1
- (67) Turner, J.L., & Ho, P.T.P. 1994, ApJ, 421, 122
- (68) Ulvestad, J. S., Ho, L.C. 2001, ApJ, 562, L133
- (69) Wilkes, B.J., Schmidt, G.D., Smith, P.S., et al. 1995, ApJ, 455, L13 (W95)
- (70) Wilson, A.S. & Yang, Y. 2002, ApJ, 568, 133
- (71) Wilson, A.S., Yang, Y., & Cecil, G. 2001, ApJ, 560, 689
- (72) Yuan, F., Markoff, S., & Falcke, H., 2002, A&A, 383, 854 (YMF02)
- (73) Yuan, F., Peng, Q.H., Lu, J.F., & Wang, J.M. 2000, ApJ, 537, 236
- (74) Yuan, F., & Zhao, J.H. 2002, to appear in the proceeding of “Astronomy and Chinese Astronomy: Present and Future”, Mainland and Overseas Young Chinese Astronomer Colloquium (astro-ph/0203050)
- (75) Zhao, J.H., Bower, G.C., & Goss, W.M. 2001, ApJ, 547, L29