A collimated flow driven by radiative pressure from the nucleus of quasar Q 1511+091††thanks: Based on observations carried out at the European Southern Observatory (ESO) under prog. ID No. 65.P-0038 and 65.O-0063 with the UVES spectrograph on the Very Large Telescope (VLT) at Cerro Paranal Observatory in Chile.
Abstract
High velocity outflows from quasars are revealed by the absorption signatures they produce in the spectrum of the quasar. Clues on the nature and origin of these flows are important for our understanding of the dynamics of gas in the central regions of the Active Galactic Nucleus (AGNs) but also of the metal enrichment of the intergalactic space. Line radiation pressure has often been suggested to be an important process in driving these outflows, however no convincing evidence has been given so far. Here we report observation of a highly structured flow, toward Q 1511+091, where the velocity separations between distinct components are similar to O vi, N v and C iv doublet splittings with some of the profiles matching perfectly. This strongly favors the idea that the absorbing clumps originate at similar physical location and are driven by radiative acceleration due to resonance lines. The complex absorption can be understood if the flow is highly collimated so that the different optically thick clouds are aligned and cover the same region of the background source. One component shows saturated H i Lyman series lines together with absorptions from excited levels from C ii and Si ii but covers only 40% of the source of continuum. The fact that clouds cover only part of the small continuum source implies that the flow is located very close to it.
keywords:
Quasars: absorption lines – Quasars: individual: Q 15110911 Introduction

Comprehensive understanding of the nature and origin of gas flows in the very central regions of AGNs is elusive despite decades of intensive investigation. Presence of outflows with very large velocities (20000 km s-1) is revealed by the broad as well as narrow absorption lines (BALs and NALs) observed in the spectrum of AGNs. It has been suggested for long that the momentum transfered through resonance absorption lines could play an important role in driving these flows as it does in the case of O star winds (Castor, Abbott & Klein 1975; Arav, Li, & Begelman 1994). However, signatures of acceleration, though claimed to be noted in nearby Seyfert galaxy NGC 3515 (Hutchings et al. 2001), are not generic.
A possible way to reveal line-driven acceleration is the presence of absorption features with velocity separation similar to doublet and/or multiplet splittings (a consequence of the so-called “line-locking” effect). Such a structure in absorption is achieved when there is a reduction in the flux that drives the far away gas element due to line absorption produced by the gas closer to the QSO (Scargle 1973; Braun & Milgrom 1989). For higher efficiency, the gas from different elements of the flow must cover the same region of the background source. Since the gas producing intrinsic absorption is known to cover the background source only partially (Petitjean et al. 1994; Hamann 1997; Barlow & Sargent 1997), line-locking can be achieve in this case if the flow is somehow collimated. This may be one of the reasons why tentative evidences for line-locking (Foltz et al. 1987; Srianand 2000; Srianand & Petitjean 2001; Vilkoviskiji & Irwin 2001) as well as double trough (the so-called Lyman-alpha ghost) seen in the mean profile of BALs (Weymann et al. 1991; Korista et al. 1993; Arav, Li & Begelman 1994) are not completely convincing. In this paper we present clear evidence for a flow that is highly structured through radiative pressure modulated by absorption in different resonance lines.
2 Observations
| Component | species | ||
|---|---|---|---|
| 2.8186 | C iv | 0.100.04 | |
| 2.8398 | C iv | 0.480.02 | |
| 2.8523 | Ly | 0.300.01 | |
| Ly series | 0.300.40 | ||
| C iv | 0.500.01 | ||
| Si iv | 0.300.05 | ||
| N vb | 0.460.01 | ||
| 2.8607 | Ly | ||
| Ly series | 0.400.45 | ||
| Al iii | 0.430.03 | ||
| C iv | |||
| Si iv | |||
| 2.8641 | C iv | 0.770.01 | |
| N v | 0.750.02 | ||
| (blue) | 2.8908 | Ly | |
| C iv | |||
| Si iv | 0.280.12 | ||
| N v | 0.220.03 | ||
| (red) | 2.8934 | Ly | |
| C iv | |||
| Si iv | 0.170.07 | ||
| N v | 0.180.02 | ||
| b Line saturation is assumed | |||
We have used the Ultra-violet and Visible Echelle Spectrograph UVES (D’Odorico et al. 2000) mounted on the ESO KUEYEN 8.2 m telescope at the Paranal observatory on April 4-7 2000 to obtain a high-spectral resolution spectrum of the = 2.878 and = 17 quasar Q 1511+091. Two standard dichroic settings have been used to observe with both arms of the spectrograph at the same time. The final wavelength range is 326010,000 Å. The slit width was 1 arcsec resulting in a resolution of 45000. The total exposure time was 10 hours in seeing conditions better than 0.8 arcsec full width at half maximum. The data were reduced using the UVES pipeline, a set of procedures implemented in a dedicated context of MIDAS, the ESO data reduction package. The main characteristics of the pipeline is to perform a precise inter-order background subtraction for science frames and master flat-fields, and to allow for an optimal extraction of the object signal rejecting cosmic ray impacts and performing sky-subtraction at the same time. The reduction is checked step by step. Wavelengths were corrected to vacuum-heliocentric values and individual 1D spectra were combined together. This resulted in a S/N ratio per pixel of 25 at 3600 Å and 80 at 6000 Å. Typical errors in the wavelength calibration are less than 0.5 km s-1.
3 Covering factor
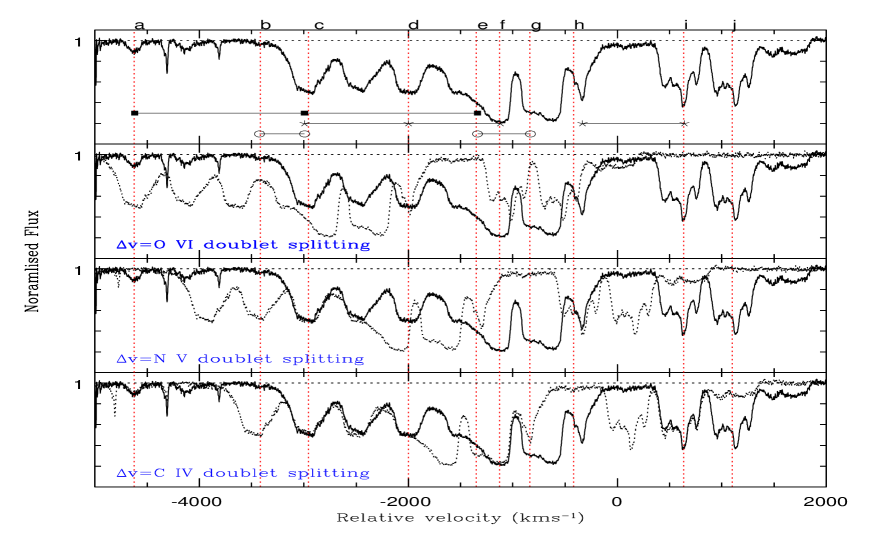
The UVES spectrum of Q 1511+091 over the C iv and Si iv emission line wavelength ranges is shown in the left-hand side panels of Fig. 1 together with the fit to the effective continuum (i.e., quasar continuum plus broad emission lines) we used to normalize the spectrum. Partial coverage of the absorbing gas implies some residual at the bottom of absorption lines even if they are heavily saturated. Partial coverage is apparent when the two resolved lines of a doublet, with different oscillator strengths, have the same apparent residuals without going to zero. This is obviously the case for most of the components in the C iv flow toward Q 1511+091. The two absorption lines of the C iv doublet corresponding to components a, c, d and f have exactly the same apparent depths over their profiles. It can be seen on right panels of Fig. 1 that when the spectrum is shifted by the velocity separation of the two lines of the C iv doublet, the profiles coincide nearly perfectly for most of the wavelength range. Using the method described in Srianand & Shankaranarayanan (1999) we estimated the covering factor for different species in individual components. The results are given in Table. 1.
It is possible to say that different part of the flow cover the same background region. Indeed, it can be noted that when C iv1550 of one component, say component 1, overlaps with C iv1548 of another component, say component 2, the resultant optical depth, although smaller than 0.5 is not the sum of the optical depths of the two absorption lines. This is particularly striking for C iv1548 of component e and C iv1550 of component d or for C iv1548 of component g and C iv1550 of component e. This can be understood if one of the saturated components, say component 1, is shielding the other component, say component 2 in such a way that the flux supposed to reach component 2 in C iv1548 is absorbed completely by component 1 in C iv1550. This explains why, although blending is apparent, the C iv1548 profile matches so closely the same profile shifted by the velocity splitting between the two C iv lines (see Fig. 2). This shows that at least part of the flow is collimated and covers the same part of the emitting region.
4 Signatures of line-driven acceleration
| Doublet | splitting | components | separation |
|---|---|---|---|
| (km s-1) | (km s-1) | ||
| C iv | 499 | b - c | 495 |
| e - g | 499 | ||
| N v | 962 | c - d | 969 |
| d - f | 930 | ||
| e - h | 924 | ||
| O vi | 1650 | a - c | 1660 |
| c - e | 1625 |
The most striking observation in this flow is that the velocity differences between distinct components coincide with various doublet velocity splittings (see Fig 2 and Table. 2). The most apparent coincidences are seen for the N v doublet splitting. Both the C iv lines of components c and d match very closely. Not only the velocity difference between the centroids of the two components is very close to the N v doublet splitting but also the residual intensities and the widths of the components ( 300 km s-1) are nearly identical. Very good matchings are also seen for one of the lines of e and h and d and f. In addition to this we notice that components h (defined by weak albeit broad C iv1550 and O vi absorptions) and j are separated by the N v doublet splitting (see Fig. 2). For the O vi splitting, coincidences are seen for components a and c, c and e (with similar residuals). This is complemented by coincidences with C iv splitting between b and c but mostly between e and g and between component i and diffuse absorption component j.
In a spectral range where crowding of absorption lines is so important, chance coincidences are possible. In order to consider the probability that such coincidences occur by chance, we randomly populated the observed velocity range with 10 components. Using 106 realizations we find a probability of 6 for the occurrence of, at least two coincidences, each with the velocity splittings of the O vi , N v or C iv doublets with a matching uncertainty of 20 km s-1. If we introduce the additional condition that at least two coincidences occur between three components in O vi splitting (like the one seen among a-c and c-e) the probability becomes for a wavelength matching uncertainty of 20 km s-1.
This low probability for mere velocity coincidence together with tight matching of some of the profiles and consistent covering factors clearly confirms the line-locking situation in this system. It must be noted that, although the corresponding wavelength range is crowded by intervening lines, additional coincidences are apparent between the corresponding O vi absorptions. In addition, the velocity separation between components a and the red component of i ( km s-1) is very close to the N v to Ly velocity splitting. Therefore, all components are connected by a complex set of coincidences. Under the assumption that line-locking is structuring the flow, it is expected that components with larger covering factors be located closer to the source. This would imply in that case that the flow is an accelerating wind.
5 Discussion
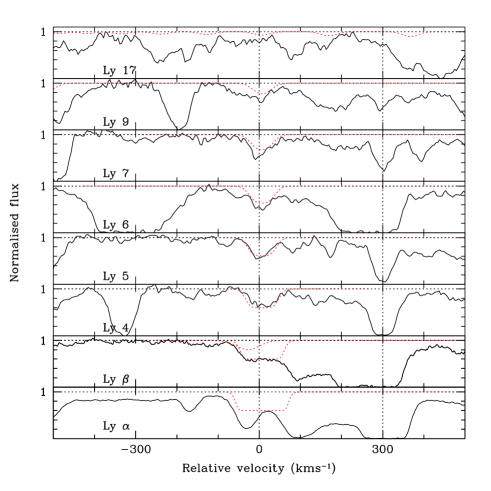
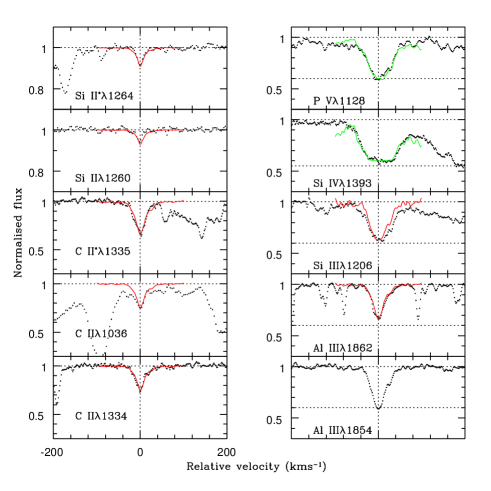
The physical conditions in part of the flow can be investigated from the very peculiar component e at = 2.8606 (1350 km s-1 in Fig. 2). Absorption lines from H i Lyman series lines as well as excited levels of singly ionized species C ii and Si ii are present (see Fig. 3 and from C ii to P v. However, none of the Lyman series absorption lines are dark. Lyman- is not even seen as a distinct component when it should be conspicuous. Similar situation was observed by Telfer et al. (1998) toward QSO SBS 1542+531. From the flat bottom of the Lyman- line, it is apparent that the cloud does not cover the background source completely. Higher Lyman series lines are well fitted with a covering factor of the order of 0.4. It must be noted that the emission lines for the corresponding transitions are negligible compared to the continuum. In addition, such a low covering factor can not be accommodated by scattered light (Ogle et al. 1999) . Therefore, it can be concluded that the cloud covers only about 40% of the central source of continuum whose radius is of the order of 10-3 pc. All neutral hydrogen lines can be fitted consistently (see Fig. 3) with and log (H i) 16.30. A consistent model for all other absorption lines is found with this covering factor (see Fig. 4) and using the Al iii and Si iii profiles as templates for, respectively, the singly-ionized and high-ionization species. The difference between the two profiles is mainly due to an extra component in the red wing that is seen in Si iii and other higher ionization lines. Note that although the centroids of the lines are the same, the width of the lines increases with ionization.
It is striking to note that with this covering factor, the ratios C ii∗/C ii and Si ii∗/Si ii are found to be both of the order of two which is the value expected in case of thermal equilibrium. Given the ionization state of the gas (see below), the temperature is most probably larger than 104 K, and from the thermal equilibrium between populations of Si ii levels we can derive the electronic density 103 cm-3 (T4 is the temperature in the units of 104 K). For a Mathews & Ferland (1987) QSO ionizing spectrum, and using the constraints from observed ion ratios, the ratio of the ionizing photon density to the hydrogen particle density (the so-called ionization parameter, U) can be shown to be in the range 2.0 log 0.6. The metallicities are most probably larger than solar. This is somewhat consistent with the typical values obtained for the Broad Line Region, 1.0 log 0.0 and cm-3, although the density is probably smaller in the cloud (see below). Assuming a typical luminosity density at the Lyman limit of , and a spectral index of the maximum distance of the absorbing gas from the source is . The lower limit on derived above suggests the gas has to be at a distance less than a few kpc from the ionizing source.
From the absence of absorption due to C iii originating from an excited metastable level, we derive an upper limit on the density of 8 cm-3. This gives a minimum distance of a few 10-1 pc. Thus the observations are consistent with the absorbing gas being inside or close to the BLR.
For a spherical absorbing cloud the particle density is (H)/, where and (H) are the radius of the continuum emitting region and the total hydrogen column density of the absorbing gas (in the range, (H) cm-2, from the models) respectively. For the lower limit on density we get, pc.
The largest blue-shift observed in the C iv profile is much smaller than the typical terminal velocities of BAL flows. This probably means that the gas could be further accelerated. Indeed, for physical conditions similar to those observed in different components of the Q 1511+091 outflow, the line-radiation force is much larger than gravity even in the close proximity of the black-hole (de Kool & Begelman 1995) . Most of the hydrodynamical radiatively driven wind models predict the gas to reach terminal velocity at a distance of a few pc from the ionizing source (Arav et al. 1994). Lack of acceleration in components with velocity much lower than the terminal velocity could be accounted for if either our line of sight probes a small portion of a non-radial flow (Arav 1996) or the extra drag forces are at play in reducing the effective acceleration of the gas. In the case of Q 1511+091, the absorption lines are seen at redshift very close to or slightly higher than the systemic redshift. In addition, nearly perfect velocity matching with doublet splittings suggests that the direction of the flow is very close to our line of sight.
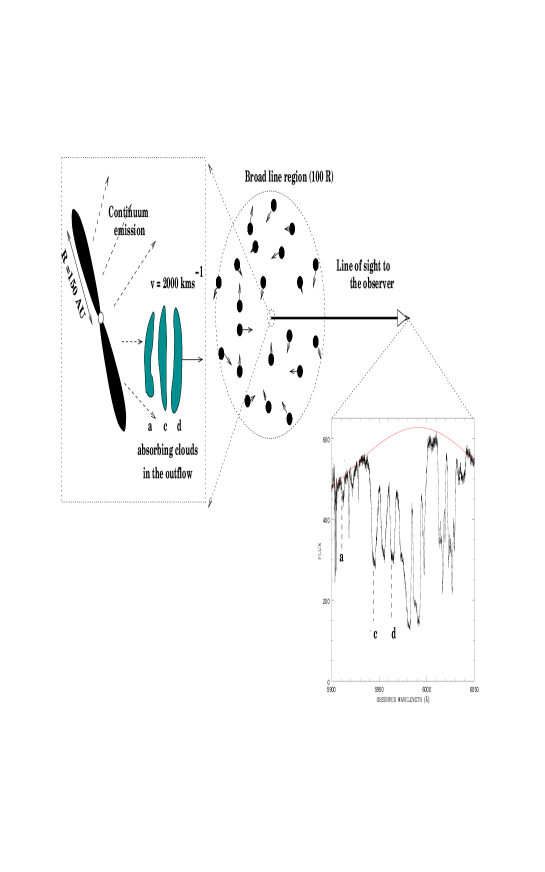
Disk winds have been suggested as the natural origin for ejected material from quasars giving rise to BAL systems (de Kool & Begelman 1995; Murray et al. 1995; Proga et al. 2000). In these models, a cylindrically symmetric disk wind is ejected away from the surface of the disk and is radiatively accelerated radially once exposed to the strong continuum source. Line-driven instabilities could lead to the formation of distinct velocity components seen in the flow (Feldmeier et al. 1997). Our observations illustrated in Fig. 5 support the basic mechanism at work in these models. It would be very interesting to constrain the acceleration over a large time-scale for our understanding of the nature of drag forces and in general the nature of the flow.
acknowledgments
We thank the referee, Dr. N. Arav, for useful comments. We gratefully acknowledge support from the Indo-French Centre for the Promotion of Advanced Research (Centre Franco-Indien pour la Promotion de la Recherche Avancée) under contract No. 1710-1. This work was supported in part by the European Communities RTN network ”The Physics of the Intergalactic Medium”. RS thanks the Institute of Astronomy in Cambridge and the Institut d’Astrophysique de Paris and PPJ thanks IUCAA for hospitality during the time part of this work was completed.
References
- [1] Arav N., 1996, ApJ, 465, 617
- [2] Arav N. & Begelman M., 1994, ApJ, 434, 479
- [3] Arav N., Li Z., Begelman M., 1994, ApJ, 432, 62
- [4] Barlow T. A. & Sargent W. L. W., 1997, AJ, 113, 136
- [5] Braun E. & Milgrom M., 1989, ApJ, 342, 100
- [6] Castor J. I., Abbott D. C., Klein R. I., 1975, ApJ, 195, 157.
- [7] de Kool M. & Begelman M. C, 1995, ApJ, 455, 448
- [8] D’Odorico S., et al., 2000, SPIE, 4005,1
- [9] Feldmeier A., Norman C., Pauldrach A., Owocki S., Puls J., Kaper, L., 1997, in Mass ejection from Active Galactic Nuclei, ASP Conference Series, Vol, 128, p258.
- [10] Foltz C. B., Weymann R. J., Morris S. L., Turnshek D. A., 1987, ApJ, 317, 450
- [11] Hamann F., 1997, ApJS, 109, 279
- [12] Hutchings J. B., et al., 2001, ApJ, 559, 173
- [13] Korista T. K., Voit G. M., Morris S. L., Weymann R. J., 1993, ApJS, 88, 357
- [14] Mathews W. G. & Ferland G. J., 1987, ApJ, 323,456
- [15] Murray N., Chiang J., Grossman A., Voit M., 1995, ApJ. 441, 498
- [16] Ogle P. M., Cohen M. H., Mill J. S., Tran H. D., Goodrich R. W., Martel A. R., 1999, ApJS, 125, 1
- [17] Petitjean P., Rauch M., Carswell R. F., 1994, A&A, 291,29
- [18] Proga D., Stone J. M., Kallman T. R., 2000, ApJ, 543, 686
- [19] Sargent, W. L. W., Steidel, C. C., & Boksenberg, A. 1988, ApJS, 68, 539
- [20] Scargle J. D., 1973, ApJ, 179, 705
- [21] Srianand R., 2000, ApJ, 528, 617
- [22] Srianand R. & Petitjean P., 2001, A&A, 357, 414
- [23] Srianand R. & Shankaranarayanan, 1999, ApJ, 518, 672
- [24] Telfer R. C., Kriss G. A., Zheng W., Davidsen A. F., Green R. F., 1998, ApJ, 509, 132
- [25] Vilkoviskiji E. Y. & Irwin M. J., 2001, MNRAS, 321, 4
- [26] Weymann R. J., Morris S. L., Foltz C. B., Hewett P. C., 1991, ApJ, 373, 25