First Spectroscopic Evidence for Carbon Stars Outside the Local Group: Properties of a Massive Star Cluster in NGC 7252††thanks: Based on observations obtained at the NTT 3.5m of the European Southern Observatory, Chile.
We present near-infrared [m] spectroscopy of the massive
intermediate age star cluster W3 in the merger remnant and proto-elliptical
galaxy NGC 7252, obtained with the NTT telescope.
This cluster has an age when the integrated near-infrared properties of
a stellar population are dominated by the cool and luminous Asymptotic Giant
Branch (AGB).
We compare the data with instantaneous burst model predictions from new
evolutionary synthesis models that include: (i) the computation of the evolution
through the thermally pulsing AGB (TP-AGB) for low- and intermediate-massive stars,
with the initial mass and metallicity dependent formation of carbon stars;
(ii) spectroscopic data from a new stellar library in which differences between
static red giants, variable oxygen rich TP-AGB stars and carbon stars are accounted
for. The new evolutionary model predicts that the contribution of carbon rich stars
to the luminosities in the near-IR passbands is a strong function of metallicity.
The comparison of the data to the models clearly shows that carbon stars are
present: for the first time, carbon rich star spectral features are thus detected
directly outside the Local Group galaxies. Good fits to the available
optical/near-IR photometry and the near-IR spectrum of NGC 7252-W3 are found for
an age of 300-400 Myr and A.
The models show that these parameters depend weakly on the model metallicity in the
range of Z/Z, with higher likelihood for solar metallicity models.
At solar metallicity, a mixture of carbon rich and oxygen rich stars is predicted.
The strength of the near-IR molecular bands that originated from oxygen rich
AGB stars can be used to constrain the absolute Teff scale of these objects,
i.e. a relation between colour and Teff. We found that, in the framework
of our set of evolutionary tracks, the data are more
consistent with the temperature scale calibrated on Long Period Variables than on
giant stars. At a given colour, variable AGB stars have a lower Teff than
static (or quasi-static) M giants.
Key Words.:
stars: AGB – galaxies: star clusters – galaxies: stellar content – infrared: galaxies1 Introduction
For the past decades, great efforts have been devoted to the determination of the star formation history of complex stellar systems, such as galaxies, with the ultimate aim of understanding the history of star formation on cosmological timescales. In such composite systems, we look at a mixture of stellar populations with large spreads in age and metallicity (Möller et al. 1997). The picture is further blurred by the presence of dust. An extended observational wavelength coverage is a major advantage in attempts to break the degeneracies between the effects of age, metallicity and extinction on galaxy light. In this context, near-infrared (near-IR) observations are justified by the relatively low sensitivity of near-IR light to dust extinction (stellar subpopulations that are heavily obscured contribute more to the near-IR light than they do at shorter wavelengths), and because the near-IR light originates specifically in subpopulations of old or metal-rich stars (Frogel et al. 1978, Rieke & Lebofsky 1979, Frogel 1985, Silva 1996, Lançon et al. 1996, Goldader et al. 1997, Fritze-von Alvensleben 1999). In practice, the interpretation of the near-IR stellar energy distribution frequently remains limited to the global confirmation of the presence of “old” stars or, in starburst environments, to the suggestion of a yr young population of red supergiants (Oliva et al. 1995, Lançon & Rocca-Volmerange 1996). In particular, the specification of the actual age of the “old” stars seems to have stayed out of reach. This is mainly due to large uncertainties in the physics of cool stars, used as input to the population synthesis calculations (Charlot et al. 1996, Girardi 1996, Origlia et al. 1999, Lançon et al. 1999).
Important progress in extragalactic near-IR astronomy would be achieved if contributions from intermediate age (2 Gyr, but 100 Myr) and old (2 Gyr) populations could be safely separated in the integrated light of galaxies. At intermediate ages, asymptotic giant branch stars (AGB stars) are responsible for most of the K-band flux. Integrated broad band colours are determined by these stars (Frogel et al. 1990, Bruzual & Charlot 1993, Girardi & Bertelli 1998, Mouhcine & Lançon 2002a). But broad band colours remain ambiguous, as they are similarly affected by extinction or by an additional population of red supergiants, AGB stars or metal-rich giants. Lançon et al. (1999; see also the early review of Lançon 1999) have suggested the use of the broad spectral signatures of upper AGB stars for an age separation. The basic idea is that most upper AGB stars are Long Period Variables (LPVs), and that this variability produces more extended atmospheres, thus leading to significantly stronger molecular bands. When oxygen-rich AGB stars become carbon-rich, they display specific molecular signatures that can again be identified. For the first time, stellar spectral libraries that included oxygen-rich LPVs and carbon stars had been used as input to an evolutionary spectral synthesis code. However, the qualitative predictions are strongly dependent on as yet only partly constrained AGB evolution parameters (Lançon et al. 1999, Mouhcine & Lançon 2002). For a given set of evolutionary tracks and a given library of stellar spectra, a very influential parameter is the temperature scale used to relate the two.
To improve the reliability of the synthesis models, we need to check the accuracy of their physical ingredients in simple cases. Star clusters provide an invaluable opportunity to do so. Because of their proximity and of the large range of properties they display, Magellanic Cloud (LMC, SMC) clusters were used extensively. However, LMC/SMC clusters contain only a handful of luminous red stars. Their integrated properties are strongly affected by the stochastic character of this small subpopulation (Santos & Frogel 1997, Ferraro et al. 1995). Lançon & Mouhcine (2000) have shown that coeval populations with more than M⊙ of stars are needed if one wishes random deviations from the mean near-IR properties predicted by population synthesis models to remain smaller than the effects of the model parameters of astrophysical interest. Repeated observations of M⊙ clusters or even larger masses are required in order to cancel effects of the variability of the brightest stars as well. Such massive clusters are rare in nearby resolved galaxies (Grebel 2000).
Over the last few years, the Hubble Space Telescope has revealed the presence of numerous young, compact and very bright knots in merging galaxies, e.g. NGC 4038/4039 (Whitmore & Schweizer 1995, Whitmore et al 1999), NGC 3597 (Holtzman et al. 1996), NGC 7252 (Miller et al 1997) and NGC 1275 (Carlson et al 1998). Their colours, luminosities, sizes and spatial extent agree with them being proto-globular clusters. These results suggest that galaxy interaction and mergers are favorable environments for the formation of globular clusters. The “Atoms for Peace galaxy” NGC 7252 (Arp 226) is one of the most extensively studied merging remnants. Star clusters of exceptional luminosity were discovered in NGC 7252 (Schweizer 1982, Whitmore et al. 1993). The analysis of UBV and I photometry leads to estimated ages of several 100 Myr and extraordinary masses of M⊙ for the most luminous ones (Miller et al 1997). The NGC 7252 massive clusters offer us the possibility to calibrate the stellar input of our near-IR modelling of intermediate age SSPs without worrying about stochastic fluctuations.
In Section 2 we describe the observations and the data reductions. Section 3 presents an overview of our new modelling of near-IR spectra of SSPs. In Section 4, we highlight the evidence for a significant population of carbon stars in he near-IR spectrum of NGC 7252–W3 (hereafter W3). In Section 5, we combine UBVIKs photometry and the near-IR spectrum to derive new constraints on the age of the cluster and the extinction on the line of sight. Constraints on the cluster metallicity and on the temperature scale of AGB spectra are discussed in Section 6. A comparison with previous models, in which the evolutionary tracks for the TP-AGB did not account for “hot bottom burning”, is given in Section 7. Finally, Section 8 summarizes the main conclusions.
2 Cluster selection, observations and data reductions
2.1 Selection
The ”Atoms for Peace” galaxy, NGC 7252, is located at , (J2000) (Miller et al 1997) with a recession velocity relative to the local group of (Schweizer 1982). We adopt a distance modulus and a Milky Way foreground extinction of (de Vaucouleurs et al 1990; Ho = 75 km s-1 Mpc-1).
The candidate clusters were selected from the lists of Whitmore et al. (1993) and Miller et al. (1997). Only clusters with estimated ages between 0.1 and 1 Gyr were considered good candidates for our purpose. At these ages, no red supergiant stars are present any more, which eliminates one potential source of contamination. Metallicities between Z=0.3 Z⊙ and Z=Z⊙ (based on the chemical evolution models of Fritze-von Alvensleben & Gerhard 1994) in fact suggest a much narrower age range of 600 to 800 Myr for these clusters. Schweitzer & Seitzer (1998) re-analysed the photometry and combined it with optical spectroscopy. They favoured solar abundances and slightly younger ages (300–600 Myr for cluster W3). Finally, Maraston et al. (2001) added K band photometry to the data and used updated models to confirm a metallicity range of 0.5 to 1 Z⊙, and to restrict the range of ages to 300–500 Myr (for cluster W3, they favoured Z=0.5 Z⊙ and an age of 250–300 Myr).
The observable intermediate age clusters are intrinsically bright, with M and M. Assuming standard stellar initial mass functions (Salpeter 1955, or Scalo 1986), this corresponds to stellar masses of the order of 107 M⊙ or more: all these clusters are massive enough to host a representative population of luminous AGB stars.
2.2 Imaging
J and Ks (K short; m) images of NGC 7252 were taken with the IR imager-spectrometer SOFI on the European Southern Observatory New Technology Telescope (La Silla, Chile) between August 14 and August 19, 1999. Two of the five half nights allocated to the program were adequate, and were used to acquire the imaging and the spectroscopic data of this paper.
SOFI has a field-of-view of and a pixel size of . All images were acquired by integrating repeatedly for equal amounts of time on the galaxy and on nearby sky fields. Both galaxy and sky frames were dithered with offsets , so that a median of the frames would effectively remove field stars, the detector defects and cosmic rays. This technique also has the advantage of minimizing residual flat-fielding errors. The individual object integration times were 200 s in Ks ( s) and 80 s in J ( s). The object/background integration cycle was repeated three times for the Ks band and 8 times for the J band. The resulting total on-object exposure times are 1000 s in Ks and 560 s in J. Standard stars from Persson et al. (1998) were used for the photometric calibration.
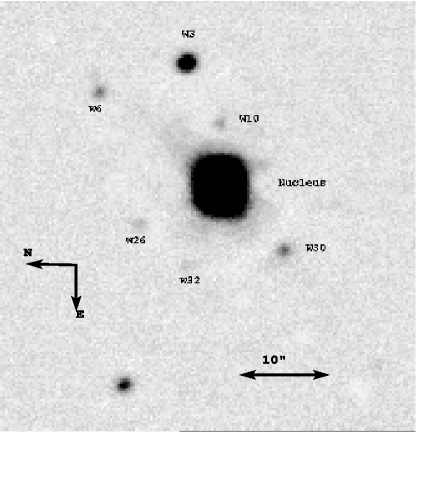
The images were processed with IRAF111The Image Reduction and Analysis Facility by the National Optical Astronomy Observatories which are operated by AURA, Inc., under cooperative agreement with the National Science Foundation, USA.. A dark frame was first subtracted from every object and sky image of a given data set. The dark frame was constructed from a median of dark exposures taken at the beginning or at the end of the night. The dark currents were very stable. Flatfields in the two bands were made by median combining the standard star images and subtracting the corresponding dark frame. These sky flatfields were found to be superior to the dome flatfields. The flatfield image was divided into each dark subtracted object and sky image. A reference background image for each band was then constructed by median-combining the sky images. This image was subtracted from all galaxy images of a given series of observations. The individual sky-subtracted galaxy images were then carefully shifted and median combined using a sigma-clipping algorithm to form a single final image of NGC 7252. We modelled the galaxy with a pixels median filter and subtracted the light profile of the galaxy, in order to obtain a flat, low-noise background. The masked J-band image of the central region of the galaxy is shown in Fig. 1, where the star clusters are marked using the identification numbers of Whitmore et al. (1993).
2.3 Spectroscopy
The low resolution grisms of SOFI make it possible to cover the spectral range between 0.95 and 2.52 m in only two settings. The blue setting ranges from 0.95 and 1.64 m , the red setting from 1.53 to 2.52 m. The extended wavelength coverage of each setting and the overlap between the two are decisive advantages of SOFI over other available medium resolution infrared spectrometers on 8-10m class telescopes. Indeed, the features that distinguish stellar populations of various ages in the near-IR are extremely broad (Lançon et al. 1999, Mouhcine & Lançon 2000). They reach over the telluric absorption bands that mark the edges of the J, H and K atmospheric windows. The vast majority of near-IR spectrometers only allow the observation of one window at a time. Varying slit losses from one observation to the next then make it extremely difficult to recover the relative flux levels of the spectral segments and to measure and use the spectral features.
For the first spectroscopic observations (blue setting), the slit was placed across two clusters, W3 and W30 (position angle 117.4). This slit position also covers the galaxy emission close to the nucleus. As weather made it clear that not enough signal would be collected for W30, the subsequent observations were made at position angle 104.6, with the slit running through W3 and the galaxy nucleus. The SOFI slit is long. Nodding along the slit for first order background subtraction was thus possible. Our observations consist of series of 40 minute nodding sequences, amounting to 9600 s exposure in the blue setting and 10800 s exposure in the red settings. Standard star spectra were taken before and after each sequence on NGC 7252.
The spectroscopic data for cluster W3 were reduced in the following steps. Pairs of frames obtained at two positions along the slit were combined by subtraction and flat-fielded, using the adequate lamp-on – lamp-off frame. The resulting frames carry a positive and a negative version of the spectrum. The numerous cosmic rays could only partially be removed with automatic procedures; careful eye inspection was used to remove cosmic rays very close to the cluster and galaxy light. Then the spectral images were calibrated in wavelength using a xenon lamp spectrum as a reference. To extract a one dimensional spectrum for the cluster, the cluster emission was traced along the two-dimensional images. The adopted extraction aperture width varied between 5 and 6 pixels, depending on the seeing. The combined galaxy background and residual sky background at each wavelength was estimated via a cubic spline fit to background windows on either side of the trace center. Following the background subtraction, each individual spectrum was flux calibrated using an average of standard star spectra taken before and after the scientific exposure. The division by the standard star spectrum removed telluric absorption features. Kurucz spectra (1993) were used as models for the intrinsic energy distribution of the standards, and thus to recover the energy distribution of the cluster. Individually calibrated cluster spectra from different images were then combined into one final spectrum. The square of the signal-to-noise ratio was used to weight the individual spectra. Finally, the blue and red spectra were merged.
3 Models for the near-IR emission of stellar populations
Studies of the evolution of the near-IR spectral energy distribution of intermediate age stellar populations need to take into account stars of the Early and of the Thermally Pulsing AGB, since both contribute significantly to the near-IR light (Frogel et al. 1990, Charlot & Bruzual 1991, Lançon 1999). The sets of evolutionary tracks or isochrones made available by stellar theory groups for use in population synthesis models do not in general extend beyond the Early AGB. An extension through the TP-AGB is required. Unfortunately the mechanisms driving the TP-AGB evolution are complex and still poorly understood (e.g. Iben & Renzini 1983, Habing 1996, Olofsson 1999). Uncertainties in the physics of mass loss, of the third dredge-up process, and of hydrogen burning at the bottom of the convective envelope, together with the lack of reliable models for the molecular spectral features of the coolest stars, make the inclusion of TP-AGB stars a difficult task. The integrated properties of the stellar populations in the near-IR will depend on the modelling of the TP-AGB phase (see Girardi & Bertelli 1998 for a clear illustration).
The analysis of the clusters of NGC 7252 is based on the new spectral synthesis models presented by Mouhcine & Lançon (2002a, hereafter ML2002), in which the TP-AGB contribution to the integrated light is taken into account. The synthetic stellar evolution code for the TP-AGB incorporates the above-mentioned physical processes, through parameters that have been adjusted to reproduce observational constraints from the Magellanic Clouds and the solar neighbourhood. It predicts the evolution of stars of various masses in the HR diagram, as well as the evolution of the surface chemistry and of the stellar mass (thus the formation of carbon stars and of dust-obscured mid-infrared sources). Moreover, it uses a stellar library that includes an appropriate optical + near-IR spectrum for each of these evolutionary stages. The reader is referred to ML2002 for a detailed description. Let us however summarize the main properties here.
Up to the E-AGB, the stars are assumed to follow the evolutionary tracks of the Padova group (e.g. Bressan et al. 1993 for [Z=0.008, Y=0.25], Fagotto et al. 1994 for [Z=0.02, Y=0.28]). The extensions through the TP-AGB include known physical processes that affect the evolution and play a dominant role in determining TP-AGB lifetimes, the extent of nuclear processing and the chemical surface abundances: the third dredge-up, the envelope burning, the mass loss and its final superwind phase. From the end of the E-AGB on, the total mass, core mass, effective temperature, bolometric luminosity and carbon to oxygen ratio in the envelope are evolved according to semi-analytical prescriptions (see Wagenhuber & Groenewegen 1998). The basic relations of the model are the following:
-
1.
a detailed core mass-luminosity relation;
-
2.
the core mass-interpulse relation;
-
3.
the rate of evolution of the core mass;
-
4.
an algorithm to evaluate the effective temperature;
-
5.
a test of the occurrence of CNO burning at the base of the convective envelope;
-
6.
a prescription to evaluate the mass loss rate as function of the stellar parameters;
-
7.
the third dredge-up and its efficiency;
-
8.
an assumed composition of the third dredge-up material.
The calculations used here are performed using a mixing length parameter , and the mass loss prescription of Blöcker & Schönberner (1993) with a mass loss efficiency of (Groenewegen & de Jong 1994). The end of TP-AGB phase is determined either by the total ejection of the stellar envelope, or by the core mass growing up to the Chandrasekhar mass limit.
The properties of the TP-AGB stars are sensitive to the initial metal content. This in particular affects the formation of carbon stars. The LM2001 models are able to reproduce the observed relation between the metallicity and the relative number of carbon stars (Pritchet et al. 1987), in the sense that lower initial metallicities result in higher proportions of carbon stars among TP-AGB stars, carbon stars being the dominant spectral type for [Fe/H] -1 (Blanco et al. 1978, Cook et al. 1986). This behaviour reflects the fact that the fraction of the total TP-AGB lifetime a model star spends as a carbon rich object is a function of metallicity. Stars at Z=0.05 with initial masses of 2-3 M⊙ (i.e. the privileged mass range for the formation of carbon stars; Mouhcine & Lançon 2001 b ) spend 10 % of their total TP-AGB lifetime as carbon stars, while the fraction reaches for the metallicity of the LMC or lower.

LW2001 use a code derived from Pégase (Fioc & Rocca-Volmerange 1997) for the synthesis of integrated spectra. The spectra of Lançon & Wood (2000), averaged as described by Lançon & Mouhcine (2001), are used for luminous stars with spectral types later than K5, and the colour-corrected spectral library of Lejeune et al. (1998) is used elsewhere along the stellar tracks. Cool and luminous TP-AGB stars are also variable stars. This variability strongly affects the near-IR energy distribution of those stars. They show deep water absorption bands when they are oxygen rich, and strong C2 and CN absorption bands when they are carbon rich. Hence the near-IR spectra of intermediate age stellar populations will change as the predominant stars change as function of age and metallicity. The adopted relation between the effective temperature of TP-AGB stars and their spectrum is a second parameter that affects the shape of the near-IR SSP spectra.
The evolutionary sequences computed for this paper assume that stars formed in an instantaneous starburst (star-formation timescale of 1 Myr or less), with a Salpeter (1955) power-law initial mass function extending from 0.1 to 120 M⊙.
To illustrate the effect of carbon stars on the integrated cluster light, we have computed additional model sequences in which exclusively the spectra of O-rich stars were used, regardless of the actual chemical composition given by the evolutionary tracks. The differences between the two sequences are most clearly visualized at subsolar metallicity (because carbon stars are more important) and at ages between 0.5 and 1 Gyr (because the near-IR contribution of the TP-AGB stars are largest at these times, in the ML2002 models). An example is provided in Fig. 2.
The figure shows that the only broad band flux measurement sensitive to the use of C-rich spectra is the J band, due to CN and C2 opacities (see Loidl et al. 2001 for band identifications in carbon star spectra, and Lançon & Wood 2000 for the O-rich features). The effect on the integrated H and K fluxes is negligible. Using low resolution spectroscopy implicitely accounts for the JHK energy distribution, as long as this whole spectral range is covered continuously. The main discriminating spectral features can be measured at low spectral resolution ( of a few 100) or with high signal-to-noise narrow band photometry (Lançon et al. 1999). When carbon star spectra are included in the models, the VO band at 1.05 m vanishes in favour of the CN bandhead at 1.09 m; the H2O bandhead at 1.33 m is replaced with a CN bandhead at 1.35 m; the absence of the wings of the H2O bands on both sides of the H window give the H spectrum a flat appearance, with an abrupt cut-off at 1.77 m due to C2; and for the same reason the K band spectrum is also straight.
In the rest of this paper, our aim is to answer the following questions:
Can models for the near-IR spectrophotometric evolution of star clusters reproduce the spectrum of W3, with an age, metallicity, extinction and mass consistent with constraints from optical spectra ?
What constraints are obtained on the chemical nature of the AGB stars present in W3 ?
Conversely, what constraints does the AGB population of W3 set on the models for the formation of carbon stars ?
What temperature scales for AGB star spectra are consistent with the data ?
How much of this information could have been determined from the near-IR SOFI spectrum only, i.e. in the absence of an priori knowledge of the age from an optical spectrum ?.
4 The Near-IR Spectrum of Cluster W3: the Detection of Carbon Stars
It is well known from counts in the Magellanic Cloud clusters that carbon stars represent a large fraction of the AGB stars of intermediate age clusters, at least at sub-solar metallicity (e.g. Aaronson & Mould 1980, Persson et al. 1983, Frogel et al. 1990, Westerlund et al. 1993, Ferraro et al. 1995). Population synthesis models predict the predominance of carbon stars over M type stars in the near-IR, under favourable age and metallicity circumstances. In agreement with star counts, they predict that carbon stars may provide up to 50 % of the near-IR light (LM2001). Nevertheless, carbon stars have never been searched for in galaxies with unresolved stellar content. By including spectra of carbon stars in evolutionary spectral synthesis models, Lançon et al. (1999) opened a new window on distant carbon star populations. In this Section, we use NGC 7252–W3 to validate that approach.
Are carbon rich stars present in cluster W3, as expected from the intermediate age cluster models? In Fig. 3, the SOFI spectrum of W3 is compared with models for a 300 Myr old stellar population at solar metallicity. In the right frame, carbon star spectra are used when the surface abundance of carbon exceeds that of oxygen; in the left frame, oxygen rich spectra are used exclusively. The choices of age, metallicity and extinction are justified in Section 5 and 6.
At 300 Myr, the contribution of the TP-AGB stars to the near-IR light is smaller than at the 500 Myr of Fig. 2. Thus the effect of carbon stars is also less pronounced. In addition, some key molecular bandhead could not be recovered because of the strong and variable telluric absorption at La Silla. Nevertheless, in all the remaining spectral regions of interest (identified in Fig. 2) the agreement is systematically better when carbon star spectra are included. The strongest evidence for carbon stars comes from the absence of the VO band at 1.05 m, the presence of the CN bandhead at 1.08 m, and the small curvature of the energy distribution inside the H window. For each of these, the deviation between the smoothed data and the exclusively O-rich models are at the 3 level. Taken together, the signatures provide strong evidence for the presence of carbon stars. The shape of the K window energy distribution also favours this conclusion, but here the difference between models is not statistically significant in view of the observational noise.


The detection of carbon stars in W3 demonstrates that TP-AGB studies can be extended to distant, unresolved stellar populations. Clearly, better signal-to-noise ratios should be seeked. Broadband colours are not sufficient for studies of the nature of the TP-AGB stars, in particular when the amount of reddening is uncertain. The shape of the low resolution near-IR spectrum between 1 and 2.5 m carries most of the relevant information. It is essential to recover this global shape. Spectrographs with a broad wavelength coverage and a wide overlap between individual spectral segments are the most appropriate instruments. Multiple-filter narrow-band photometry, for instance with the future refurbished camera NICMOS on board HST, is an alternative approach if the absolute flux levels can be calibrated with a high accuracy (Lançon et al. 1999).
The effects of carbon stars on the spectrum of W3 also make it clear that near-IR evolutionary synthesis models must incorporate the spectral contribution of these objects if they are to be used in the analysis of future high signal-to-noise near-IR data.
5 Age and extinction from the near-IR spectrum and the UBVIKs colours
Figure 3 not only highlights the role of carbon stars in W3. It shows that the new spectral synthesis models of Mouhcine & Lançon (2002a) are indeed able to reproduce the integrated spectrum of the cluster, for an intermediate age and at a metallicity consistent with the estimates based on optical spectra (Schweizer & Seitzer 1998, Maraston et al. 2001).
In this and the following sSctions, we will examine what information on age, extinction and metallicity can be recovered in the absence of optical spectroscopy, using only the near-IR spectrum, only the UBVIKs photometry, or these two sets of data combined.
Here, we first focus on age and extinction. As the reddening of NGC 7252 and, more specifically, W3 is poorly known, we consider visual extinction as a parameter that needs to be better constrained with the new data.
The analysis of the optical spectra of the brightest star clusters of NGC 7252 by Schweizer & Seitzer (1998) and Maraston et al. (2001) has yielded metallicity estimates. Schweizer & Seitzer (1998) favoured solar metallicity. Maraston et al. prefer the metallicity of the LMC for W3, but solar abundances for other luminous clusters with similar ages. Although it is not strictly impossible that coeval clusters formed from material with different abundances in a merger, we estimate that the apparent spread in metallicity is more likely to represent uncertainties. Therefore, this paper will consider both solar and LMC metallicities. Here, we mainly work at Z⊙, and we come back to this choice in Section 6.
5.1 The broadband UBVIKs colours
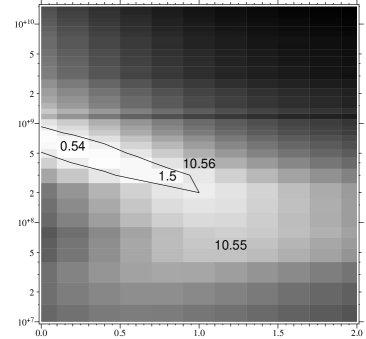
To assess the relative quality of various model adjustments to the data, we have computed goodness-of-fit maps. Each map displays the variations of the reduced, weighted quadratic difference between model and data (noted hereafter), for model ages ranging from to yr and for model extinctions ranging from A to A. Figure 4 shows the typical aspect of such maps, based on the broad band colours (U-B), (B-V), (V-I) and (I-Ks) (Miller et al. 1997, Maraston et al. 2001).
The figure displays a rather regular pattern. A strong degeneracy between age and extinction is apparent: as time passes, the models become intrinsically redder, thus requiring less extinction. The shape of blue young cluster SEDs cannot be made to match the observed UBVIKs distribution with any amount of obscuration. At solar metallicity, old model clusters are intrinsically too red and must also be excluded. In agreement with previous studies, only intermediate ages are found to be acceptable.
A quantitative interpretation of the maps requires a closer look at the way values are computed, and at the sources of uncertainties. We have:
where is an observed colour, is the corresponding model colour and is the estimated r.m.s. error on colour . combines uncertainties in the data and in the models. For the observational uncertainties, we adopted mag for (U-B) and 0.04 mag for the three other colours, as suggested by Miller et al. (1997) and Maraston et al. (2001).
Miller et al. (1997) have used the transformations of
Holtzman et al. (1995) to transform HST/WFPC2 colours
into the “standard” ground-based UBVRI system
(of Landolt 1983). The UBVI filter passbands of Bessell (1990)
that we use here are closely matched to that standard system, suggesting
passband mismatch errors smaller than 0.02 mag. When measuring
colours on a model spectrum, we adopt zero colours for a model
of Vega. We have verified that the systematic errors due to this
convention (Holtzman et al. 1995) and to the slight differences
around the Balmer lines between our Vega model and the one used in
standard HST data reductions (IRAF stsdas.hst_calib.synphot package)
are mag.
The Ks measurements of Maraston et al.
(2001) are tied to the photometric system of Persson et al. (1998),
who defined the Ks zero point by imposing for the
type A0 standards of Elias et al. (1982).
Systematic errors on (I-Ks) are likely to be at least
of the same order as those on optical colours (but are
more difficult to estimate quantitatively, as empirical
photometric systems focus on either the near-IR
or the optical, not the two combined).
Using 9 tabulations of extinction laws for the Milky Way or
the Magellanic Clouds from the literature, we estimate r.m.s. dispersions
of 0.005 to 0.025 magnitudes at AV=1, depending on the colour
considered (or more if we include extragalactic extinction laws such as
given by Calzetti et al 1994, although it is not known if they apply
to individual lines of sight in a galaxy).
Errors due to stellar evolution prescriptions and
spectral libraries are difficult to assess precisely.
Based on comparisons between the colours predicted
by various research groups (e.g. Charlot 1996, Yi et al. 2001,
Lejeune & Buser 1999, Salasnich et al. 2000), one must
account for mag r.m.s. errors due to the uncertainties
in population synthesis model inputs. The effects of choices in
the modelling of the TP-AGB are not counted as errors since
they represent the parameters our study must test
(the TP-AGB parameters do not affect (U-B) and (B-V)
significantly).
In view of all the factors of this paragraph,
we have accounted for the uncertainties
in the models globally with a factor of 1/2 on (grossly
corresponding to what is expected if the uncertainties on each
model colour equals the uncertainty on the observed colour) and
an extinction dependent correction (corresponding to 0.02 mag at
AV=1).

The interpretation of the resulting values in terms of agreement probabilities between the data and a model, using Pearson’s reduced probability distribution, would imply the crude assumptions that the errors have a normal distribution and are independent of one another. In particular, the uncertainties in the model colours are clearly not independent (any stellar component contributes to more than one colour, and extinction affects all colours coherently). Here, we consider that a model provides a good fit to the data if on the scale of our maps. If our estimator indeed followed Pearson’s probability distribution with 4 degrees of freedom, the uncertainties would have a 15 % probability of producing larger values. Thus our limit is rather conservative. Exemples of comparisons between observations and models are given in Fig. 5.
5.2 The near-IR spectrum alone
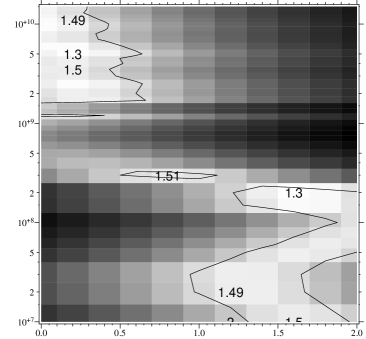
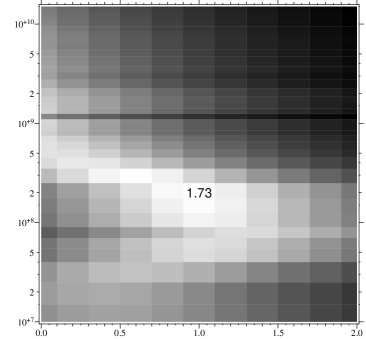
Figure 6 shows the goodness-of-fit map considering only the near-IR spectrum as constraints.
We have used the r.m.s. deviation around a smoothed continuum as an estimate of the uncertainties in the data. The squared difference between the model and the data is weighted with and the sum of these differences is minimized by applying the adequate scaling to the model. is obtained by dividing the resulting sum by the number of degrees of freedom, , where is the number of pixels used along the spectrum. We note that we do not correct for the size of the spectral PSF, which introduces correlations between errors on 2-3 adjacent pixels. Observational uncertainties on the slope of the spectrum affect estimates of AV. A 5 % uncertainty on the ratio of the fluxes at 1 m and at 2 m translates into an uncertainty of 0.15 magnitudes in AV.
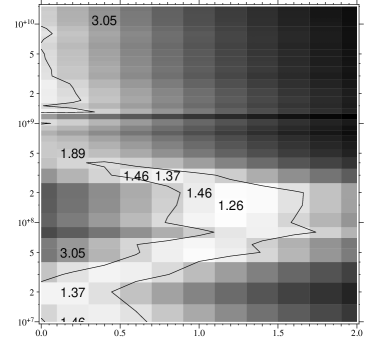
Again, the numerical values of cannot be directly transformed into acceptance probabilities. The various sources of uncertainties that we have cited and the eye inspection of a variety of model adjustments leads us to set the limit of acceptable values at 1.5. The contour in Fig. 6 identifies the corresponding region of acceptance. The model adjustment shown in Fig. 3 (b) corresponds to [t=300; AV=0.7]. It provides a good fit to the data with a of 1.39 on Fig. 6.
A curved line of relatively low values runs through the map, reflecting the degeneracy between extinction and stellar evolution in producing a red enough broad band energy distributions between 1 and 2.5 m. Three main segments can be identified along this curve. (i) At ages between and yr, red supergiants are the main sources of near-IR light. At about 20 Myr, they provide intrinsic near-IR colours that are similar to those of W3 even without much extinction. Later on, stars on extended blue loops of the evolutionary tracks make the integrated colours bluer, shifting the -valley towards higher extinctions. (ii) In the intermediate age regime, the intrinsic near-IR colours become redder with time, as the relative contribution of cool AGB stars increases. The need for extinction is progressively reduced. The poor fit between 500 Myr and Gyr is due to the strength of molecular features in the model spectra at these ages. In the observed spectrum, these features are present, but with a relatively small contrast. (iii) At old ages ( yr), the near-IR model spectra are intrinsically as red as or redder than the data and any extinction would worsen the agreement.
The minimum values are obtained at relatively young intermediate ages (150-200 Myr) with relatively high values of the extinction (A, i.e. values consistent with those obtained for the H II region S101 of NGC 7252 by Schweizer & Seitzer 1998). The exact location of the minimum depends on the wavelength dependence of the weighting adopted in the computation and on the extinction law. For instance, varying the ratio R=AV/E(-) from 2.7 to 5 (as observed along various lines of sight in the Milky Way; Cardelli et al. 1989) shifts the minimum from [t=200; AV=1.4] to [t=150; AV=1.0], without modifying the actual value of the minimum significantly.
5.3 The broadband colours and the near-IR spectrum combined
The comparison of Figs. 6 and 4 shows that, in the case of cluster W3, the degeneracy between age and extinction can be broken with the simultaneous use of the UBVIKs colours and the 1–2.3 m spectrum. Synthetic near-IR spectra at ages of 500–700 Myr, with low extinction optical depths, provide satisfactory UBVIKs colours but the molecular bands they display are too pronounced to be acceptable. As a matter of fact, the observed molecular bands are rather shallow. Models younger than 250 Myr are rejected because of their UBVIKs colours. The overlap of the contoured regions of the two figures identifies the models that comply with all the constraints. Our prefered solar metallicity model corresonds to [t=300 Myr; A]. Taking into account the various sources of errors mentioned above (extinction laws, weighting of the spectral elements, photometric filter passbands and zero points), acceptable models lie between [t=200 Myr; A] and [t=400 Myr; A].
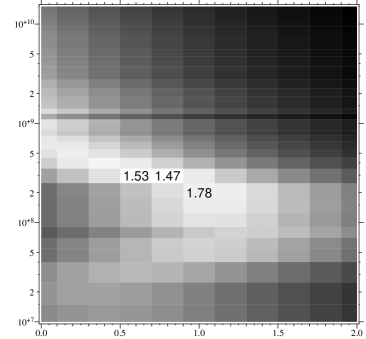
Fig. 7 shows a goodness-of-fit map constructed as a linear combination of the ones previously discussed. The weights are chosen such as to give the set of 4 broad-band colours and the large set of near-IR flux densities equal importance in the combined . Maps of this type will allow us to compare model adjustments when varying internal parameters such as the metallicity or the temperature of the input LPV spectra.
6 Constraints on metallicity and on the temperature scales of LPV spectra
Previous studies of the clusters of NGC 7252 suggested metallicities between Z⊙ and ZLMC (see Section 2.1). Our models favour a solar metallicity for cluster W3, although LMC metallicity cannot be safely rejected.
The combined goodness-of-fit map, an LMC-metallicity equivalent of Fig. 7, has a very similar appearance, but the minimum value is 1.79 instead of 1.47 at Z⊙ (cf Fig. 8, top). The location of the minimum is unchanged: [t=300 Myr; AV=0.8].
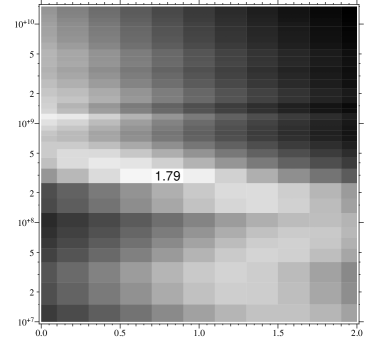
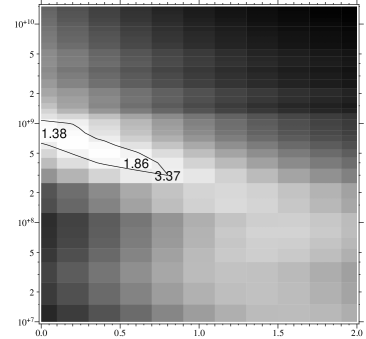
The comparison of the middle plot of Fig. 8 with Fig. 4 suggests that at a given age, the intrinsic colours of a stellar population are globally bluer when the stellar metallicities (and therfore opacities) are reduced and a higher value of AV compensates for this effect.
At [t=300 Myr; AV=0.8], both the near-IR and the UBVIKs values are slightly higher than those obtained at solar metallicity. In the near-IR, the difference is not significant. The difference in the UBVIKs map is more important and according to our discussion in Sec. 5.1 is not an acceptable fit. However, a reasonable change in the adopted extinction law produces acceptable UBVIKs colours. For instance, is reduced from 3.37 to 1.6 when we use the extinction law of Cardelli et al. (1989) with R=Av/E(B-V)=5. All creteria for a good fit are met at [t=300 Myr; AV=0.8.
At solar metallicity, a significant fraction of the TP-AGB stars are oxygen rich. Assuming a solar metallicity, we may thus attempt to constrain the temperature scale of the M type LPV spectra: the predictions of near-IR spectrophotometric properties of intermediate-age stellar populations (mainly narrow-band molecular indices) show a rather strong dependence upon this calibration (Lançon et al. 1999, Mouhcine & Lançon 2002). If one affects high effective temperatures to stellar spectra with deep molecular features in the input stellar library of the models, one produces integrated spectra that also have pronounced molecular features. As discussed by Lançon & Mouhcine (2002), conclusions on such a calibration will be model dependent, in the sense that they are strongly linked to the way the effective temperatures of the evolutionary tracks have been computed.
Two different effective temperature scales for LPV spectra may be considered. The first one is that LPV stars may have the same effective temperature scale as static giant stars; the second one is that the effective temperature scale of LPVs may differ from that of the static giants. In principle one may expect that, for the same effective temperature, a variable giant have redder colours than its parent static giant star, because pulsation makes the atmosphere of the star more extended, and consequently redder (Bessell et al. 1989b).
We have constructed two grids of models assuming two different effective temperature scales for the LPV stars. The first one is taken from Bessell et al. (1989a) who consider only static M stars (though already with extended atmospheres). The authors suggest that the proposed scale is appropriate for AGB stars. The second effective temperature scale is one proposed by Feast (1996), based on angular diameter measurements for late-type stars combining Miras and non-Mira M-type stars. The second temperature scale is much steeper than the first one at the low temperatures relevent for TP-AGB stars; smaller decreases in temperature are needed to explain the same spectral evolution to redder colour and deeper molecular bands. For the evolution of integrated properties of stellar populations, this means that models calculated with the temperature scale of Bessell et al. (1989a) will produce integrated stellar population spectra with more pronounced near-IR molecular features than those calculated assuming the scale of Feast (1996).
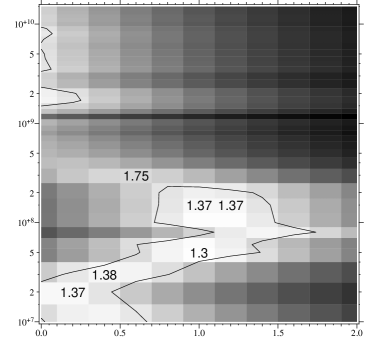
The goodness-of-fit map for models that assume the static giant star scale from Bessell et al. (1989a), combining the constraints from the broad-band photometry and the near-IR spectrum, is shown in Fig. 9. All previous figures assumed the effective temperature scale of Feast (1996). The adopted temperature scale has almost no effect on the evolution of broad-band photometry; the goodness-of-fit map obtained comparing broad-band colours to models constructed assuming Bessell et al. (1989a) scale is similar to Fig. 4, obtained using the scale of Feast. The map shows that adopting the temperature scale of Bessell et al. for the O-rich spectra degrades the fits. This temprature scale assigns a higher effective temperature to a given spectrum than the scale of Feast. Thus, the use of spectra with strong molecular bands is extended to higher temperature regions in the HR diagram, and molecular features are also stronger in the integrated spectrum of the population. As a result, the VO band (1.05 m) is present at ages as young as 300 Myr and the wings of the H2O bands curve the H and K-band energy distributions (in a way similar to what is shown in Fig. 3.
7 The influence of the TP-AGB evolutionary tracks
As discussed in Sec. 3, the treatment of the TP-AGB evolutionary phase in population synthesis models is a major challenge. The predicted evolution of intermediate-age stellar populations (mainly for ages in the range of 0.1 to Gyr) from different sets of models show large differences. In this Section we will compare our results with those obtained with other models that use a different modelling of the TP-AGB evolutionary phase.
We have compared the observed spectra of W3 to the model sets of Lançon et al. (1999). These models were calculated using the prescriptions of Groenewegen & de Jong (1993) for the TP-AGB phase. Note that the effect of the envelope burning on the luminosity of TP-AGB stars was negelected in these models. The predicted evolution of broad-band colours by Lançon et al. (1999) models is similar to the prediction made by the recent version of Bruzual & Charlot models as cited in Maraston et al. (2001), at least regarding (V-K) and (B-V). For the stellar populations in the age range of Gyr, the age interval into which falls W3, the models of Lançon et al. (1999) predict that the reddest optical/near-IR or near-IR/near-IR colours are reached at ages of Myr. The colours become bluer afterwards, up to 1 Gyr. This discrepancy relative to our present models, where the reddest colours are obtained for stellar populations at ages Gyr, is due to the fact that the TP-AGB lifetime of massive TP-AGB stars, and hence their contribution to integrated light, is overestimated when the overluminosity due to envelope burning is neglected. Note that the new models reproduce the evolution of the contribution of the AGB stars to the bolometric luminosity as a function of age, as observed in LMC clusters (Frogel et al. 1990).
We find that Z=0.008 models from Lançon et al. (1999) only
provide marginal matches to broad-band photometry with any extinction
or age (). At solar metallicity, the UBVIKs
can be matched well, but not without extinction.
The “best fit” found with this model set is at [t=300–400; AV=0.6]
again. Indeed, the ML2002 models and those of Lançon et al. (1999)
produce very similar spectra at an age of 300 Myr.
Maraston et al. (2001) find young photometric ages even with the
assumption of negligible extinction. Comparisons of their models and
ours show clear discrepancies. Their models predict redder
colours than ours at the same age. At ages between 0.2 Gyr and
1 Gyr, (B-V) predicted by Maraston et al. (2001) is redder than ours
by 0.15 magnitudes or more, their (V-K) is bluer than ours by 0.1 mag.
at 0.2 Gyr, and redder by 0.1 mag. at 1 Gyr. At the approximate age
of W3, a change of 0.15 mag in (B-V) corresponds to a change of
in age.
The relative young photometric ages derived by Maraston et al. (2001)
can be explained partly by the differences in the (B-V) evolution.
The inclusion of the TP-AGB stars in both models is quite different,
and may be another source of the differences between their and our
results for the cluster photometric age.
At fixed age, their models predict a higher contribution of the AGB
stars to the K-band light than ours. Indeed, at the approximate age of
W3, our models predict that AGB stars contribute to the
integrated K-band light, while the models used by Maraston et al. (2001)
predict that these stars contribute of .
As noted in the previous Sections, our best fit has an age of
300 Myr and AV=0.7-0.8. If we had used only UBVIKs photometry
as constraints, we would have favoured older ages (600-800 Myr)
and lower extinction values (AV=0–0.3).
This would have been consistent with the early photometric
age estimates of Miller et al. (1997), who assumed low dust
optical depths. Optical spectroscopy leads to younger ages
(300-600 Myr: Schweizer & Seitzer 1998; 250-300 Myr,
Maraston et al. 2001). Our ages agree with previous spectroscopic
ages, which are independent of extinction.
8 Summary and conclusions
Several of the star clusters in NGC 7252 are sufficiently massive to overcome the problem of the large stochastic fluctuations due to the small number of bright AGB stars in intermediate-age star clusters in nearby galaxies. This gives the unique opportunity to test the accuracy of theoretical modelling of intermediate-age populations in the near-IR. With this aim, we have obtained near-IR spectroscopic and photometric observations of star clusters in the merger remnant NGC 7252.
We used new models for simple stellar populations, in which the contribution of AGB stars to the integrated light is treated in a consistent way. We were able to match the relevant observational constraints on the intermediate-age AGB stellar population.
UBVIKs photometry imposes the global range of ages but with a degeneracy between age and extinction. The absence of independent extinction value determinations for the target has a significant effect on model rejection criteria (at A). Higher metallicities move solutions to older ages and/or higher extinction values.
At intermediate ages, the strength of the molecular bands is a discriminant. Fitting the near-IR spectrum of the W3 cluster shows that carbon stars are needed to obtain an acceptable fit of the data. Considering only oxygen rich stars as representative of the whole AGB stellar populations leads to synthetic spectra with spectral features that are not compatible with the observations. This is the first clear indication of the presence of carbon stars outside Local Group galaxies. Our models show that the available UBVIKs photometry is not sufficient to detect carbon stars in the star cluster system of NGC 7252. Using the strength of the molecular bands as discriminator, we derived constraints on the W3 age: strong TP-AGB features appear after 300 Myr, weaker ones before. W3 is intermediate. We mention that the low S/N of our data is a severe limitation of the diagnostic power of the near-IR spectral features. Spectro-photometric data are consistent with a metallicity Z⊙ for W3, with higher likelihood for solar metallicity.
Contrary to previous studies of star cluster system of NGC 7252 that assumed negligible extinction, we found that good fits of the data require high extinction independently of metallicity (i.e., A). Using the near-IR constraints has allowed us to break the age-extinction degeneracy, to show that the assumption of low extinctions was incorrect, and to find ages consistent with optical spectroscopic (extinction- independent) ages.
The comparison of the observed near-IR spectrum of cluster W3 to grids of models calculated using our evolutionary tracks with various TP-AGB effective temperature scales, shows that the data are better reproduced when an effective temperature scale calibrated on LPV stars is used (i.e. steeper than the effective temperature scale of static giant stars).
Acknowledgements.
Thanks to Dr P. Francis to provide us the dome flats and the bad pixels mask used for the data reduction.References
- (1) Aaronson, M., & Mould, J., 1980, ApJ, 240, 804
- (2) Bessell, M.S., Brett, J.M., Scholz, M., & Wood, P.R., 1989a, A&AS, 77, 1
- (3) Bessell, M.S., Brett, J.M., Scholz, M., & Wood, P.R., 1989b, A&A, 213, 209
- (4) Bessell, M.S., 1990, PASP, 102, 1181
- (5) Blanco, B.M., Blanco, V.M., & McCarthy, M.F., 1978, Nature, 271, 638
- (6) Blöcker, T., & Schönberner, D. 1993, in IAU Symp. 155, Planetary Nebulae, ed. R. Weinberger & A. Acker (Dordrecht: Kluwer Acad. Publ.), 479
- (7) Bressan, A., Fagotto, F., Bertelli, G., & Chiosi, C., 1993, A&AS, 100, 647
- (8) Bruzual, G. & Charlot, S., 1993, ApJ, 405, 538
- (9) Calzetti, D., Kinney, A.L., & Storchi-Bergmann, T., 1994, ApJ, 429, 582
- (10) Cardelli, J.A., Clayton, G.C., & Mathis, J.S., 1989, ApJ, 345, 245
- (11) Carlson, M.N., Holtzman, J.A., Watson, A.M., et al., 1998, AJ, 115, 1778
- (12) Charlot, S. 1996, in From Stars to Galaxies: the Impact of Stellar Physics on Galaxy Evolution, ed. C. Leitherer, U. Fritze-von Alvensleben, J.P Huchra, ASP Conf. Ser., 98, 275
- (13) Charlot, S. & Bruzual, G., 1991, ApJ, 367, 126
- (14) Charlot, S., Worthey, G., & Bressan, A. 1996, ApJ, 457, 625
- (15) Cook, K.H., Aaronson, M., & Norris, J., 1986, ApJ, 305, 634
- (16) Elias, J. H., Frogel, J. A., Matthews, K., & Neugebauer, G. 1982, AJ, 87, 1029
- (17) Feast, M.W., 1996, MNRAS, 278, 11
- (18) Ferraro, F., Fusi Pecci, F., Testa, V., et al., 1995, MNRAS, 272, 391
- (19) Fagotto, F., Bressan, A., Bertelli, G., & Chiosi, C. 1994, A&AS, 105, 29
- (20) Fioc, M., & Rocca-Volmerange, B., 1997, A&A, 326, 950
- (21) Fritze-von Alvensleben, U., & Gerhard, O., 1994, A&A, 285, 775
- (22) Fritze-von Alvensleben, U. 1999, in Spectrophotometric Dating of Stars and Galaxies, ed. Hubeny I., Heap S.R., Cornett R.H., ASP Conf. Ser., 192, 273
- (23) Frogel, J.A., Persson, S.E., Aaronson, M., & Matthews, K., 1978, ApJ, 220, 75
- (24) Frogel, J.A., 1985, ApJ, 298, 528
- (25) Frogel, J.A., Mould, J.R., & Blanco, V.M., 1990, ApJ, 352, 96
- (26) Girardi, L. 1996, Mem. Soc. Astr. It., 67, 839
- (27) Girardi, L. & Bertelli, G., MNRAS, 1998, 300, 533
- (28) Groenewegen, M.A.T. & de Jong, T., 1993, A&A, 267, 410
- (29) Groenewegen, M.A.T. & de Jong, T., 1994, A&A, 283, 463
- (30) Goldader, J.D., Joseph, R.D., Doyon, R., & Sanders, D.B., 1997, ApJ, 474, 104
- (31) Grebel, E.K. 2000, in Massive Stellar Clusters, ed. A. Lançon & C. Boily, ASP Conf. Ser., 211, 262
- (32) Habing, H.J. 1996, A&AR, 7, 97
- (33) Holtzman, J.A., Burrows, C.J., & Casertano, S. 1995, PASP, 107, 1065
- (34) Holtzman, J.A., Watson, A.M., & Mould, J.R., et al. 1996, AJ, 112, 416
- (35) Iben, I. & Renzini A., 1983, ARA&A, 21, 27
- (36) Lançon, A. 1999, in IAU Symp. 191 on Asymptotic Giant Branch Stars, ed. T. Le Bertre, A. Lèbre, C. Waelkens (San Francisco: ASP), 579
- (37) Lançon A., & Mouhcine M., 2000, in Massive Stellar Clusters, ed. Lançon A., Boily C.M., ASP Conf. Ser. 211, 34
- (38) Lançon, A. & Mouhcine, M., 2002, A&A, in press
- (39) Lançon, A. & Mouhcine, M. 2001, in Starbursts Near and Far, ed. L. Tacconi & D. Lutz (Berlin:Springer), in press
- (40) Lançon, A. & Rocca-Volmerange, B., 1996, New Astron., 1, 215
- (41) Lançon, A., Rocca-Volmerange, B., & Thuan, T.X. 1996, A&AS, 115, 253
- (42) Lançon, A. & Mouhcine, M., 2000, in Massive Stellar Clusters, ed. Lançon A. & Boily C.M., ASP Conf. Ser., 211, 34
- (43) Lançon, A. & Wood, P.R., 2000, A&AS, 146, 217
- (44) Lançon, A., Mouhcine, M., Fioc, M., & Silva, D., A&A, 1999, 344, L21
- (45) Landolt, A.U., 1983, AJ 88, 439
- (46) Lejeune, T., Cuisinier, F., & Buser, R., 1998, A&A, 130, 65
- (47) Lejeune, T., & Buser, R., 1999, in Spectrophotometric Dating of Stars and Galaxies, ed. I. Hubeny, S. R. Heap, R. H. Cornett, ASP Conf. Ser., 192, 211
- (48) Loidl, R., Lançon, A., & Jørgensen, U., 2001, A&A, 371, 1065
- (49) Lutz, D., 1991, A&A, 245, 31
- (50) Maraston, C., Kissler-Patig, M., Brodie, J.P., Barmby, P., & Huchra, J.P., 2001, A&A, 370, 176
- (51) Miller, B.W., Whitmore, B.C., Schweizer, F., & Fall, M., 1997, AJ, 114, 2381
- (52) Möller, C.S., Fritze-v. Alvensleben, U., & Fricke, K.J. 1997, A&A, 317, 676
- (53) Mouhcine, M., & Lançon, A., 1999 b, In Spectrophotometric Dating of Stars and Galaxies, ed. I. Hubeny, S. R. Heap, R. H. Cornett, ASP Conf. Ser. 192, 113
- (54) Mouhcine, M., & Lançon, A., 1999 a., In Spectrophotometric Dating of Stars and Galaxies, ed. I. Hubeny, S. R. Heap, R. H. Cornett, ASP Conf. Ser. 192, 303
- (55) Mouhcine, M., & Lançon, A., 2000., In Massive Stellar Clusters, ed. Lançon A., Boily C., ASP Conf. Ser. 211, 144
- (56) Mouhcine, M., & Lançon, A., 2002 a, A&A, accepted (ML2002)
- (57) Mouhcine, M., & Lançon, A., 2001 b, MNRAS, submitted
- (58) Oliva, E., Origlia, L., Kotilainen, J.K., & Moorwood, A.F.M, 1995, A&A, 301, 55
- (59) Olofsson, H., 1999, in IAU Symp. 191 in Asymptotic Giant Branch Stars, ed. T. Le Bertre, A. Lèbre, C. Waelkens (San Francisco: ASP), 579
- (60) Origlia, L., Goldader, J.D., Leitherer, C., Schaerer, D., & Oliva, E. 1999, ApJ, 514, 960
- (61) Persson, S.E., Aaronson, M., Cohen, J.G., Frogel, J.A., & Matthews, K., 1983, ApJ, 266, 105
- (62) Persson, S.E., Murphy, D.C., Krzeminski, W., Roth, M., & Rieke, M.J., 1998, AJ, 116, 2475
- (63) Pritchet, C.J., Schade, D., Richer, H.B., Crabtree, D., & Yee, H.K.C., 1987, ApJ, 323, 79
- (64) Rieke, G.H., & Lebofsky, M.J., 1979, ARA&A, 17, 477
- (65) Salasnich, B., Girardi, L., Weiss, A., & Chiosi, C. 2000, A&A, 361, 1023
- (66) Salpeter, E. E. 1955, ApJ, 121, 161
- (67) Santos, J.F.C., & Frogel, J.A., 1997, ApJ, 479, 764
- (68) Silva, D.R. 1996, in Spiral Galaxies in the Near-IR, eds. Minniti D., Rix H.-W. (Berlin: Springer), p.3
- (69) Schweizer, F., 1982, ApJ, 252, 455
- (70) Schweizer, F., & Seitzer, P., 1998, AJ, 116, 2206
- (71) Wagenhuber, J., & Groenewegen, M.A.T., 1998, A&A, 340, 183
- (72) Westerlund, B.E., Azzopardi, M., Rebeirot, E., & Breysacher, J., 1991, A&AS, 91, 425
- (73) Whitmore, B.C., Schweizer, F., Leitherer, C., Borne, K., & Robert, C., 1993, AJ, 106, 1354
- (74) Whitmore, B.C., & Schweizer, F., 1995, AJ, 109, 960
- (75) Whitmore, B.C., Zhang, Q., Leitherer, C., et al., 1999, AJ, 118, 1551
- (76) Yi, S., Demarque, P., Kim, Y.-C. et al. 2001, astro-ph/0104292