Submillimeter Dust Continuum Studies of Low and High Mass Star Formation
Abstract
Studying the physical environments of low mass and high mass cores using dust continuum emission provides important observational constraints on theoretical models of star formation. The motivation and procedure for modeling dust continuum emission is reviewed and the results of recent surveys towards low mass and high mass star forming regions are compared.
Department of Astronomy, The University of Texas at Austin, Austin, Texas 78712–1083
1. Introduction
Optically thin dust emission at submm and mm wavelengths is a powerful probe of the density and temperature structure of the outer envelope of protostars. Models of the dust continuum emission constrain theoretical predictions of the structure of forming protostellar cores. The resolution of current submm and mm bolometer arrays effectively image the outer envelope on scales of to AU. The basic procedures for understanding the density and temperature structure are reviewed as well as the need for radiative transfer modeling (§2). The density and temperature structure of the envelopes of low mass and high mass star forming regions are compared (§3) and important systematic effects are discussed (§4).
2. Dust Continuum Emission
The specific intensity, at impact parameter , of optically thin dust continuum emission from a spherical envelope is given by
| (1) |
where is a distance along the line-of-sight, is the mean molecular mass of gas in grams, is the outer radius, is the dust opacity in cm2/gram of gas, is the gas particle density in cm-3, and is the dust temperature distribution (see Shirley et al. 2000). Generally, this integral must be solved numerically. However, several simplifying assumptions provide an analytical solution: (1) The dust emits in the Rayleigh-Jeans limit (); (2) The temperature and density follow single power law distributions ( and ); (3) The dust opacity is constant along the line of sight (); (4) . With these assumptions, the specific intensity can be expressed as a power law in the impact parameter () with the exponent . The density power law index, , is found by fitting a power law to the observed intensity distribution and assuming a temperature power law index, , to find .
The analytical solution is not applicable at submm wavelengths (including 1.3mm) for several reasons. The dust temperature fails the Rayleigh-Jeans criterion in the outer envelopes of low mass and high mass protostars since the dust temperature drops below 20 K at large radii (i.e., only at 1.3mm). The temperature distribution departs from a single power law in the inner regions of the envelope where the radiative transfer becomes optically thick at UV to mid-IR wavelengths. In low mass protostars, heating from the interstellar radiation field (ISRF) becomes important in the outer envelope causing the dust temperature rise towards the outside edge of the core. The observed specific intensity profile has been convolved with a complicated beam pattern, containing multiple sidelobes, and is further modified by chopping and the detailed observing procedure (e.g., scanning). Therefore, to understand the density structure, we must model the radiative transfer to self-consistently calculate the temperature distribution, and then simulate the observing mode (beam convolution, chopping, etc.) to compare with observations.
3. Radiative Transfer Models
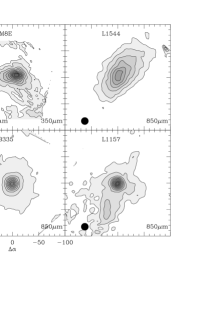
Two surveys of the deeply embedded phases of low and high mass star formation were recently carried out at the University of Texas: a SCUBA 850 and 450 m survey of 39 nearby low mass star forming regions (Shirley et al. 2000, Shirley et al. 2002, Young et al. 2002) and a SHARC 350 micron survey of 51 high mass star forming regions associated with water masers (Mueller et al. 2002). Submm images are shown in Figure 1.
The normalized, azimuthally averaged, intensity profiles and spectral energy distributions (SED) of 19 sources from the SCUBA survey (3 Pre-ProtoStellar cores, 7 Class 0, and 9 Class I) and 31 sources from the SHARC survey were modeled using a one dimensional radiative transfer code (Egan, Leung, & Spagna 1988) that takes into account heating from an internal source, heating from the ISRF, beam convolution, and chopping. The detailed testing of the model parameter space is discussed in Evans et al. (2001), Shirley et al. (2002), Young et al. (2002), and Mueller et al. (2002). The modeled normalized intensity profile is very sensitive to the density structure of the core while the modeled SED is sensitive to the mass and opacity (). Ossenkopf & Henning (1994) opcaities for coagulated dust grains with thin ice mantles fit the observed SEDs of both samples well.
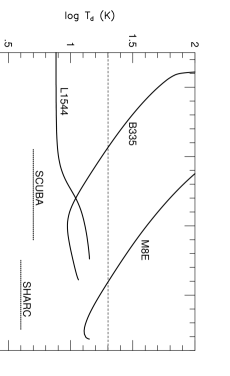
The temperature profile from the best fit radiative transfer models of two low mass cores (the PPC L1544 and Class 0 core B335), and a high mass core (M8E) are shown in Figure 2. Single power law temperature distributions do not fit the calculated profiles in the regions probed by SCUBA and SHARC. The temperature profile in a PPC (no internal luminosity source) drops towards the center as UV to near-IR radiation from the ISRF is attenuated. The temperature profile increases dramatically towards the center for sources with internal luminosity (B335, M8E). Heating from the ISRF strongly affects the shape of the temperature profile for low mass sources in the region of envelope probed by SCUBA (e.g., B335) and has some effect in regions probed by SHARC.
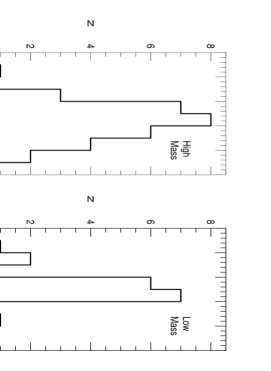
Sources with internal luminosity are well fitted by a single power law density profile. The histograms of best fit power-law index, , for the low mass and high mass sample are very similar (Figure 3). The average is for the high mass cores and for the low mass cores. The low mass cores may be sub-divided into Class 0 and Class I objects based on the Tbol criterion (Class 0 typically have T K, Chen et al. 1995). The average for 10 Class 0 cores is and is for 9 Class I cores. No evidence for evolution in the shape of the density profile is seen between Class 0 and Class I cores (Young et al. 2002).
These results can be compared to other submm and mm surveys towards high mass regions (van der Tak et al. 2000 towards H2O masers and Hatchell et al. 2000 and Beuther et al. 2002 towards UCHII regions) and low mass regions (Chandler & Richer 2000, Hogerheijde et al. 2000, Motte & André 2001, and Jørgensen et al. 2002). Beuther et al. (2002) observed 69 high mass cores at 1.2 mm and fit broken power laws to the intensity profile. The average is in the inner regions (), similar to the average found by Mueller et al. There is very little overlap between high mass samples. The two sources in common agree withing uncertainties in .
The Motte & André (2001) survey at 1.3 mm towards low mass cores gave an average steeper by 40% for 10 sources in common. Motte & André use the analytical approximation with a single temperature power law (with q ranging from to ); however, detailed modeling has shown that the temperature profile changes from falling (positive ) to rising (negative ) within the regions of the envelope probed by these two surveys (Figure 2). Jørgensen et al. (2002) use a one dimensional model of the radiative transfer of SCUBA-observed, low mass cores, but ignore the effects of the ISRF. For 7 sources in common, their average is flatter by 30% . If the ISRF is not included in the model, the temperature profile will continue to drop towards the outside of the core and the resulting best fit density distribution must be flatter to compensate for the colder dust grains in the outer envelope. There are significant variations between the best fit models from these surveys. The effects of the ISRF on the temperature profile can partially explain the differences and must be included in radiative transfer models (Shirley et al. 2002).
The robustness of the best fit density distribution can be tested by comparing to the density derived from near-IR extinction maps. In the case of B335, a low mass Class 0 protostar, the best fit density distribution (, Shirley et al. 2002) agrees well with the extinction profile derived from NICMOS images (Harvey et al. 2001) for radii beyond AU. The near-IR extinction map is unable to probe regions of high extinction (AV 30 50 mag) due to a lack of background sources (Alves et al. 1999, Lada et al. 1999); therefore, we are unable to compare methods in the inner regions of the envelope of B335 ( AU). Interferometric observations are needed at submm wavelengths to test the findings from the dust continuum models at smaller radii. Nevertheless, it is encouraging that two different methods are consistent in the outer region of the envelope. Further comparisons with NIR extinction maps are anxiously awaited.
4. Caveats & Future Work
There are many caveats and systematic effects that may affect the interpretation of the best fit density distribution. Several sources (e.g., L1544 and L1157) have asymmetric contours that cannot be modeled with a one dimensional radiative transfer code. Multi-dimensional radiative transfer codes are needed to model asymmetric cores.
Outflows are observed towards many of the sources in our sample. In the near-IR extinction study of B335, it was necessary to consider clearing of material in outflow cones with a opening angle, while the submm emission displays no evidence of the outflow (Figure 1). However, several cores display emission extending along the outflow direction (e.g., L1157). A 1D radiative transfer code cannot properly model the effects of the outflow.
Pure envelope models without disks have been used in the models; however, disks may contribute a significant fraction of the flux at submm wavelengths within the central beam. Since a centrally normalized radial profile is used, the disk contribution may flatten the interpretation of the density profile (in an extreme limit) up to (Shirley et al. 2002, Young et al. 2002). Strong constraints on the disk flux await observations by submm interferometers (SMA and ALMA). The potential importance the disk must not be ignored in future dust continuum studies.
Dust continuum modeling is a powerful diagnostic of the density and temperature structure of protostellar cores. The methods of modeling will become more refined with 3D radiative transport and the inclusion of asymmetries, outflows, and disks. Studies of protostellar envelopes on scales of 10 - 105 AU will be possible with the combination of submm interferometers and single dish bolometer cameras.
References
Alves, J., Lada, C. J., Lada, E. A. 1999, ApJ, 515, 265
Beuther, H., Schilke, P., Menten, K. M., Motte, F., Sridharan, T. K., & Wyrowski, R. 2001, ApJ, 566, 945
Chandler, C. J., & Richer, J. S. 2000, ApJ, 530, 851
Chen, H., Myers, P. C., Ladd, E. F., & Wood, D. O. S. 1995, ApJ, 445, 377
Egan, M. P., Leung, C. M., & Spagna, G. R. 1988, Comput. Phys. Comm., 48, 271
Evans, N. J., II, Rawlings, J. M. C., Shirley, Y. L., & Mundy, L. G. 2001, ApJ, 557, 193
Harvey, D.W.A., Wilner, D. J., Lada, C. J., Myers, P. C., Alves, J. F., & Chen, H. 2001, ApJ, 563, 903
Hatchell, J., Fuller, G. A., Millar, T. J., Thompson, M. A., & MacDonald. G. H. 2000, A&A, 357, 637
Hogerheijde, M. R., & Sandell G. 2000, ApJ, 534, 880
Jørgensen, J. K., Schöier, F. L., & van Dishoeck, E. F. 2002, A&A, in press
Lada, C. J., Alves, J., Lada, E. A. 1999, ApJ, 512, 250
Motte, F., & André, P. 2001, A&A, 365, 440
Mueller, K. E., Shirley, Y. L., Evans, N. J., II, & Jacobson, H. R. 2002, ApJS, submitted
Ossenkopf, V., & Henning, T. 1994, A & A, 291, 943
Shirley, Y. L., Evans, N. J., II, & Rawlings J. M. C., & Gregersen, E. M. 2000, ApJS, 131, 249
Shirley, Y. L., Evans, N. J., II, & Rawlings J. M. C. 2002, ApJ, 575, in press
Young, C. H., Shirley, Y. L., Evans, N. J., II, & Rawlings, J. M. C. 2001, ApJS, submitted.