An interferometric-spectroscopic orbit for the binary HD 195987: Testing models of stellar evolution for metal-poor stars
Abstract
We report spectroscopic and interferometric observations of the moderately metal-poor double-lined binary system HD 195987, with an orbital period of 57.3 days. By combining our radial-velocity and visibility measurements we determine the orbital elements and derive absolute masses for the components of M☉ and M☉, with relative errors of 2% and 1%, respectively. We also determine the orbital parallax, mas, corresponding to a distance of pc. The parallax and the measured brightness difference between the stars in , , and yield the component absolute magnitudes in those bands. We also estimate the effective temperatures of the stars as K and K. Together with detailed chemical abundance analyses from the literature giving [Fe/H] (corrected for binarity) and [/Fe], we use these physical properties to test current models of stellar evolution for metal-poor stars. Among the four that we considered, we find that no single model fits all observed properties at the measured composition, although we identify the assumptions in each one that account for the discrepancy and we conclude that a model with the proper combination of assumptions should be able to reproduce all the radiative properties. The indications from the isochrone fits and the pattern of enhancement of the metals in HD 195987 are consistent with this being a thick disk object, with an age of 10–12 Gyr.
1 Introduction
Accurate determinations of the physical properties of stars in binary systems (mass, radius, temperature, etc.) provide for fundamental tests of models of stellar structure and stellar evolution. The most basic of those stellar properties is the mass. Several dozen eclipsing binary systems have component mass and radius determinations that are good to 1–2% (e.g., Andersen, 1991), and show that main-sequence models for stars with masses in the range from about 1 M☉ to 10 M☉ and heavy element abundances near solar are in fairly good agreement with the observations. However, models for stars with masses that are significantly higher or lower, or that are in very early (pre-main sequence) or very advanced (post-main sequence) stages of evolution, or models for chemical compositions that are much different from solar, are largely untested by observations due to a lack of suitable systems or a lack of accuracy.
Stellar evolution theory has a wide range of applications in modern astrophysics, some of which have profound cosmological implications. One such application is the estimate of the ages of globular clusters, which represent the oldest of the stellar populations in our Galaxy. Because the metallicities of globular clusters are typically much lower than solar, model fits to color-magnitude diagrams can be viewed as useful tests of theory at these metal-poor compositions, at least regarding the general shape of the isochrones. However, the predicted mass at any given point along a fitted isochrone cannot be tested directly against accurate observations because such a constraint is unavailable for low metallicities. While it is true that there is no immediate cause for concern regarding the accuracy of current metal-poor models, the use of such calculations for deriving the age and other properties of globular clusters remains an extrapolation to some degree, and it would be reassuring to have detailed observational support.
Double-lined spectroscopic binary systems with known compositions below [Fe/H] that are also eclipsing and are therefore particularly suitable for accurate determinations of the masses and radii are virtually non-existent, both in clusters and in the general field111A recent exception is the binary system OGLEGC-17 in the globular cluster Cen, discovered by the OGLE microlensing group (Udalski et al., 1993). A preliminary study by Thompson et al. (2001) yielded encouraging results with errors in the masses and radii of 7% and 3%, respectively, and a more detailed analysis using additional observations can be expected in the near future (see Kaluzny et al., 2001). At an estimated metallicity of [Fe/H] this is an extremely important system.. But the absolute masses can still be determined even when the binary is not eclipsing, if the pair can be spatially resolved so that the inclination angle of the orbit can be measured. With the highly precise astrometry now achievable using modern interferometers, this can significantly extend the pool of objects available for testing models of stellar evolution (e.g., Armstrong et al., 1992; Hummel et al., 1994; Boden et al., 1999a; Boden, Creech-Eakman, & Queloz, 2000; Hummel et al., 2001).
HD 195987 (HIP 101382, G209-35, Gliese 793.1, Groombridge 3215, , , J2000, ) is a binary with a period of 57.3 days (Imbert, 1980) reported to have a metallicity as low as [m/H] (Laird, Carney, & Latham, 1988), although more recent estimates are not as low. Originally listed as a single-lined spectroscopic binary, further observations of HD 195987 have revealed the weak secondary spectrum so that the system is now double-lined. The possibility of eclipses has been mentioned occasionally in the literature, and would obviously make the system even more interesting. However, the astrometric observations described in this paper clearly rule that out. The object was marginally resolved on one occasion by the speckle technique (Blazit, Bonneau, & Foy, 1987), but subsequent attempts have failed to separate the components (Balega et al., 1999; Mason et al., 2001a). Measurements by the HIPPARCOS mission (Perryman et al., 1997) detected the photocentric motion of the system with a semimajor axis of about 5 mas, and allowed the inclination angle and therefore the absolute masses to be measured for the first time, albeit with relatively large uncertainties (see Osborn & Hershey, 1999). More recently the components have been clearly resolved by the Palomar Testbed Interferometer (PTI), opening the possibility of establishing the inclination angle of the orbit with much higher accuracy. This makes it a potentially important system in which the absolute masses can be determined and used to compare with stellar evolution theory for metal-poor stars, and is the motivation for this paper.
We report here our spectroscopic and interferometric observations of HD 195987, the analysis of which has provided accurate masses (good to 1–2%) and luminosities for the two components. We compare these measurements with recent models for the appropriate metallicity.
2 Observations
2.1 Spectroscopy
HD 195987 was originally placed on the observing program at the Harvard-Smithsonian Center for Astrophysics (CfA) as part of a project to monitor the radial velocities of a sample of high proper motion objects selected from the Lowell Proper Motion Survey (Giclas, Burnham, & Thomas, 1971, 1978). The goal of this project is to investigate a variety of issues related to Galactic structure (see Carney & Latham, 1987). Observations were obtained from 1983 July to 2001 January mostly with an echelle spectrograph mounted on the 1.5-m Wyeth reflector at the Oak Ridge Observatory (Harvard, Massachusetts), and occasionally also with nearly identical instruments on the 1.5-m Tillinghast reflector at the F. L. Whipple Observatory (Mt. Hopkins, Arizona) and the Multiple Mirror Telescope (also on Mt. Hopkins, Arizona) prior to its conversion to a monolithic 6.5-m mirror. A single echelle order was recorded with photon-counting intensified Reticon detectors at a central wavelength of 5187 Å, with a spectral coverage of 45 Å. The strongest features present in this window are the lines of the Mg I b triplet. The resolving power is , and the signal-to-noise (S/N) ratios achieved range from about 13 to 50 per resolution element of 8.5 km s-1. A total of 73 usable spectra were obtained over a period of more than 17 years. The stability of the zero-point of our velocity system was monitored by means of exposures of the dusk and dawn sky, and small systematic run-to-run corrections were applied in the manner described by Latham (1992).
The observations for the first 3 years were analyzed by Latham et al. (1988) with the techniques available at the time, but the lines of the secondary are so faint that they escaped detection and the object was treated as single-lined. With the introduction of more sophisticated analysis methods it was later discovered that the lines from the secondary could in fact be seen (Carney et al., 1994). A preliminary analysis has been presented by Goldberg et al. (2002) on the basis of the same spectra as the earlier study. For the present investigation many more observations were obtained at higher S/N ratios and at phases that contribute more information to the mass determinations. Radial velocities from all of the spectra were derived by cross-correlation using the two-dimensional algorithm TODCOR (Zucker & Mazeh, 1994). The templates used for the primary and secondary of HD 195987 were taken from an extensive library of synthetic spectra based on model atmospheres by R. L. Kurucz222Available at http://cfaku5.harvard.edu., computed by Jon Morse specifically for the wavelength window and resolution of our spectra. They are available for a range of effective temperatures (), projected rotational velocities (), surface gravities (), and metallicities ([m/H]). Grids of correlations were run to establish the template parameters giving the best match to each component, based on the peak correlation value averaged over all exposures and weighted by the S/N ratio of each spectrum. The stars present no measurable rotational broadening in our spectra, so we adopted values of 0 km s-1, along with values of 4.5, appropriate for dwarfs. The temperature and metallicity determinations are complicated by the fact that the secondary component is extremely faint (only 10% of the light of the primary; see below), and in addition those two quantities are very strongly correlated. We fixed [m/H] at values ranging from to (in steps of 0.5 dex) and determined the effective temperatures in each case. Lower metallicities lead to cooler temperatures because the changes in the strength of the lines from these two effects tend to compensate each other. Formally, the best match to the observed spectra was found for a metallicity around [m/H] and effective temperatures of K and K for the primary and secondary, respectively. However, because of the tradeoff mentioned above, different combinations of [m/H] and give nearly equally good fits without changing the velocities very much, and an external constraint is needed on one of these parameters to break the degeneracy. For this we chose the metallicity, since several determinations are available and appear to agree that the system is metal-deficient compared to the Sun (§5). We adopted the value [m/H], which leads to effective temperatures of K and K. The light ratio in our spectral window was found to be .
Systematic errors in the radial velocities resulting from the narrow spectral window were investigated by means of numerical simulations, as discussed in detail by Latham et al. (1996). Briefly, we generated a set of artificial binary spectra by combining the primary and secondary templates in the appropriate ratio and applying velocity shifts for both components as computed from a preliminary orbital solution at the actual times of observation of each of our spectra. These artificial spectra were then processed with TODCOR in exactly the same way as the real observations, and the resulting velocities were compared with the input (synthetic) values. The differences were found to be smaller than 0.4 km s-1, but were nevertheless applied to the raw velocities as corrections. The effect on the minimum masses derived from the spectroscopic orbit, which depend on the velocity semi-amplitudes and , is at the level of 0.5%. The final velocities, including corrections, are listed in Table 1.
The spectroscopic orbital elements resulting from these velocities are given in column 2 of Table 2. They are the period (, in days), the center-of-mass velocity (, in km s-1), the radial velocity semi-amplitudes of the primary and secondary ( and , in km s-1), the orbital eccentricity (), the longitude of periastron of the primary (, degrees), and the time of periastron passage (, Julian days). Earlier single-lined orbital solutions for HD 195987 were published by Imbert (1980), Latham et al. (1988), and Duquennoy & Mayor (1991), and Goldberg et al. (2002) recently reported a double-lined solution. They are included in Table 2 for comparison with ours. The orbit published by Latham et al. (1988), which is based on a small subset of the same spectra used in the present paper, was superseded by that by Goldberg et al. (2002) that used the same material, which in turn is superseded by our new definitive results. The solution by Duquennoy & Mayor (1991) is not independent of that by Imbert (1980), but represents an update using additional observations with the same instrument. As seen in the table, all these solutions are fairly similar.
The uncertainties given in Table 2 for the velocity amplitudes of our new solution, upon which the masses of the components depend critically, are strictly internal errors. In addition to the biases described earlier, further systematic errors in the velocities can occur because of uncertainties in the template parameters, particularly the temperatures and the metallicity. Extensive grids of correlations showed that the sensitivity of the velocity amplitudes to the secondary temperature is minimal because that star is so faint. They also showed that the combined effects of errors in the primary temperature and the metallicity contribute an additional uncertainty to and to . These have been combined with the internal errors in the amplitudes, and propagated through to the final masses that we report later in §5.
2.2 Interferometry
Near-infrared, long-baseline interferometric measurements of HD 195987 were conducted with the Palomar Testbed Interferometer (PTI), which is a 110-m baseline - and -band (1.6 m and 2.2 m) interferometer located at Palomar Observatory. It is described in full detail elsewhere (Colavita et al., 1999). The instrument gives a minimum fringe spacing of about 4 mas at the sky position of our target, making the HD 195987 binary system readily resolvable.
The interferometric observable used for these measurements is the normalized fringe contrast or visibility (squared), , of an observed brightness distribution on the sky. The analysis of such data in the context of a binary system is discussed in detail by Hummel et al. (1998), Boden et al. (1999a), Boden et al. (1999b), Boden, Creech-Eakman, & Queloz (2000), and Hummel et al. (2001), and will not be repeated here.
HD 195987 was observed with PTI in conjunction with objects in our calibrator list in the band (2.2 m) on 32 nights between 1999 June 24 and 2001 September 28, covering roughly 14 periods of the system. Additionally, the target was observed in the band (1.6 m) on five nights between 2000 July 20 and 2001 September 27. HD 195987, along with the calibration objects, was observed multiple times during each of these nights, and each observation, or scan, was approximately 130 seconds long. For each scan we computed a mean value from the scan data, and the error in the estimate from the rms internal scatter (Colavita, 1999). HD 195987 was always observed in combination with one or more calibration sources within 20 on the sky. For our study we used four stars as calibrators: HD 195194, HD 200031, HD 177196, and HD 185395. Table 3 lists the relevant physical parameters for these objects. The last two calibration objects are known to have at least one visual companion (Washington Double Star Catalog; Mason et al., 2001b) that could conceivable affect our visibility measurements. The companion of HD 177196 is so distant (44″ at last measurement in 1925) that it has no effect because of the effective 1″ field stop of the PTI fringe camera focal plane (Colavita et al., 1999). Of the three recorded companions of HD 185395 two are more than 40″ away, and the other has an angular separation of 29. This close companion is more than 5 magnitudes fainter than the primary in the band, and can therefore also be safely ignored.
The calibration of the HD 195987 data was performed by estimating the interferometer system visibility () using calibration sources with model angular diameters, and then normalizing the raw HD 195987 visibility by to estimate the measured by an ideal interferometer at that epoch (Mozurkewich et al., 1991; Boden et al., 1998). Calibrating our HD 195987 dataset with respect to the four calibration objects listed in Table 3 results in a total of 171 calibrated scans (134 in , 37 in ) on HD 195987 on 37 different nights. Our calibrated synthetic wide-band visibility measurements in the and bands are summarized in Table 4 and Table 5, which include the time of observation, the calibrated measurement and its associated error, the residual from the final fit (see below), the (,) coordinates in units of the wavelength (weighted by the S/N ratio), and the orbital phase for each of our observations.
3 Determination of the orbit
The radial velocities and interferometric visibilities for HD 195987 contain complementary information on the orbit of the system, which is described by the 7 elements mentioned in §2.1 and the additional elements (relative semimajor axis, expressed here in mas), (inclination angle), and (position angle of the ascending node). Only by combining data from both techniques can all 10 elements of the three-dimensional orbit be determined. While the center-of-mass velocity and the velocity amplitudes depend only on the spectroscopy, the information on , , and is contained solely in the interferometric visibilities. However, the values are invariant to a change in the position angle of the binary, so distinguishing between the descending node and the ascending node (where, according to convention, the secondary is receding) relies on our knowledge of the radial velocities.
As in previous analyses using PTI data (Boden et al., 1999a, b; Boden, Creech-Eakman, & Queloz, 2000; Boden & Lane, 2001), the orbit of HD 195987 is solved by fitting a Keplerian orbit model directly to the calibrated and radial velocity data simultaneously. This allows the most complete and efficient use of the observations333In principle it would be possible to derive the position angle () and the angular separation () of the binary from the visibility measurements for each night. These intermediate data could then be used instead of the visibilities in what might be considered a more conventional astrometric-spectroscopic solution. However, the result would be inferior to the fit we describe here for several reasons (see, e.g., Hummel et al., 2001), not the least of which is the fact that, due to the pattern of our observations, the number of scans on many nights is insufficient to solve for the separation vectors, which would result in a rather serious loss of information (phase coverage). Therefore, we refrain from even listing values of {, } in Table 4 and Table 5., so long as the two types of measurements are free from systematic errors (see below). It also takes advantage of the redundancy between spectroscopy and interferometry for the four elements , , , and . Relative weights for the velocities (which are different for the primary and the secondary) and the visibilities were applied based on the internal errors of each type of observation.
Formally the interferometric visibility observables have the potential for resolving not only the HD 195987 relative orbit, but the binary components themselves, and these two effects must be considered simultaneously (e.g., Hummel et al., 1994). However, in the case of HD 195987 at a distance of approximately 22 pc the dwarf components have typical apparent sizes of less than 0.5 mas, which are highly unresolved by the 3–4 mas PTI fringe spacing. We have therefore estimated the apparent sizes of the components using the bolometric flux and effective temperatures (see Blackwell & Lynas-Gray, 1994, and references therein), and constrained the orbital solutions to these model values (§5). We have adopted apparent component diameters of mas and mas for the primary and secondary components, respectively. These values are much smaller than the PTI and fringe spacings and have a negligible effect on the parameters of the orbit.
The results of this joint fit are listed in Table 6 (“Full-fit” solution), where we have used the -band and -band visibilities simultaneously, weighted appropriately by the corresponding errors. In addition to the orbital elements, the visibility measurements provide the intensity ratio in and , which are critical for the model comparisons described later.
The uncertainties listed for the elements in Table 6 include both a statistical component (measurement error) and our best estimate of the contribution from systematic errors, of which the main components are: (1) uncertainties in the calibrator angular diameters (Table 3); (2) the uncertainty in the center-band operating wavelength ( 1.6 m and 2.2 m), taken to be 20 nm (1%); (3) the geometrical uncertainty in our interferometric baseline (%); and (4) listed uncertainties in the angular diameters assumed for the stars in HD 195987, that were held constant in the fitting procedure.
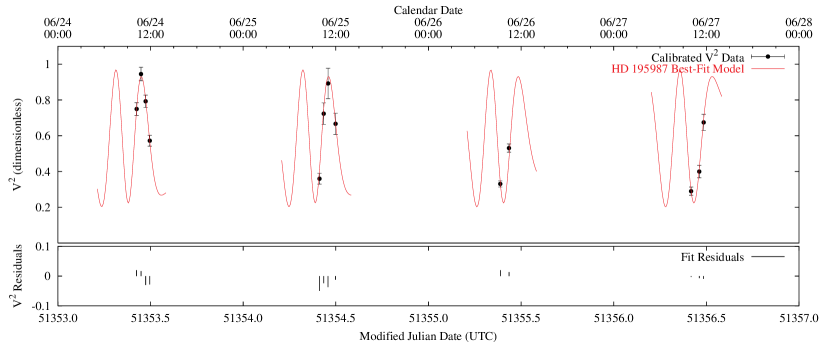
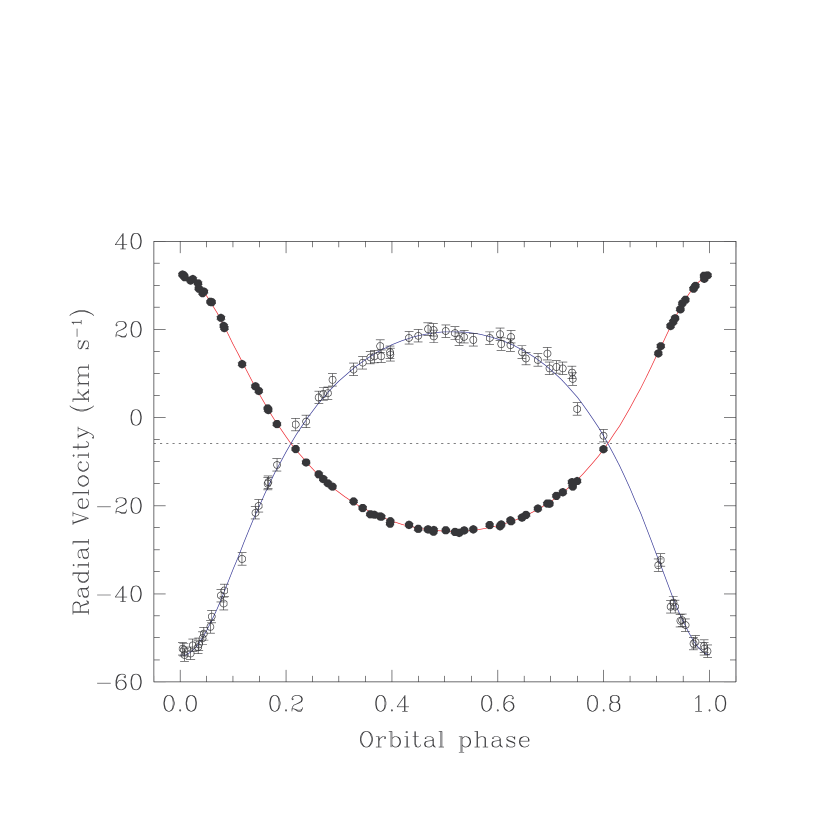
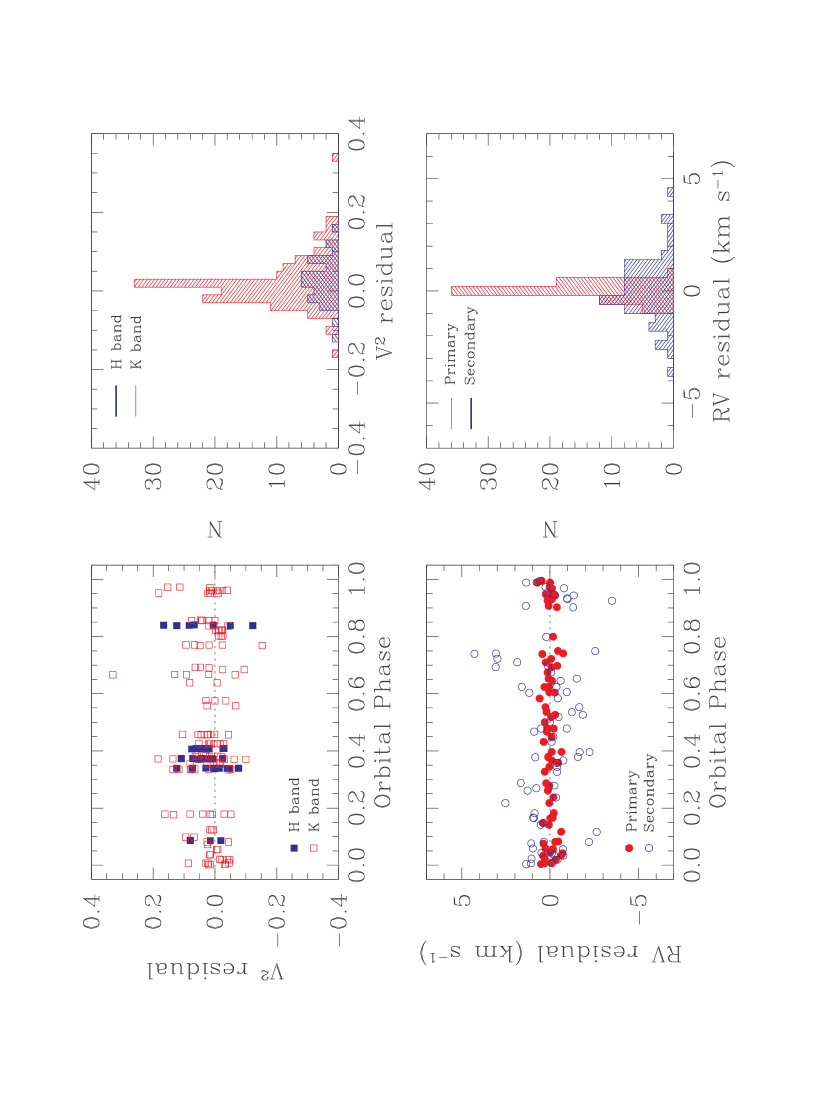
Figure 1 depicts the relative visual orbit of the HD 195987 system on the plane of the sky, with the primary component rendered at the origin and the secondary component shown at periastron. We have indicated the phase coverage of our data on the relative orbit with heavy line segments. Our interferometric data sample essentially all phases of the orbit (see also Figure 4), leading to a reliable determination of the elements. The fit to these data is illustrated in Figure 2, which shows four consecutive nights of PTI visibility data on HD 195987 (24–27 June 1999), and predictions based on the “Full Fit” model for the system (Table 6). The fit to the radial velocity measurements is shown in Figure 3. Phase plots of the and velocity residuals are shown in Figure 4, along with the corresponding histograms. We note here in passing that the agreement between the speckle measurement by Blazit, Bonneau, & Foy (1987) (which by chance was obtained very near periastron passage, at phase 0.981) and our interferometric-spectroscopic orbit is very poor. However, this is not surprising given the limited resolution of the speckle observation (32 mas in the visible) compared to the predicted separation at the time of the observation (10.5 mas).
For comparison, we list also in Table 6 the solutions we obtain for HD 195987 using only the interferometric visibilities (“-only”), and only the radial velocities (“RV-only”, repeated from Table 2). These two separate fits give rather similar results, indicating no significant systematic differences between the spectroscopic and interferometric data sets. Also included in the table is the solution reported in the HIPPARCOS Catalogue, where the semimajor axis refers to the photocentric motion of the pair rather than the relative motion. In the HIPPARCOS solution the elements , , , and were adopted from the work by Duquennoy & Mayor (1991), and held fixed. Given the much larger formal errors, the resulting elements are as consistent with our solution as can be expected.
4 The light ratio in the optical
The interferometric measurements of HD 195987 with PTI provide the intensity ratio between the components in the and bands, and allow the individual luminosities to be determined in the infrared. A similar determination in the optical based on our spectroscopy was given in §2.1. A small correction from the 5187 Å region to the visual band yields . Because the secondary is so faint, this estimate may be subject to systematic errors that are difficult to quantify.
The detection of the photocentric motion of the binary by HIPPARCOS, along with the measurement of the apparent separation with PTI, allows an independent estimate of the light ratio to be made in the optical. The relative semimajor axis () and the photocentric semimajor axis () are related by the classical expression , where is the mass fraction (also expressed as in terms of the observables) and is the fractional luminosity. The ratio at the effective wavelength of the HIPPARCOS observations ( passband) can therefore be determined.
In order to take advantage of the much improved orbital elements compared to those available to the HIPPARCOS team, we have re-analyzed the HIPPARCOS intermediate astrometric data (abscissae residuals) as described in the original Catalogue (ESA, 1997) (see also Pourbaix & Jorissen, 2000). The orbital period, the eccentricity, the longitude of periastron, and the time of periastron passage were adopted from our combined visibility-radial velocity fit as listed in Table 6, and held fixed. In addition, the inclination angle and the position angle of the node are now known much better than can be determined from the HIPPARCOS data, so we adopted our own values here as well. The only parameters left to determine are then the semimajor axis of the photocenter (), the corrections to the position and proper motion of the photocenter, and the correction to the HIPPARCOS parallax.
The relevant results from this analysis are mas and mas. The uncertainties may be somewhat underestimated because they do not account for correlations between the elements (since we have fixed several of them in the new solution), although we do not expect the effect to be large in this case. As it turns out, the new results are not very different from the original determinations by the HIPPARCOS team ( mas and mas). Forcing the HIPPARCOS parallax to come out identical to our orbital parallax makes a negligible change in the semimajor axis of the photocenter.
The luminosity ratio we determine from this is , which includes a very small correction from the band to the Johnson band. This is in good agreement with our spectroscopic determination, and we adopt the weighted average of the two results, , which corresponds to mag.
5 Physical properties of HD 195987
The absolute masses of the components follow from the results of our combined interferometric-spectroscopic solution summarized in Table 6, and are M☉ and M☉444These uncertainties include the contribution due to the template parameters discussed in §2.1.. The high accuracy achieved (2.1% error for the primary and 1.2% error for the secondary) is the result of the high quality of the observations as well as the favorable geometry of the system (). The limiting factor is the spectroscopy, and in particular the velocities for the faint secondary.
The combination of the angular separation from interferometry and the linear separation from spectroscopy yields the orbital parallax of the system independently of any assumptions beyond Newtonian physics. The result, mas (distance pc) is nearly a factor of two more precise than our revised HIPPARCOS value of mas, and the two determinations differ by about 1.5 (1.7%). The corresponding difference in the distance modulus, and consequently in the absolute magnitudes derived below, is mag. The ground-based trigonometric parallax of HD 195987 from the weighted average of 5 determinations is mas (van Altena, Lee, & Hoffleit, 1995).
The component luminosities in the , , and passbands depend on the flux ratios that we have measured, on the orbital parallax, and on the combined-light photometry. For the magnitude of the system we adopt the average value given by Mermilliod & Mermilliod (1994), which is the result of 10 individual measurements from 7 different sources: . Two measurements of are available from Voelcker (1975) and from the 2MASS Catalog (Skrutskie et al., 1997). Conversion of both to the CIT system (Elias et al., 1983), using the transformations by Bessell & Brett (1988) and Carpenter (2001), gives . The magnitude of the system measured by Voelcker (1975) is . A 2MASS measurement in is not available because the object is saturated in this passband, although not in and . This is somewhat unexpected if we assume normal colors for stars of this mass, and it casts some doubt on the reliability of the -band measurement. As a check we obtained a new measurement using an infrared camera on the 1.2-m telescope at the F. L. Whipple Observatory equipped with a InSb detector array, with standard stars adopted from Elias et al. (1982) and 2MASS. The result, (on the CIT system), is significantly different from the previous estimate, confirming our suspicions, and it is the value we adopt for the remainder of the paper. Any extinction and reddening corrections are negligible at a distance of only 22 pc. The individual absolute magnitudes and colors are listed in Table 7 along with the other physical properties.
The color indices for each component allow for an independent estimate of the effective temperatures of the stars. Based on the color-temperature calibrations by Martínez-Roger, Arribas, & Alonso (1992), Alonso, Arribas, & Martínez-Roger (1996), and Carney et al. (1994) (the later being for the CIT system), we obtain average values of K and K that are nearly independent of the adopted metal abundance (for which these calibrations include a corrective term). The primary estimate is identical to our spectroscopic value in §2.1, while the secondary estimate is somewhat lower than the spectroscopic value and its uncertainty has a substantial contribution from the photometric errors.
An additional estimate of the effective temperature may be obtained from photometry in other bands, via deconvolution of the combined light. For this we used the indices for HD 195987 in the Johnson and Strömgren systems as listed by Mermilliod & Mermilliod (1994) (; ) and by Olsen (1983, 1993) (, , ). The deconvolution was performed using tables of standard colors for normal stars by Lejeune, Cuisinier, & Buser (1998) (for a metallicity of [Fe/H]) and by Olsen (1984), and adopting a magnitude difference between the primary and secondary in the visual band of mag (§4). In addition to the calibrations mentioned above we used those by Carney (1983) and Olsen (1984). The results based on the deconvolved , , and also the indices for the system (accounting for the small difference between the different photometric systems in the infrared) give values of K for the primary and K for the secondary, identical to the estimates from the observed colors.
We adopt for the stars in HD 195987 the weighted average of our three determinations of the effective temperature (one spectroscopic and two photometric): K and K. From these effective temperatures, an estimated system bolometric flux of () 10-8 erg cm-2 s-1 based on archival broadband photometry, and our observed 2.2 m intensity ratio we estimate component bolometric fluxes of () and () 10-8 erg cm-2 s-1. These combined again with the adopted component temperatures yield estimated apparent diameters of mas and mas for the primary and secondary components, respectively, which are the values adopted for the orbital fit (§3). At our estimated system distance to HD 195987 these angular diameters imply physical radii of R☉ and R☉ for the primary and secondary components, respectively.
As mentioned in §1, early high-resolution spectroscopic estimates of the metal abundance of HD 195987 placed the system in an interesting range for absolute mass determinations, at a metallicity of [m/H] (Laird, Carney, & Latham, 1988). Subsequently the same authors revised their estimate upward to [m/H] using the same techniques and more spectra (Carney et al., 1994). Other determinations in the literature have given values that are similar or somewhat closer to the solar abundance. Fulbright (2000) used high-resolution spectroscopy to derive an estimate of [Fe/H], while Beers et al. (1999) obtained [Fe/H] with a combination of different spectroscopic methods based on lower-resolution spectra. Marsakov & Shevelev (1988) inferred [Fe/H] based on the ultraviolet excess of the system, and Wyse & Gilmore (1995) used Strömgren photometry to estimate the metallicity at [Fe/H]. Despite the range of values, these sources do seem to point toward a heavy element abundance moderately lower than the Sun, by perhaps a factor of 3 or so. We discuss possible biases in the metallicity estimates in §6.2.
6 Discussion
With many of the fundamental physical properties of HD 195987 now known to high accuracy, we proceed in this section with a detailed comparison between the observations and recent models of stellar evolution. In addition to the prospect of an interesting comparison for a chemical composition lower than solar, both components of our system have masses below 1 M☉, a regime in which relatively few stars have absolute mass determinations good to 1–2% (see, e.g., Andersen, 1991; Clausen et al., 1999; Delfosse et al., 2000).
6.1 Comparison with stellar evolution models
In order for a given model to be successful, we require that it agree with all the measurements for HD 195987 simultaneously, and for both components at the same time since they are presumably coeval. The measurements are the absolute masses, the absolute magnitudes in three different passbands (, , ), the effective temperatures, and the metal abundance.
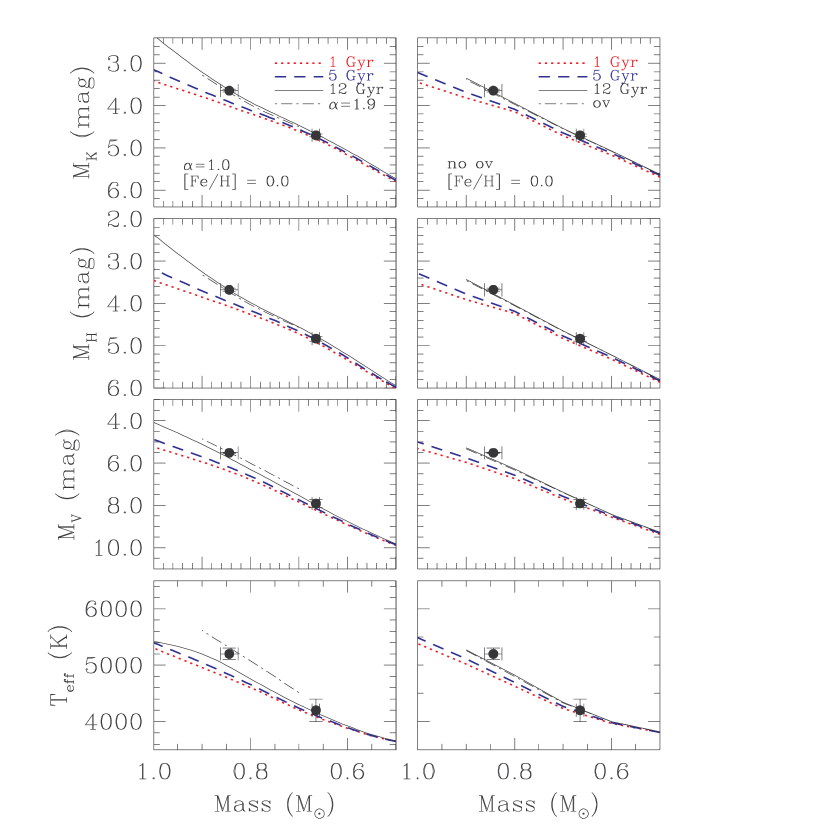
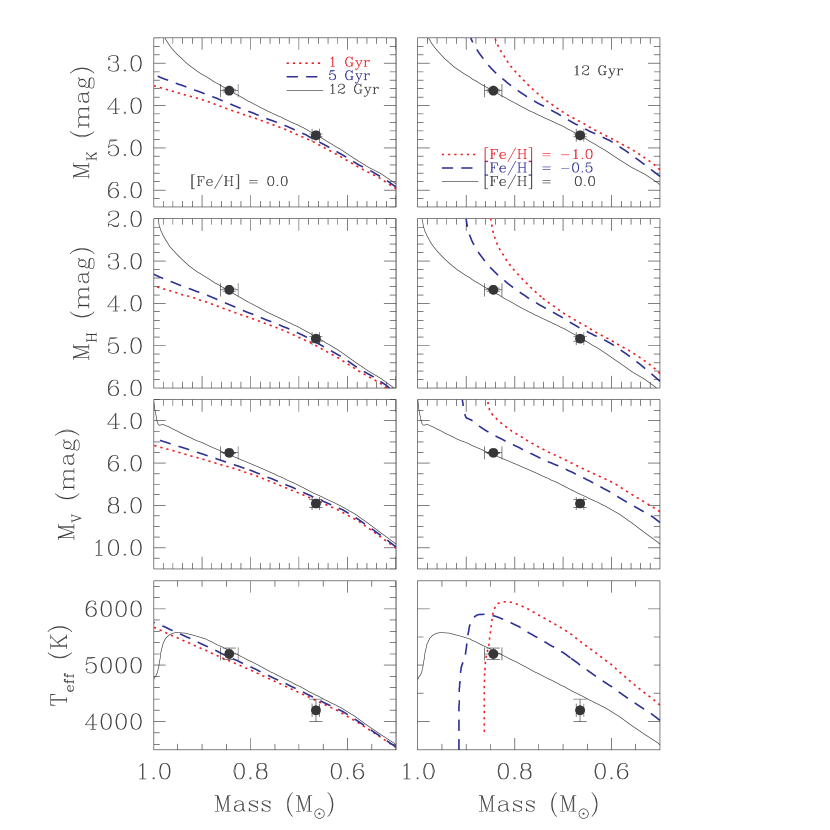
In Figure 5 we show the absolute magnitudes and temperatures of the primary and secondary of HD 195987 as a function of mass, compared with isochrones from the Yale-Yonsei models by Yi et al. (2001)555The infrared magnitudes in these isochrones are based on the color tables by Lejeune, Cuisinier, & Buser (1998), which adopt filter transmission functions from Bessell & Brett (1988) for the Johnson-Glass system. For the comparison with our observations we transformed the isochrones to the CIT system using the corrections by Bessell & Brett (1988).. Changes in the isochrones with age for a fixed metallicity equal to solar are illustrated on the left, and consist not only of a vertical displacement but also of a change in slope, becoming steeper for older ages. A similar effect is seen in the diagrams on the right-hand side, which show changes in the models for a fixed age (12 Gyr) and a range of metallicities bracketing the values reported for HD 195987. The isochrones shown with a solid line, which correspond to solar metallicity and an age of 12 Gyr, provide a fairly good fit to the absolute magnitudes in the and bands, as well as to the of the primary star. However, the secondary component appears underluminous in , or else the slope of the models in the mass- plane is too shallow. In addition, the temperatures predicted by the models may be somewhat too hot, particularly for the secondary. Setting these differences aside for the moment, the Yi et al. (2001) models would appear to point toward a metallicity for HD 195987 that is not far from solar, along with a fairly old age. This metallicity seems to conflict with the observational evidence indicated earlier. Formally the best fit to the magnitudes in , , and (primary only) gives a metallicity of [Fe/H] and an age of 11.5 Gyr. Lowering the age of the isochrones to 10 Gyr and at the same time decreasing the metallicity to [Fe/H] still produces tolerably good fits, but metallicities much lower than this are inconsistent with the measured magnitudes for any age. The disagreement with the of the secondary and with the temperatures remains.
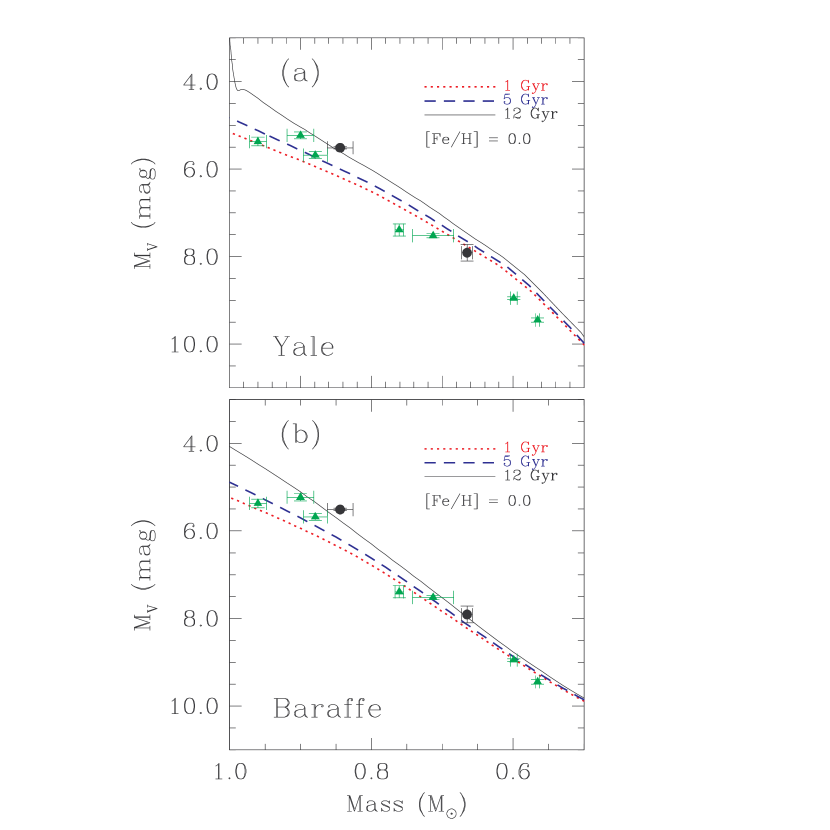
In order to investigate the discrepancy in the absolute visual magnitude for the secondary, we focus in Figure 6 on the mass- plane and add observations for other binary components that have accurately determined masses and luminosities: FL Lyr B, HS Aur A, and HS Aur B (Andersen, 1991); Gliese 570 B and Gliese 702 B (Delfosse et al., 2000); and V818 Tau B and YY Gem AB (Torres & Ribas, 2002). Figure 6a shows that it is not only the secondary of HD 195987 (filled circles) that appears underluminous compared to the Yi et al. (2001) isochrones, but four other stars with similar masses suggest the same trend (triangles). In Figure 6b we show the same observations compared to the Lyon models by Baraffe et al. (1998), for the same ages and heavy-element composition as in Figure 6a. The agreement for the secondary is now much better, and is presumably due to the use by Baraffe et al. (1998) of sophisticated model atmospheres as boundary conditions to the interior equations, whereas the Yi et al. (2001) models use a gray approximation. The latter has been shown to be inadequate for low mass stars, where molecular opacity becomes important (Chabrier & Baraffe, 1997). Figure 6 suggests that the discrepancy begins at a mass intermediate between that of the primary and the secondary in HD 195987. One other consequence of the use of the gray approximation is that the effective temperature is typically overestimated in those models, just as hinted by Figure 5.
In Figure 7 we illustrate the agreement between the observations for HD 195987 and the predictions from the models by Baraffe et al. (1998) and also by Siess, Forestini, & Dougados (1997) (see also Siess, Dufour, & Forestini, 2000). The latter isochrones also use a non-gray approximation (from fits to a different set of model atmospheres than those used by the Lyon group), and should therefore be fairly realistic as well. Once again the Baraffe et al. (1998) models (left-hand side) show reasonably good agreement in the mass-luminosity planes for solar composition and an old age (12 Gyr), but do not quite reproduce the estimated effective temperature of the primary. The Siess, Forestini, & Dougados (1997) models are similar, although the agreement in is not as good and the fit to the primary temperature is somewhat better.
In addition to the boundary conditions, another difference between the Baraffe et al. (1998) models and the Yi et al. (2001) models is the extent of mixing allowed, as described in the standard convection prescription by the mixing-length parameter . The models by Yi et al. (2001) adopt a value of that best fits the observed properties of the Sun. A much lower value of is used by Baraffe et al. (1998), whereas the best fit to the Sun in those models requires . This has significant consequences for the temperature profile and other properties such as the radius. In particular, less mixing leads to a lower effective temperature. The effect is illustrated in the diagrams on the left side of Figure 7, where the dot-dashed lines gives the predictions from the Baraffe et al. (1998) models for [Fe/H] and an age of 12 Gyr if the solar value of is used. Changes in , , and compared to the isochrones for the same age and metallicity but with (solid lines) are relatively small and in fact tend to improve the agreement in , while the temperatures predicted with are several hundred degrees hotter than with and show better agreement for the primary (the slope is also a better match to the observations). Presumably an intermediate value for the mixing-length parameter used in the Baraffe et al. (1998) models would provide an optimal fit to HD 195987 for the composition and age indicated.
Other recent models give similar fits to the observations for HD 195987. For example, the recent series of isochrones from the Padova group (Girardi et al., 2000) give fits that are also good for a metallicity near solar, and a slightly older age of 14 Gyr.
A shortcoming of the comparisons above is that a number of additional parameters in the isochrones are fixed, and they are somewhat different for each series of models. One of such parameters is the helium abundance, . The calculations by Yi et al. (2001) use for solar metallicity (Figure 5), while Baraffe et al. (1998) adopt for their models with , but use a higher value of for the more realistic models that fit the Sun with (Figure 7). Siess, Forestini, & Dougados (1997) adopted , and Girardi et al. (2000) used . While the differences in these adopted helium abundances for solar metallicity are not large, they do affect the comparisons to some degree. An increase in will shift the isochrones upwards in the mass-luminosity diagrams (opposite effect as an increase in metallicity, ), and will yield slightly higher effective temperatures. Changes in for other metallicities are governed by the enrichment law adopted in each series of models.
The effect of the treatment of convective overshooting is illustrated on the right-hand side of Figure 7 for the Siess, Forestini, & Dougados (1997) models. The dot-dashed line corresponds to the calculations for an age of 12 Gyr and an overshooting parameter of (where is the pressure scale height), while the other isochrones assume no overshooting. The change compared to the 12 Gyr isochrone with no overshooting (solid line) is hardly noticeable.
6.2 The iron abundance of HD 195987
The model comparisons above seem to point toward a metallicity for the system near solar that is at odds with the observations, along with a fairly old age (10–12 Gyr), perhaps a somewhat unusual combination. Because of the possible implications of this disagreement for our confidence in the models, in this section we examine each metallicity determination more closely in an effort to understand these discrepancies, and we attempt to quantify possible systematic errors.
The presence of the secondary, even though it is faint, affects the total light of the system at some level introducing subtle biases in the photometric estimates of the metallicity of HD 195987, which are derived from the combined colors assuming that they correspond to a single star. The photometric estimates of the temperature based on the same assumption are also affected, and this may propagate through and affect some of the spectroscopic abundance determinations as well.
In order to quantify these effects we have simulated binary systems by combining the single-star photometry of a primary and a secondary, each with normal colors, based on the same tabulations used in §5. We computed various photometric indices from the combined light, and used them to estimate the metallicity of HD 195987 following the same procedures employed by Marsakov & Shevelev (1988) (who relied on the ultraviolet excess in the Johnson system) and Wyse & Gilmore (1995) (based on Strömgren photometry). We then compared these results with those obtained for the primary alone, for a range of magnitude differences between the primary and secondary. In all cases we selected the primary so as to reproduce the actual observed colors of HD 195987 in each photometric system at mag.
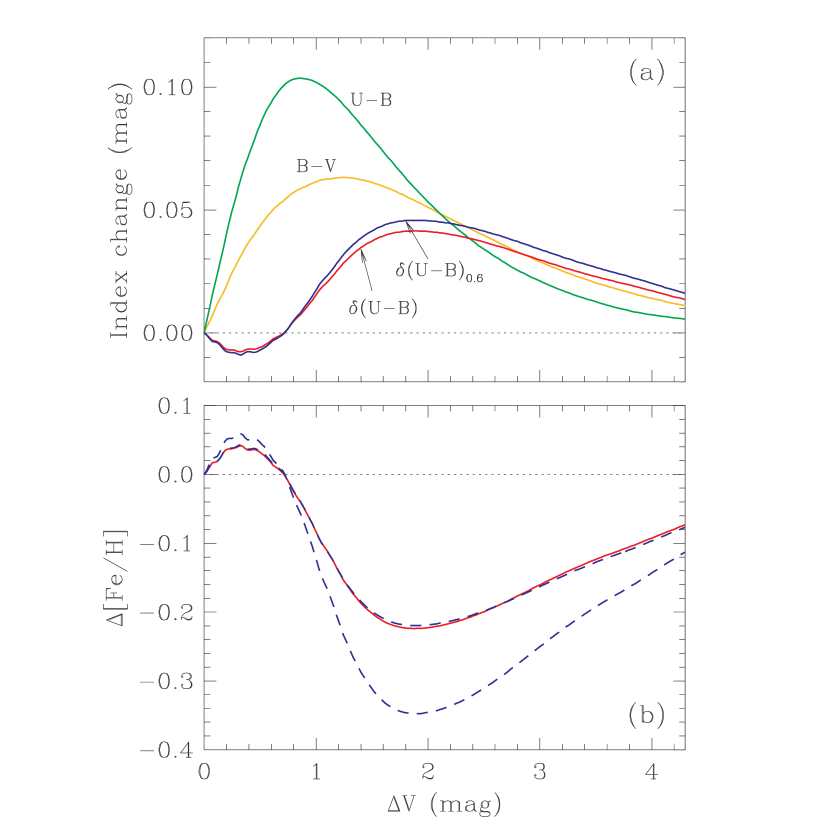
Figure 8a shows how the presence of the secondary affects the and colors, as well the ultraviolet excess used by Marsakov & Shevelev (1988), as a function of the magnitude difference. The normalized ultraviolet excess (corrected for the guillotine; see Sandage, 1969), also frequently used for metallicity estimates, has a similar behavior. Figure 8b illustrates the effect on the derived metallicity using the calibration by Marsakov & Shevelev (1988), and also two calibrations by Carney (1979) based on . The [Fe/H] estimates are biased toward lower values666The sign of these changes may seem counterintuitive. The secondary star tends to redden both the and the indices, which ought to make the combined light of the system appear more metal-rich. As it turns out, the slope of this “reddening” vector in the vs. plane is smaller than that of the blanketing vector, so that the net effect is a bias toward larger ultraviolet excesses, and therefore lower metallicity estimates. We find, however, that in general this depends both on the color of the primary and on the magnitude difference . For bluer primaries than that of HD 195987 the sign of the change is reversed in certain ranges of ., and the maximum effect is for a secondary about 2 magnitudes fainter than the primary. If the original determination by Marsakov & Shevelev (1988) ([Fe/H]) is corrected for this effect (0.2 dex at mag), the result is much closer to the solar abundance.
The normalized ultraviolet excess observed for HD 195987 is . This leads to [Fe/H] or [Fe/H] using the linear or quadratic calibration formulae by Carney (1979). From Figure 8b it is seen that in this case the corrected values would be [Fe/H].
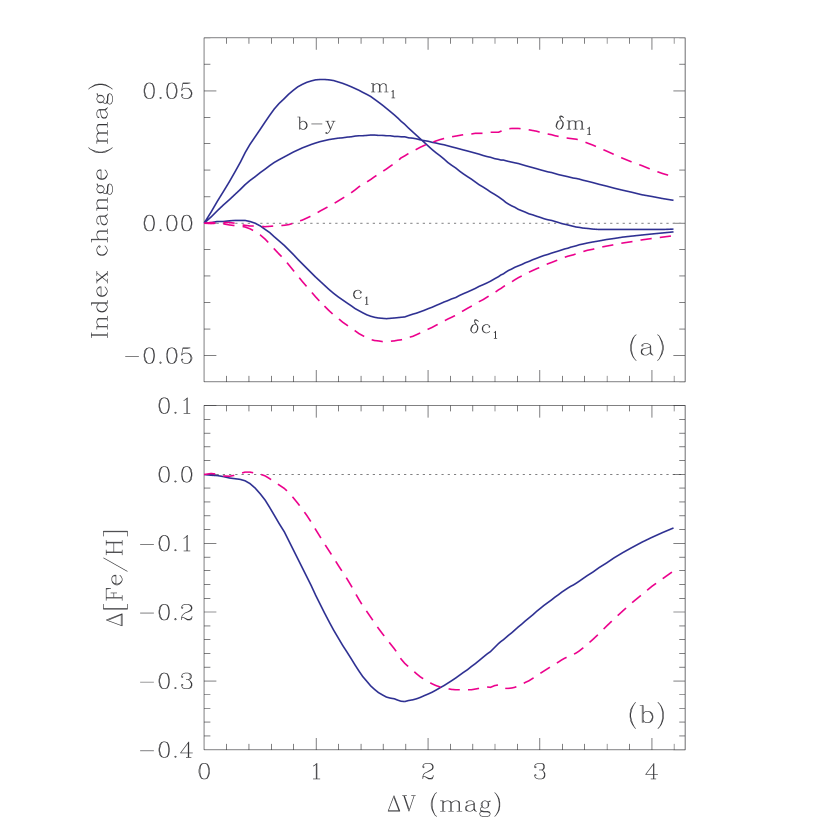
Similar effects occur in the Strömgren system. The changes in the photometric indices are shown in Figure 9a. The estimate of [Fe/H] by Wyse & Gilmore (1995) is based on the quantities {, , } and the calibration by Schuster & Nissen (1989). A different calibration by Olsen (1984) involving {, } yields a nearly identical value of [Fe/H]. As seen in Figure 9b the bias toward lower metallicities due to the secondary happens to reach a maximum quite near the of our system. If accounted for, the resulting metal abundance from the Strömgren indices would be essentially solar.
Though it may seem that these corrections bring the photometric estimates of the metallicity of HD 195987 in line with the indications from the model comparisons described earlier, the photometric determinations of [Fe/H] are as a rule less trustworthy than those based on high-resolution spectroscopy (see, e.g., Gehren, 1988).
The spectroscopic determinations in turn are not, however, completely insensitive to the presence of the secondary either. Two different effects must be considered. On the one hand the continuum from the secondary typically tends to fill in the spectral lines of the primary, which then appear weaker as if the star were more metal-poor. On the other hand the combined-light photometry is reddened. Therefore, the temperature estimates that are used to begin the spectroscopic analysis are biased toward lower values.
The metallicity determination by Carney et al. (1994), [m/H], which supersedes that by Laird, Carney, & Latham (1988), is based on a subset of the same spectra that we have used in this paper, which are of high resolution but low S/N. To derive the metal abundance they used a technique to compare the observations against a grid of synthetic spectra for a range of metallicities, adopting a fixed temperature determined from photometric indices. As they discuss, the [m/H] values derived for double-lined binaries with this method can be quite different depending on whether the spectra that are used have the lines of the two components well separated or exactly aligned. In the first case the continuum from the secondary tends to fill in the lines of the primary, as mentioned earlier, and the metallicity is biased toward lower values. In the second case, when the velocities of the stars are similar (close to the center-of-mass velocity of the binary), the effect is the opposite because the average line strength is slightly increased due to the contribution of the cooler secondary. Carney et al. (1994) used only the few spectra near the velocity available to them, because then the bias toward higher metallicities is balanced to some degree by the bias toward lower metallicities resulting from the lower temperature inferred from the combined light. The latter is the result of the strong correlation between metallicity and temperature, which is essentially the same as that mentioned in §2.1.
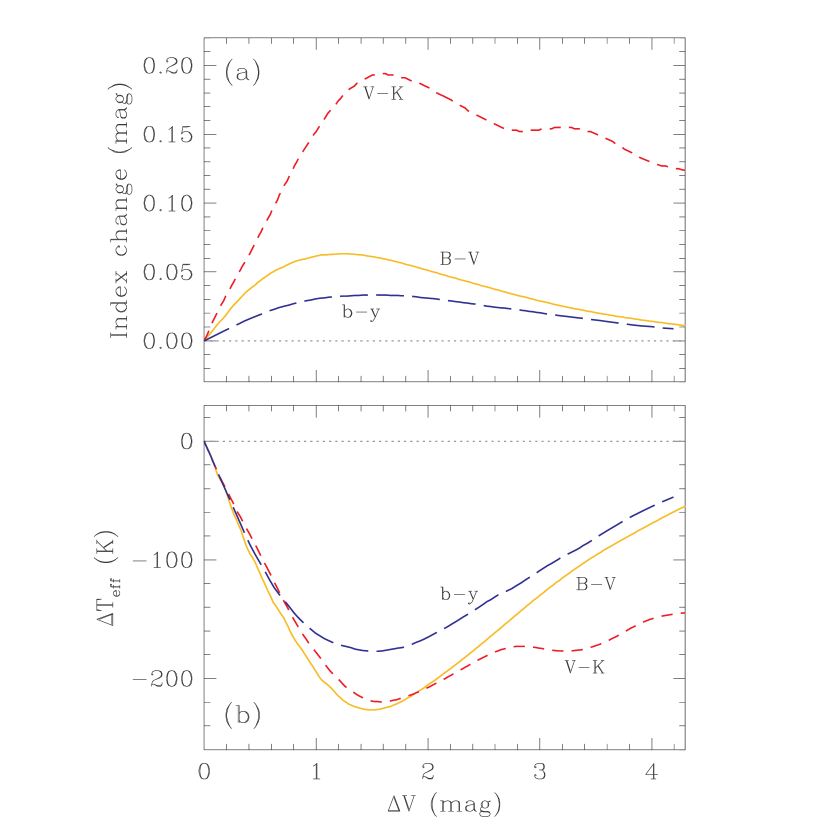
In Figure 10a we illustrate the magnitude of the effect of the secondary on the broadband and intermediate-band color indices , , and also , from simulations analogous to those performed earlier. The contamination is much more noticeable in , of course, because the secondary becomes comparatively brighter in . Changes in the effective temperature inferred from the combined light compared to those for the primary alone are shown in Figure 10b, based on the same calibrations used by Carney et al. (1994).
Simulations performed by Carney et al. (1994) to estimate the residual bias on the metallicity for double-lined systems indicate that in general the two effects do not quite cancel each other out. We estimate from their experiments that their metal abundance [m/H] for HD 195987 may still be too low by 0.15–0.20 dex, accounting for the fact that this system is a bit more extreme than the simulated binaries they considered. Note also that this metallicity estimate is labeled [m/H] instead of [Fe/H] because it includes all metals with lines present in the spectral window. The distinction could in principle be an important one due to the presence of the strong Mg I b lines in the CfA spectra, and the typically enhanced abundance of this element relative to iron in metal-poor stars (see next section). Tests described by Carney et al. (1987) indicate that the correction required for this effect is not likely to be more than about dex for this system, especially given that it may be partially masked by other corrections they applied to the abundances based on comparisons with metallicity standards that may also have enhanced magnesium (J. Laird & B. Carney 2002, priv. comm.). The contribution of the two effects described above leads to an adjusted Carney et al. (1994) estimate of [Fe/H] between and .
The metallicity determination by Beers et al. (1999), [Fe/H], is based on lower-resolution spectra (1–2 Å) and relies on both the strength of a Ca II K-line index and on the height of the peak of the Fourier autocorrelation function of the spectrum, which is a line strength indicator. Both indices are calibrated against the observed so as to remove the temperature dependence. The unrecognized presence of the secondary is unlikely to weaken the spectral lines of the primary very much in this case since the observations cover only the blue portion of the spectrum, where the secondary is fainter. However the reddening in the color, estimated to be 0.04 mag from Figure 8a, may have some effect on [Fe/H]. It is difficult to quantify its effect due to the complexity of the technique used by Beers et al. (1999), but on the basis of their Figure 6 and Figure 9 the bias will be toward lower abundances for both of their metallicity indices, and a correction of dex or more may be appropriate. With this adjustment the value for HD 195987 would be [Fe/H] to .
Finally, the detailed high-resolution () abundance analysis by Fulbright (2000) gives [Fe/H], but also does not account for the presence of the secondary star. The measured equivalent widths and consequently the metal abundances for iron and other elements are thus expected to be slightly underestimated due to light of the secondary filling in the lines of the primary, given that their spectrum was obtained at an orbital phase when the lines were not exactly aligned. The magnitude of the effect may depend on the strength of the lines used in the analysis, and could be as large as 0.1 dex. In addition, Fulbright (2000) adopted an initial estimate of the effective temperature based on the index, which according to Figure 10b leads to an underestimate of 180 K due to the infrared excess. Although their use of iron lines of different strength (to constrain the microturbulence), different excitation potentials (to constrain ), and different ionization stages (to contrain ) should tend to reduce the sensitivity of the results to this problem, the parameter sensitivity experiments in Table 8 by Fulbright (2000) indicate that such an error in can still produce changes in the resulting abundance of 0.07–0.16 dex (depending on whether other parameters are held fixed or allowed to vary to compensate for ). The changes will be in the direction of lower abundances for lower temperatures. The combined effect of these corrections results in a metallicity of [Fe/H] to .
It may seem that many of these adjustments to account for the secondary are rather small and perhaps even within the uncertainties of some of the determinations. Indeed they are, but they are also systematic in nature and known to be present. And because we are trying to understand a systematic difference between the estimates of [Fe/H] and indications from all the models, these biases cannot be ignored, particularly since they often go in the same direction. To summarize the state of the (corrected) metallicity estimates for HD 195987, it appears that both of the photometric determinations result in abundances very near solar, while the three spectroscopic estimates, which should be more reliable, yield [Fe/H] values between and . These are still decidedly lower than the solar value, and so the apparent disagreement with the evolutionary models persists if we give preference to the spectroscopic abundances.
6.3 Detailed abundances for other elements; further model comparisons
The detailed chemical analysis by Fulbright (2000) has revealed certain patterns in HD 195987 that are quite typical in metal-poor stars, and that turn out to be key to understanding the comparison with theoretical isochrones. In particular, it is well known that the abundance of the so-called -elements (O, Ne, Mg, Si, S, Ar, Ca, and Ti) in metal-poor stars is usually enhanced relative to iron when compared to the same ratios in Sun (Conti et al., 1967; Greenstein, 1970). The enhancement, [/Fe], is actually observed to depend on the metallicity as a result of enrichment from Type II and Type Ia supernovae on different timescales throughout the history of the Galaxy (see, e.g., Wheeler, Sneden, & Truran, 1989). The average enhancements for the different -elements increase from the solar values at [Fe/H] to about to dex at [Fe/H] or so, and then they remain approximately constant for more metal-deficient stars. There is even evidence that different stellar populations in the Galaxy are chemically distinct (see, e.g., Edvardsson et al., 1993; Mashonkina & Gehren, 2000; Prochaska et al., 2000). Four of the -elements in HD 195987 have been measured by Fulbright (2000), and have been found to be enhanced. The ratios measured are [Mg/Fe], [Si/Fe], [Ca/Fe], and [Ti/Fe] in the standard logarithmic notation.
A stellar mixture rich in these elements produces an increase in the opacity that affects the structure of a star and changes both the temperature and the luminosity predicted by the models. Compared to model calculations with solar ratios for all elements, -enhancement leads to cooler temperatures and lower luminosities. Therefore, these anomalies must be accounted for if a proper interpretation is to be made of the observations. A number of authors have noted, however, that these effects can be mimicked in models that assume solar ratios by simply increasing the overall metallicity used to compute the tracks (see, e.g., Chieffi, Straniero, & Salaris, 1991; Chaboyer, Sarajedini, & Demarque, 1992; Baraffe et al., 1997; VandenBerg et al., 2000). Prescriptions for how to do this as a function of the -enhancement have been presented by Salaris, Chieffi, & Straniero (1993) and VandenBerg et al. (2000), among others. In the absence of a detailed measurement of the abundance of the -elements for a particular object, average values of [/Fe] have often been adopted in different ranges of [Fe/H]. This carries some risk, however, given that there is considerable scatter in the measured enhancements for different stars at any given [Fe/H] value (Edvardsson et al., 1993; Carney, 1996; Prochaska et al., 2000).
In the case of HD 195987 we have a direct measurement of [/Fe] if we assume that all the -elements follow the trend of Mg, Si, Ca, and Ti, which were the ones actually measured. This is generally observed to be true to first order in metal-poor stars. The average overabundance for the four measured elements is [/Fe]777Because we are dealing in this case with ratios of element abundances, the effect that the secondary component might have on those determinations is not expected to be as significant as in the case of [Fe/H]. Table 8 by Fulbright (2000) indicates that the bias due to temperature errors averaged over Mg, Si, Ca, and Ti (which have different signs for the correlation with ) is 0.03 dex at most, with the sign depending on whether only the temperature is changed or whether other fitted parameters are allowed to vary simultaneously to compensate. Similarly, the continuum from the secondary should have a minimal effect on the abundance ratios.. Following VandenBerg et al. (2000), the overall metallicity adjustment required for this level of [/Fe] is dex. Given the estimates of [Fe/H] in the range to (§6.2), one would then expect that model isochrones computed for a metallicity between and should provide reasonably good fits to the observations. This is in fact quite close to what we find, as shown by the comparisons in §6.1, which suggested an overall composition between solar and .
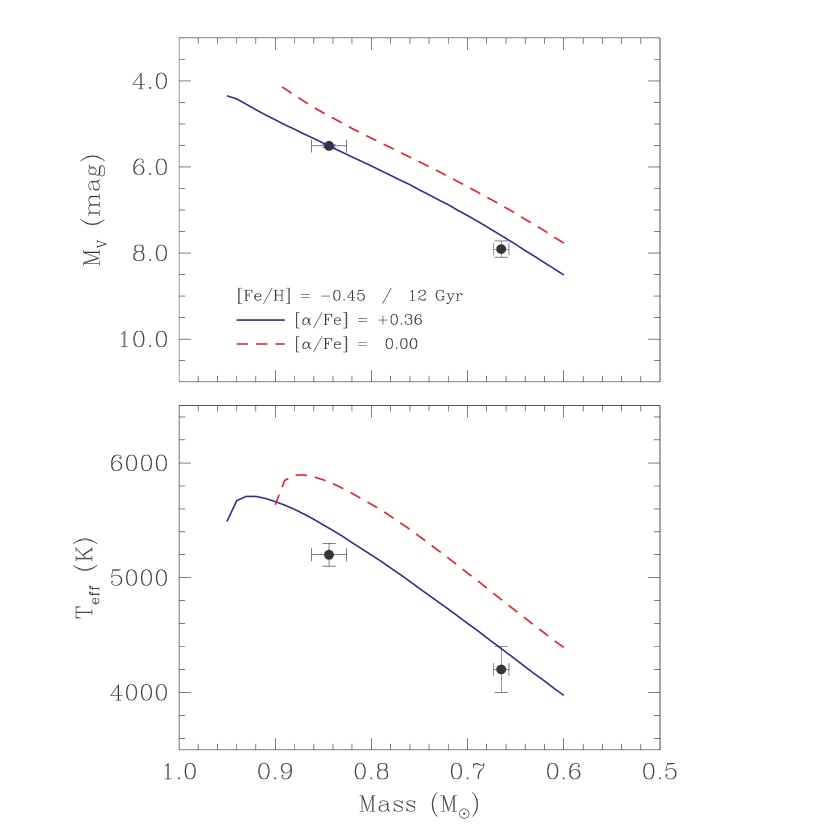
Though adjusting the metallicity of models with scaled-solar mixtures may mimic those with -enhancements to a good approximation, the match is not perfect, as shown by VandenBerg et al. (2000). Isochrones incorporating -enrichment for a range of values of [/Fe] between 0.0 to have recently been published by Bergbusch & VandenBerg (2001). We compare them with the observations for HD 195987 in Figure 11, in the vs. mass and vs. mass diagrams (- and -magnitude predictions are not available in this series of calculations). Because these models use a gray approximation for the boundary conditions between the photosphere and the interior, we do not expect them to reproduce the brightness of the secondary or the temperature of either star very well (see §6.1). Thus we must rely only on the absolute visual magnitude of the primary component for this test.
For a fixed value of [/Fe] the iron abundance that provides the best match is [Fe/H] for an age of 12 Gyr (Figure 11), and [Fe/H] for 10 Gyr. These values are in excellent agreement with the measured abundances by Carney et al. (1994), Beers et al. (1999), and Fulbright (2000), after correcting for the biases due to the secondary as described before. The effect of the -enhancement is illustrated in the figure by the shift between the solid line ([/Fe]) and the dashed line ([/Fe]) for the same metallicity. The uncertainty in the adopted value of [/Fe] (0.12 dex) translates into the same uncertainty for the fitted value of [Fe/H]. The discrepancy for the of the secondary and for the temperatures is in the same direction as shown earlier, i.e., the models are overluminous for a star with the mass of the secondary, and both temperatures are overestimated.
In addition to the -elements, abundance ratios relative to iron were measured by Fulbright (2000) for the light elements Na and Al, the iron-peak elements V, Cr, and Ni, and the heavy elements Ba, Y, and Eu. A comparison with similar measurements for other stars reported by Prochaska et al. (2000) reveals that the pattern of enhancements seen in HD 195987 is very similar to that exhibited by thick disk stars, and is clearly distinct from that of the thin disk stars (see also Fuhrmann, 1998). On that basis one might conclude that HD 195987 belongs to the thick disk population of our Galaxy. This would typically imply a rather old age for the binary, in qualitative agreement with the indications from the models in §6.1. The kinematics of the system computed from the proper motion, the systemic radial velocity, and our orbital parallax (Galactic velocity components , , , relative to the Local Standard of Rest) lend some support to this idea: the velocity is quite consistent with thick disk membership (see Carney, Latham, & Laird, 1989), although the component is not as extreme.
The abundances of Eu and Ba are of particular astrophysical interest. Europium in the solar system is produced mostly by rapid neutron capture (“r-process”), for which the principal formation site is believed to be Type II supernovae. It is one of the few r-process elements with relatively unblended atomic lines present in the visible part of the spectrum, which makes it very useful as an indicator for the r-process history of stellar material. Barium, on the other hand, is predominantly a slow neutron capture (“s-process”) element that is thought to be produced mainly during the thermal pulses of asymptotic giant branch stars. The abundance ratio between Eu and Ba is therefore particularly sensitive to whether nucleosynthesis of heavy elements occured by the s- or r-process, and as such it is a useful diagnostic for studying the chemical evolution of the Galaxy. [Eu/Ba] is observed to increase with metal deficiency, and has also been shown to correlate quite well with age (Woolf, Tomkin, & Lambert, 1995). For HD 195987 Fulbright (2000) measured [Eu/Fe] and [Ba/Fe], so that [Eu/Ba]. Once again this is quite typical of the values for thick disk stars (see Mashonkina & Gehren, 2000). Furthermore, according to the correlation reported in Figure 14 by Woolf, Tomkin, & Lambert (1995) this ratio suggests an age for HD 195987 that is at least 10–12 Gyr, in agreement with indications from the stellar evolution models used here and also consistent with the old age of the thick disk (Carney, Latham, & Laird, 1989).
6.4 The overall agreement with the models
The comparisons in §6.1 and §6.3 indicate that current stellar evolution theory can successfully predict all of the observed characteristics of HD 195987 to high precision for a chemical composition matching what is measured. Unfortunately, however, none of the published models is capable of giving a good fit to all properties of both stars simultaneously. The various isochrones used in this paper do at least agree in predicting an old age for the system, which is also consistent with the pattern of enhancement of the heavy elements, as described above.
The low luminosity of the secondary star in the visual band lends strong support to models that use sophisticated boundary conditions to the interior equations, as in Baraffe et al. (1998), particularly for the lower main sequence. This also appears to be required in order to reproduce the effective temperatures of these stars, but not with a mixing-length parameter as low as in those models. A value of much closer to the one for the Sun (as used in most models except those by Baraffe et al., 1998) seems indicated.
The enhanced levels of the -elements in HD 195987 and in other metal-poor stars cannot be ignored in the models, although their effect can be approximated in standard calculations by increasing the overall metallicity. Note, however, that this approach defeats the true purpose of the model comparisons, which is to test whether theory can reproduce all observed properties at the measured value of [Fe/H]. In the absence of a detailed chemical analysis for metal-poor stars, the constraint on models is considerably weakened because a satisfactory fit can usually be found by leaving the metallicity as a free parameter. The models by Bergbusch & VandenBerg (2001) incorporate the effect of -enhancements, but regretably not the more refined boundary conditions used by Baraffe et al. (1998), which probably explains their failure to reproduce the of the secondary and the effective temperatures of both stars.
The example of HD 195987 emphasizes the importance of detailed spectroscopic analyses as a crucial ingredient for proper comparisons of metal-poor stars with stellar evolution theory. Not only is an accurate determination of [Fe/H] needed, but also abundances for other elements, particularly the -elements that contribute the most to the opacities of these objects. To our knowledge the binary studied in this paper represents the most metal-poor object with such an analysis that has absolute masses determined to 2% or better. HD 195987 is perhaps a favorable case for abundance determinations, however, because the secondary is faint enough that it does not interfere significantly with that analysis. This is seldom the case in double-lined eclipsing binaries that have accurately determined physical properties.
While the tests described in previous sections appear to validate stellar evolution theory, the constraint is actually not as strong as it could be because the absolute radii for the components are not directly measured (but see below). The stellar radius is a very sensitive measure of evolution (age), and the fact that it can be derived by purely geometrical means in binaries that are eclipsing is what makes such systems so valuable. From accurate observations of a number of systems that do eclipse, there is now clear evidence that while current models are quite successful in predicting the radiative properties of stars, they fail to reproduce the radii of stars in the lower main-sequence (see Popper, 1997; Lastennet et al., 1999; Clausen et al., 1999), predicting sizes that are too small. The discrepancy can be as large as 10–20%, as demonstrated recently for YY Gem AB and V818 Tau B by Torres & Ribas (2002). This may have a significant impact on ages inferred from these models.
Incidentally, we note that the absolute radii that we derive in §5 for the components of HD 195987 based on the radiative properties of the system are also somewhat larger than predicted for stars of this mass by all of the models considered here, by roughly 10%. Though more uncertain and possibly not as reliable as the geometric determinations that might be obtained in eclipsing systems, our estimates are consistent with the trend described above.
7 Final remarks
New spectroscopic observations of the nearby moderately metal-poor double-lined spectroscopic binary system HD 195987 ([Fe/H], corrected for binarity), along with interferometric observations that clearly resolve the components for the first time, have allowed us to obtain accurate masses (%), the orbital parallax, and component luminosities in , , and . Both the detailed chemical composition (including the pattern of enhancement of the -elements and heavier elements such as Ba and Eu) and the kinematics suggest that the system is a member of the thick disk population of our Galaxy, and an age of 10–12 Gyr or more (consistent with that conclusion) is inferred based on isochrone fits.
The determination of these stellar properties places useful constraints on stellar evolution theory for the lower main sequence. We have shown that none of the models considered here fits all the properties for both components simultaneously, although the discrepancies in each case can be understood in terms of the physical assumptions (convection prescriptions, boundary conditions, detailed chemical composition). Indications are that a model incorporating all the proper assumptions together (which is not done in any available series of calculations) would allow for a good match to the observations of HD 195987. While this may not be straightforward to do in practice due to the complexity of the problem, it would seem to be an obvious action item for theorists, which would enable observational astronomers to perform more useful tests for stars under 1 M☉. The ingredients identified here as making the most significant difference in the fit for the mass regime of this binary are: (a) the use of non-gray boundary conditions between the photosphere and the interior, based on modern model atmospheres that incorporate molecular opacity sources; (b) a mixing-length parameter close to that required for the Sun; and (c) the inclusion of the effect of enhanced abundances of the -elements.
Though it seems that all the radiative properties of HD 195987 can in principle be predicted accurately from current theory at the observed metallicity and -enhancement, there is no constraint in this particular case on the radius, a key diagnostic of evolution. Evidence cited earlier from other studies indicates that some adjustments are still needed in the models, which tend to underestimate the sizes of low-mass stars.
Further progress on the observational side in testing models for metal-poor stars requires additional candidates suitable for accurate determinations of their physical properties. The recent paper by Goldberg et al. (2002) presents a list of nearly 3 dozen double-lined spectroscopic binaries from a proper motion sample, many of which are metal-deficient. Improvements in the sensitivity of ground-based interferometers in the coming years should allow several of them to be spatially resolved. Eclipsing binary candidates found in globular clusters in a number of recent studies are also valuable, but are fainter and the spectroscopy will be more challenging. In both cases detailed chemical analyses will be very important for a meaningful test of theory, as shown by the system reported here.
References
- Alonso, Arribas, & Martínez-Roger (1996) Alonso, A., Arribas, S., & Martínez-Roger, C. 1996, A&A, 313, 873
- Andersen (1991) Andersen, J. 1991, A&A Rev., 3, 91
- Armstrong et al. (1992) Armstrong, J. T., Hummel, C. A., Quirrenbach, A., Buscher, D. F., Mozurkewich, D., Vivekanand, M., Simon, R. S., Denison, C. S., Johnston, K. J., Pan, X.-P., Shao, M., & Colavita, M. M. 1992, AJ, 104, 2217
- Balega et al. (1999) Balega, I. I., Balega, Y. Y., Maksimov, A. F., Pluzhnik, E. A., Shkhagosheva, Z. U., & Vasyuk, V. A. 1999, A&AS, 140, 287
- Baraffe et al. (1997) Baraffe, I., Chabrier, G., Allard, F., & Hauschildt, P. H. 1997, A&A, 327, 1054
- Baraffe et al. (1998) Baraffe, I., Chabrier, G., Allard, F., & Hauschildt, P. H. 1998, A&A, 337, 403
- Beers et al. (1999) Beers, T. C., Rossi, S., Norris, J. E., Ryan, S. G., & Shefler, T. 1999, AJ, 117, 981
- Bergbusch & VandenBerg (2001) Bergbusch, P. A., & VandenBerg, D. A. 2001, ApJ, 556, 322
- Bessell & Brett (1988) Bessell, M., & Brett, J. 1988, PASP, 100, 1134
- Blackwell & Lynas-Gray (1994) Blackwell, D., & Lynas-Gray, A. 1994, A&A, 282, 899
- Blazit, Bonneau, & Foy (1987) Blazit, A., Bonneau, D., & Foy, R. 1987, A&AS, 71, 57
- Boden et al. (1998) Boden, A. F., Colavita, M. M., van Belle, G. T., & Shao, M. 1998, Proc. SPIE, 3350, 872
- Boden, Creech-Eakman, & Queloz (2000) Boden, A. F., Creech-Eakman, M., & Queloz, D. 2000, ApJ, 536, 880
- Boden et al. (1999a) Boden, A. F., Koresko, C. D., van Belle, G. T., Colavita, M. M., Dumont, P. J., Gubler, J., Kulkarni, S. R., Lane, B. F., Mobley, D., Shao, M., Wallace, J. K., The PTI Collaboration, & Henry, G. W. 1999a, ApJ, 515, 356
- Boden & Lane (2001) Boden, A. F., & Lane, B. F. 2001, ApJ, 547, 1071
- Boden et al. (1999b) Boden, A. F., Lane, B. F., Creech-Eakman, M. J., Colavita, M. M., Dumont, P. J., Gubler, J., Koresko, C. D., Kuchner, M. J., Kulkarni, S. R., Mobley, D. W., Pan, X.-P., Shao, M., van Belle, G. T., Wallace, J. K., & Oppenheimer, B. R. 1999b, ApJ, 527, 360
- Carney (1979) Carney, B. W. 1979, ApJ, 233, 211
- Carney (1983) Carney, B. W. 1983, AJ, 88, 623
- Carney (1996) Carney, B. W. 1996, PASP, 108, 900
- Carney et al. (1987) Carney, B. W., Laird, J. B., Latham, D. W., & Kurucz, R. L. 1987, AJ, 94, 1066
- Carney & Latham (1987) Carney, B. W., & Latham, D. W. 1987, AJ, 92, 116
- Carney, Latham, & Laird (1989) Carney, B. W., Latham, D. W., & Laird, J. B. 1989 AJ, 97, 423
- Carney et al. (1994) Carney, B. W., Latham, D. W., Laird, J. B., & Aguilar, L. A. 1994, AJ, 107, 2240
- Carpenter (2001) Carpenter, J. M. 2001, AJ, 121, 2851
- Chaboyer, Sarajedini, & Demarque (1992) Chaboyer, B., Sarajedini, A., & Demarque, P. 1992, ApJ, 394, 515
- Chabrier & Baraffe (1997) Chabrier, G., & Baraffe, I. 1997, A&A, 327, 1039
- Chieffi, Straniero, & Salaris (1991) Chieffi, A., Straniero, O., & Salaris, M. 1991, in ASP Conf. Ser. 13, The Formation and Evolution of Star Clusters, ed. K. Janes (San Francisco: ASP). 219
- Clausen et al. (1999) Clausen, J. V., Baraffe, I., Claret, A., & VandenBerg, D. B. 1999, in Theory and Tests of Convection in Stellar Structure, ASP Conf. Ser. 173, eds. A. Giménez, E. F. Guinan & B. Montesinos (ASP: San Francisco), 265
- Colavita (1999) Colavita, M. M. 1999, PASP, 111, 111
- Colavita et al. (1999) Colavita, M. M., Wallace, J. K., Hines, B. E., Gursel, Y., Malbet, F., Palmer, D. L., Pan, X.-P., Shao, M., Yu, J. W., Boden, A. F., Dumont, P. J., Gubler, J., Koresko, C. D., Kulkarni, S. R., Lane, B. F., Mobley, D. W., & van Belle, G. T. 1999, ApJ, 510, 505
- Conti et al. (1967) Conti, P. S., Greenstein, J. L., Spinrad, H., Wallerstein, G., & Vardya, M. S., 1967, ApJ, 148, 105
- Delfosse et al. (2000) Delfosse, X., Forveille, T., Ségransan, D., Beuzit, J.-L., Udry, S., Perrier, C., & Mayor, M. 2000, A&A, 364, 217
- Duquennoy & Mayor (1991) Duquennoy, A., & Mayor, M. 1991, A&A, 248, 485
- Edvardsson et al. (1993) Edvardsson, B., Andersen, J., Gustafsson, B., Lambert, D. L., Nissen, P. E., & Tomkin, J. 1993, A&A, 275, 101
- Elias et al. (1983) Elias, J., Frogel, J., Hyland, A., & Jones, T. 1983, AJ, 88, 1027
- Elias et al. (1982) Elias, J., Frogel, J., Matthews, K., & Neugebauer, G. 1982, AJ, 87, 1029
- ESA (1997) ESA 1997, The Hipparcos and Tycho Catalogues, ESA SP-1200
- Fulbright (2000) Fulbright, J. P. 2000, AJ, 120, 1841
- Fuhrmann (1998) Fuhrmann, K. 1998, A&A, 338, 161
- Gehren (1988) Gehren, T. 1988, Reviews in Modern Astronomy 1, ed. G. Klare (Heidelberg: Springer), 52
- Giclas, Burnham, & Thomas (1971) Giclas, H. L., Burnham, R. Jr., & Thomas, N. G. 1971, Lowell Proper Motion Survey, Northern Hemisphere (Flagstaff: Lowell Observatory)
- Giclas, Burnham, & Thomas (1978) Giclas, H. L., Burnham, R. Jr., & Thomas, N. G. 1978, Lowell Obs. Bull. No. 164
- Girardi et al. (2000) Girardi, L., Bressan, A., Bertelli, G., & Chiosi, C. 2000, A&AS, 141, 371
- Goldberg et al. (2002) Goldberg, D., Mazeh, T., Latham, D. W., Stefanik, R. P., Carney, B. W., & Laird, J. B. 2002, AJ, submitted
- Greenstein (1970) Greenstein, J. L. 1970, Comm. Astrophys. Space Sci., 2, 85
- Hummel et al. (1994) Hummel, C. A., Armstrong, J. T., Quirrenbach, A., Buscher, D. F., Mozurkewich, D., Elias, N. S. II, & Wilson, R. E. 1994, AJ, 107, 1859
- Hummel et al. (2001) Hummel, C. A., Carquillat, J.-M., Ginestet, N., Griffin, R. F., Boden, A. F., Hajian, A. R., Mozurkewich, D., & Nordgren, T. E. 2001, AJ, 121, 1623
- Hummel et al. (1998) Hummel, C. A., Mozurkewich, D., Armstrong, J. T., Hajian, A. R., Elias, N. M. II, & Hutter, D. J. 1998, AJ, 116, 2536
- Imbert (1980) Imbert, M. 1980, A&AS, 42, 331
- Kaluzny et al. (2001) Kaluzny, J., Thompson, I. B., Krzeminski, W., Olech, A., Pych, W., & Mochejska, B. 2001, astro-ph/0111089
- Laird, Carney, & Latham (1988) Laird, J. B., Carney, B. W., & Latham, D. W. 1988, AJ, 95, 1843
- Lastennet et al. (1999) Lastennet, E., Valls-Gabaud, D., Lejeune, Th., & Oblak, E. 1999, A&A, 349, 485
- Latham (1992) Latham, D. W. 1992, in IAU Coll. 135, Complementary Approaches to Double and Multiple Star Research, ASP Conf. Ser. 32, eds. H. A. McAlister & W. I. Hartkopf (San Francisco: ASP), 110
- Latham et al. (1988) Latham, D. W., Mazeh, T., Carney, B. W., McCrosky, R. E., Stefanik, R. P., & Davis, R. J. 1988, AJ, 96, 567
- Latham et al. (1996) Latham, D. W., Nordström, B., Andersen, J., Torres, G., Stefanik, R. P., Thaller, M., & Bester, M. 1996, A&A, 314, 864
- Lejeune, Cuisinier, & Buser (1998) Lejeune, Th., Cuisinier, F., & Buser, R. 1998, A&A, 130, 65
- Marsakov & Shevelev (1988) Marsakov, V. A., & Shevelev, Yu. G. 1988, Bull. Inf. CDS, 35, 129
- Martínez-Roger, Arribas, & Alonso (1992) Martínez-Roger, C., Arribas, S., & Alonso, A. 1992, Mem. Soc. Astr. Italiana, 63, 263
- Mashonkina & Gehren (2000) Mashonkina, L., & Gehren, T. 2000, A&A, 364, 249
- Mason et al. (2001a) Mason, B. D., Hartkopf, W. I., Holdenried, E. R., & Rafferty, T. J. 2001a, AJ, 121, 3224
- Mason et al. (2001b) Mason, B. D., Wycoff, G. L., Hartkopf, W. I., Douglass, G. G., & Worley, C. E. 2001b, AJ, 122, 3466
- Mermilliod & Mermilliod (1994) Mermilliod, J.-C., & Mermilliod, M. 1994, Catalogue of Mean UBV Data on Stars, (New York: Springer)
- Mozurkewich et al. (1991) Mozurkewich, D., Johnston, K. J., Simon, R. S., Bowers, P. F., Gaume, R., Hutter, D. J., Colavita, M. M., Shao, M., & Pan, X.-P. 1991, AJ, 101, 2207
- Olsen (1983) Olsen, E. H. 1983, A&AS, 54, 55
- Olsen (1984) Olsen, E. H. 1984, A&AS, 57, 443
- Olsen (1993) Olsen, E. H. 1993, A&AS, 102, 89
- Osborn & Hershey (1999) Osborn, W., & Hershey, J. L. 1999, PASP, 111, 566
- Perryman et al. (1997) Perryman, M. A. C., Lindegren, L., Kovalevsky, J., Hoeg, E., Bastian, U., Bernacca, P. L., Crézé, M., Donati, F., Grenon, M., van Leeuwen, F., van der Marel, H., Mignard, F., Murray, C. A., Le Poole, R. S., Schrijver, H., Turon, C., Arenou, F., Froeschl, M., & Petersen, C. S. 1997, A&A, 323, L49
- Popper (1997) Popper, D. M. 1997, AJ, 114, 1195
- Pourbaix & Jorissen (2000) Pourbaix, D., & Jorissen, A. 2000, A&AS, 145, 161
- Prochaska et al. (2000) Prochaska, J. X., Naumov, S. O., Carney, B. W., McWilliam, A., & Wolfe, A. M. 2000, AJ, 120, 2513
- Salaris, Chieffi, & Straniero (1993) Salaris, M., Chieffi, A., & Straniero, O. 1993, ApJ, 414, 580
- Sandage (1969) Sandage, A. 1969, ApJ, 158, 1115
- Siess, Dufour, & Forestini (2000) Siess, L., Dufour, E., & Forestini, M. 2000, A&A, 358, 593
- Siess, Forestini, & Dougados (1997) Siess, L., Forestini, M., & Dougados, C. 1997, A&A, 324, 556
- Schuster & Nissen (1989) Schuster, W. J., & Nissen, P. E. 1989, A&A, 221, 65
- Skrutskie et al. (1997) Skrutskie M. F., Schneider S. E., Stiening R., Strom S. E., Weinberg M. D., Beichman C., Chester T., Cutri R., Lonsdale C., Elias J., Elston R., Capps R., Carpenter J., Huchra J., Liebert J., Monet D., Price S., & Seitzer P. 1997, in The Impact of Large Scale Near-IR Sky Surveys, eds. F. Garzon et al. (Dordrecht: Kluwer), 25
- Thompson et al. (2001) Thompson, I. B., Kaluzny, J., Pych, W., Burley, G., Krzeminski, W., Paczyński, B., Persson, S. E., & Preston, G. W. 2001, AJ, 121, 3089
- Torres & Ribas (2002) Torres, G., & Ribas, I. 2002, ApJ, 567, 1140
- Udalski et al. (1993) Udalski A., Szymanski M., Kaluzny J., Kubiak M., Krzeminski W., Mateo M., Preston, G. W., & Paczyński B. 1993, Acta Astr. 43, 289
- van Altena, Lee, & Hoffleit (1995) van Altena, W. F., Lee, J. T., & Hoffleit, E. D. 1995, The General Catalogue of Trigonometric Stellar Parallaxes, (4th ed.; New Haven: Yale Univ. Obs.)
- VandenBerg et al. (2000) VandenBerg, D. A., Swenson, F. J., Forrest, J. R., Iglesias, C. A., & Alexander, D. R. 2000, ApJ, 532, 430
- Voelcker (1975) Voelcker, K. 1975, A&AS, 22, 1
- Wheeler, Sneden, & Truran (1989) Wheeler, J. C., Sneden, C., & Truran, J. W. 1989, ARA&A, 27, 279
- Woolf, Tomkin, & Lambert (1995) Woolf, V. M., Tomkin, J., & Lambert, D. L. 1995, ApJ, 453, 660
- Wyse & Gilmore (1995) Wyse, R. F. G., & Gilmore, G. 1995, AJ, 110, 2771
- Yi et al. (2001) Yi, S., Demarque, P., Kim, Y.-C., Lee, Y.-W., Ree, C. H., Lejeune, T., & Barnes, S. 2001, ApJS, 136, 417
- Zucker & Mazeh (1994) Zucker, S., & Mazeh, T. 1994, ApJ, 420, 806

| HJD | RVA | RVB | (OC)A | (OC)B | Orbital |
|---|---|---|---|---|---|
| (2,400,000) | (km s-1) | (km s-1) | (km s-1) | (km s-1) | Phase |
| 45546.727 | 19.53 | 14.51 | 0.08 | 3.08 | 0.6932 |
| 45563.682 | 32.17 | 51.84 | 0.71 | 1.35 | 0.9890 |
| 45623.550 | 30.44 | 52.12 | 0.40 | 0.74 | 0.0334 |
| 45688.410 | 2.07 | 14.98 | 0.02 | 0.93 | 0.1649 |
| 45689.413 | 1.49 | 10.75 | 0.21 | 0.88 | 0.1824 |
| 45694.419 | 13.96 | 5.34 | 0.08 | 0.78 | 0.2697 |
| 45695.426 | 15.67 | 8.57 | 0.22 | 1.66 | 0.2873 |
| 45721.434 | 15.66 | 8.75 | 0.74 | 3.07 | 0.7410 |
| 45742.957 | 12.13 | 32.08 | 0.63 | 2.63 | 0.1165 |
| 45757.909 | 22.44 | 16.21 | 0.11 | 0.84 | 0.3774 |
| 45887.911 | 22.70 | 14.83 | 0.11 | 0.59 | 0.6453 |
| 45896.729 | 7.20 | 4.13 | 0.17 | 0.21 | 0.7991 |
| 45917.758 | 1.72 | 14.66 | 0.15 | 0.97 | 0.1660 |
| 45935.641 | 25.91 | 19.89 | 0.21 | 0.52 | 0.4780 |
| 45945.660 | 22.10 | 13.39 | 0.08 | 1.51 | 0.6527 |
| 45949.647 | 16.94 | 11.16 | 0.06 | 2.99 | 0.7223 |
| 45962.577 | 25.87 | 46.00 | 0.25 | 0.22 | 0.9479 |
| 45981.527 | 14.93 | 5.53 | 0.05 | 0.23 | 0.2785 |
| 46005.529 | 19.54 | 11.15 | 0.41 | 0.12 | 0.6972 |
| 46008.517 | 14.41 | 1.93 | 0.44 | 2.55 | 0.7493 |
| 46215.852 | 22.06 | 13.87 | 0.10 | 0.74 | 0.3663 |
| 46246.856 | 16.19 | 32.33 | 0.08 | 1.38 | 0.9072 |
| 46274.870 | 24.09 | 14.82 | 0.65 | 1.67 | 0.3959 |
| 46310.591 | 31.08 | 53.54 | 0.33 | 0.41 | 0.0191 |
| 46489.937 | 6.06 | 20.05 | 0.42 | 0.37 | 0.1479 |
| 46493.936 | 7.15 | 1.58 | 0.05 | 2.53 | 0.2176 |
| 48199.555 | 29.89 | 50.92 | 0.02 | 0.25 | 0.9728 |
| 51257.899 | 19.04 | 10.90 | 0.30 | 0.39 | 0.3268 |
| 51258.890 | 20.53 | 12.46 | 0.05 | 0.40 | 0.3440 |
| 51260.898 | 22.53 | 13.91 | 0.11 | 1.57 | 0.3791 |
| 51261.884 | 23.54 | 14.28 | 0.09 | 2.23 | 0.3963 |
| 51263.902 | 24.36 | 18.06 | 0.37 | 0.08 | 0.4315 |
| 51264.901 | 25.27 | 18.55 | 0.08 | 0.17 | 0.4489 |
| 51267.884 | 25.59 | 19.63 | 0.30 | 0.02 | 0.5009 |
| 51268.880 | 25.97 | 19.16 | 0.06 | 0.48 | 0.5183 |
| 51269.877 | 25.62 | 18.30 | 0.21 | 1.23 | 0.5357 |
| 51270.870 | 25.37 | 17.62 | 0.26 | 1.66 | 0.5530 |
| 51273.886 | 24.28 | 16.68 | 0.05 | 0.95 | 0.6057 |
| 51274.884 | 23.33 | 16.42 | 0.33 | 0.35 | 0.6231 |
| 51277.857 | 20.64 | 13.07 | 0.15 | 0.07 | 0.6749 |
| 51279.868 | 17.78 | 11.49 | 0.25 | 1.86 | 0.7100 |
| 51293.838 | 26.71 | 47.09 | 0.07 | 0.16 | 0.9537 |
| 51295.873 | 31.48 | 52.45 | 0.00 | 0.76 | 0.9892 |
| 51296.859 | 32.24 | 52.68 | 0.32 | 1.09 | 0.0064 |
| 51297.814 | 31.41 | 51.70 | 0.30 | 1.05 | 0.0231 |
| 51298.869 | 28.23 | 50.08 | 0.70 | 0.10 | 0.0415 |
| 51299.858 | 26.18 | 45.17 | 0.26 | 0.99 | 0.0587 |
| 51300.861 | 22.61 | 40.39 | 0.39 | 1.07 | 0.0762 |
| 51380.600 | 25.37 | 20.08 | 0.18 | 0.91 | 0.4673 |
| 51413.642 | 28.58 | 49.05 | 0.00 | 0.49 | 0.0437 |
| 51424.724 | 10.20 | 0.90 | 0.19 | 0.34 | 0.2371 |
| 51445.726 | 24.67 | 18.91 | 0.26 | 1.18 | 0.6035 |
| 51464.487 | 21.74 | 41.97 | 0.10 | 0.99 | 0.9308 |
| 51466.675 | 29.24 | 51.29 | 0.10 | 0.79 | 0.9689 |
| 51468.667 | 32.45 | 52.45 | 0.51 | 1.35 | 0.0037 |
| 51476.569 | 7.09 | 21.63 | 0.06 | 0.54 | 0.1415 |
| 51521.513 | 20.77 | 42.93 | 0.15 | 3.50 | 0.9256 |
| 51525.510 | 32.26 | 53.03 | 0.48 | 0.57 | 0.9953 |
| 51530.440 | 20.79 | 42.20 | 0.28 | 2.20 | 0.0813 |
| 51618.884 | 23.54 | 18.30 | 0.06 | 1.60 | 0.6243 |
| 51640.847 | 31.85 | 53.88 | 0.06 | 0.12 | 0.0074 |
| 51667.839 | 25.55 | 18.42 | 0.16 | 0.95 | 0.4783 |
| 51682.802 | 14.67 | 10.21 | 0.44 | 4.29 | 0.7393 |
| 51699.727 | 29.26 | 51.44 | 0.63 | 0.24 | 0.0346 |
| 51712.696 | 12.89 | 4.55 | 0.13 | 1.28 | 0.2609 |
| 51788.531 | 24.41 | 18.05 | 0.59 | 0.43 | 0.5838 |
| 51808.604 | 22.50 | 42.91 | 0.10 | 0.97 | 0.9340 |
| 51815.609 | 26.25 | 47.50 | 0.16 | 0.73 | 0.0562 |
| 51842.553 | 26.18 | 17.75 | 0.29 | 1.85 | 0.5263 |
| 51866.503 | 24.55 | 46.12 | 0.28 | 1.34 | 0.9441 |
| 51874.448 | 20.28 | 39.25 | 0.47 | 0.35 | 0.0827 |
| 51921.441 | 14.54 | 33.52 | 0.39 | 1.31 | 0.9025 |
| 52004.892 | 21.96 | 13.64 | 0.47 | 0.38 | 0.3583 |
| Element | This paper | Imbert (1980) | Latham et al. (1988) | Duquennoy & Mayor (1991) | Goldberg et al. (2002) |
|---|---|---|---|---|---|
| Adjusted quantities | |||||
| (days) | 57.32161 0.00034 | 57.3210 0.0014 | 57.325 0.009 | 57.3240 0.0013 | 57.3199 0.0065 |
| (km s-1) | 0.038 | 0.075 | 0.12 | 0.07 | 5.59 0.12 |
| (km s-1) | 28.944 0.046 | 28.80 0.12 | 28.89 0.20 | 28.73 0.10 | 29.16 0.19 |
| (km s-1) | 36.73 0.21 | 34.6 1.2 | |||
| 0.3103 0.0018 | 0.305 0.003 | 0.316 0.006 | 0.306 0.003 | 0.3083 0.0060 | |
| (deg) | 357.03 0.35 | 356.8 0.7 | 355.9 0.8 | 356.8 0.7 | 357.1 1.1 |
| (HJD2,400,000)aaThe time of periastron passage in the four solutions from the literature has been shifted by an integer number of cycles to the epoch derived in this paper, for comparison purposes. | 49404.825 0.045 | 49404.6 0.1 | 49404.8 0.3 | 49404.933 0.097 | 49404.78 0.16 |
| Derived quantities | |||||
| (M☉) | 0.122 0.002 | 0.1225 0.0026 | 0.1219 0.0017 | ||
| (M☉) | 0.808 0.010 | 0.721 0.052 | |||
| (M☉) | 0.6369 0.0046 | 0.607 0.024 | |||
| 0.7881 0.0047 | 0.84 0.03 | ||||
| (106 km) | 21.689 0.036 | 21.6 0.1 | 21.65 0.16 | 21.57 0.10 | |
| (106 km) | 27.52 0.16 | ||||
| (R☉) | 70.70 0.24 | 68.7 1.3 | |||
| Other quantities pertaining to the fit | |||||
| 7373 | 60 | 31 | 64 | 2828 | |
| Time span (days) | 6458 | 758 | 1003 | 4365 | 2653 |
| (km s-1)bbRoot mean square residual from the fit. | 0.30 | 0.54 | 0.68 | 0.54 | 0.63 |
| (km s-1)bbRoot mean square residual from the fit. | 1.38 | 4.51 | |||
| aaAngular separation from HD 195987. | Adopted Model DiameterbbThe angular diameters were determined from effective temperature and bolometric flux estimates based on archival broad-band photometry, and visibility measurements with PTI. | ||||
|---|---|---|---|---|---|
| Object Name | Spectral Type | (mag) | (mag) | () | (mas) |
| HD 195194 | G8 III | 7.0 | 4.8 | 2.7 | 0.67 0.10 |
| HD 200031 | G5 III | 6.8 | 4.7 | 6.0 | 0.56 0.05 |
| HD 177196 | A7 V | 5.0 | 4.5 | 17 | 0.62 0.10 |
| HD 185395 | F4 V | 4.5 | 3.5 | 17 | 0.84 0.08 |
| HJD | Orbital | |||||
|---|---|---|---|---|---|---|
| (2,400,000) | (OC) | () | () | Phase | ||
| 51745.813 | 0.322 | 0.135 | 0.123 | 30.683 | 57.824 | 0.8386 |
| 51745.815 | 0.407 | 0.127 | 0.050 | 30.198 | 58.251 | 0.8386 |
| 51745.827 | 0.639 | 0.259 | 0.123 | 27.951 | 59.560 | 0.8388 |
| 51745.828 | 0.608 | 0.174 | 0.083 | 27.624 | 59.703 | 0.8389 |
| 51745.894 | 1.051 | 0.339 | 0.166 | 12.316 | 65.245 | 0.8400 |
| 51745.901 | 0.920 | 0.272 | 0.006 | 10.291 | 65.561 | 0.8401 |
| 51745.941 | 1.025 | 0.414 | 0.067 | 0.135 | 66.600 | 0.8408 |
| 52103.920 | 0.743 | 0.231 | 0.015 | 44.026 | 26.884 | 0.0859 |
| 52103.922 | 0.740 | 0.031 | 0.019 | 43.768 | 27.217 | 0.0859 |
| 52103.946 | 1.054 | 0.341 | 0.080 | 39.373 | 31.461 | 0.0864 |
| 52175.716 | 0.584 | 0.037 | 0.001 | 45.253 | 25.448 | 0.3384 |
| 52175.719 | 0.638 | 0.025 | 0.048 | 44.871 | 25.984 | 0.3385 |
| 52175.729 | 0.911 | 0.084 | 0.039 | 43.101 | 27.937 | 0.3386 |
| 52175.740 | 0.956 | 0.050 | 0.123 | 41.183 | 29.784 | 0.3388 |
| 52175.742 | 0.846 | 0.047 | 0.073 | 40.779 | 30.131 | 0.3389 |
| 52175.775 | 0.481 | 0.038 | 0.014 | 33.720 | 35.322 | 0.3394 |
| 52175.777 | 0.499 | 0.033 | 0.077 | 33.055 | 35.692 | 0.3395 |
| 52175.788 | 0.854 | 0.101 | 0.004 | 30.364 | 37.135 | 0.3397 |
| 52175.799 | 0.905 | 0.094 | 0.029 | 27.430 | 38.497 | 0.3399 |
| 52177.609 | 0.980 | 0.063 | 0.049 | 50.012 | 4.245 | 0.3714 |
| 52177.616 | 0.977 | 0.088 | 0.032 | 50.413 | 5.798 | 0.3716 |
| 52177.662 | 0.789 | 0.066 | 0.034 | 49.975 | 15.690 | 0.3724 |
| 52177.671 | 0.977 | 0.132 | 0.008 | 49.397 | 17.432 | 0.3725 |
| 52177.710 | 0.534 | 0.106 | 0.072 | 45.059 | 25.216 | 0.3732 |
| 52177.712 | 0.662 | 0.086 | 0.109 | 44.757 | 25.646 | 0.3732 |
| 52177.730 | 0.944 | 0.194 | 0.012 | 41.940 | 28.921 | 0.3735 |
| 52177.738 | 0.651 | 0.139 | 0.025 | 40.397 | 30.397 | 0.3737 |
| 52177.740 | 0.643 | 0.089 | 0.045 | 39.995 | 30.719 | 0.3737 |
| 52179.617 | 0.972 | 0.059 | 0.028 | 50.720 | 7.199 | 0.4065 |
| 52179.625 | 0.978 | 0.061 | 0.075 | 50.815 | 8.877 | 0.4066 |
| 52179.662 | 0.692 | 0.072 | 0.045 | 49.836 | 16.701 | 0.4072 |
| 52179.669 | 0.942 | 0.082 | 0.019 | 49.322 | 18.258 | 0.4074 |
| 52179.704 | 0.373 | 0.059 | 0.027 | 45.322 | 25.308 | 0.4080 |
| 52179.706 | 0.446 | 0.027 | 0.036 | 45.064 | 25.641 | 0.4080 |
| 52179.713 | 0.802 | 0.077 | 0.061 | 43.940 | 27.019 | 0.4081 |
| 52179.731 | 0.736 | 0.068 | 0.029 | 40.884 | 30.179 | 0.4085 |
| 52179.739 | 0.415 | 0.058 | 0.026 | 39.393 | 31.485 | 0.4086 |
| HJD | Orbital | |||||
|---|---|---|---|---|---|---|
| (2,400,000) | (OC) | () | () | Phase | ||
| 51353.925 | 0.749 | 0.042 | 0.021 | 16.722 | 46.365 | 0.0020 |
| 51353.949 | 0.945 | 0.044 | 0.015 | 12.573 | 47.823 | 0.0024 |
| 51353.974 | 0.792 | 0.040 | 0.034 | 7.839 | 48.933 | 0.0028 |
| 51353.996 | 0.572 | 0.036 | 0.032 | 3.398 | 49.354 | 0.0032 |
| 51354.912 | 0.360 | 0.035 | 0.048 | 18.491 | 45.828 | 0.0192 |
| 51354.935 | 0.723 | 0.070 | 0.023 | 14.629 | 47.393 | 0.0196 |
| 51354.958 | 0.892 | 0.100 | 0.039 | 10.290 | 48.625 | 0.0200 |
| 51354.999 | 0.667 | 0.069 | 0.016 | 2.352 | 49.666 | 0.0207 |
| 51355.888 | 0.331 | 0.020 | 0.017 | 22.144 | 44.552 | 0.0362 |
| 51355.935 | 0.531 | 0.027 | 0.015 | 14.339 | 48.212 | 0.0370 |
| 51356.918 | 0.290 | 0.027 | 0.005 | 16.691 | 46.600 | 0.0542 |
| 51356.962 | 0.400 | 0.040 | 0.006 | 8.602 | 48.910 | 0.0549 |
| 51356.985 | 0.674 | 0.053 | 0.009 | 3.942 | 49.566 | 0.0553 |
| 51360.887 | 0.693 | 0.044 | 0.010 | 19.901 | 45.257 | 0.1234 |
| 51360.937 | 0.331 | 0.021 | 0.016 | 11.361 | 48.578 | 0.1243 |
| 51360.938 | 0.312 | 0.010 | 0.005 | 11.031 | 48.563 | 0.1243 |
| 51375.901 | 0.369 | 0.059 | 0.031 | 10.375 | 48.550 | 0.3853 |
| 51385.791 | 0.340 | 0.025 | 0.067 | 24.229 | 43.148 | 0.5579 |
| 51385.833 | 0.628 | 0.021 | 0.025 | 17.894 | 46.942 | 0.5586 |
| 51386.788 | 0.265 | 0.015 | 0.035 | 24.378 | 43.274 | 0.5753 |
| 51386.815 | 0.860 | 0.031 | 0.000 | 20.403 | 45.756 | 0.5757 |
| 51386.848 | 0.420 | 0.021 | 0.029 | 14.703 | 48.179 | 0.5763 |
| 51399.766 | 0.427 | 0.016 | 0.021 | 22.243 | 43.927 | 0.8017 |
| 51399.802 | 0.181 | 0.022 | 0.026 | 16.355 | 46.763 | 0.8023 |
| 51399.843 | 0.350 | 0.022 | 0.012 | 8.860 | 49.032 | 0.8030 |
| 51401.762 | 0.689 | 0.040 | 0.042 | 21.834 | 43.935 | 0.8365 |
| 51401.803 | 0.914 | 0.037 | 0.020 | 15.229 | 47.152 | 0.8372 |
| 51401.841 | 0.980 | 0.043 | 0.004 | 8.129 | 49.167 | 0.8379 |
| 51415.769 | 0.873 | 0.037 | 0.044 | 14.464 | 47.350 | 0.0809 |
| 51415.789 | 0.766 | 0.051 | 0.025 | 10.851 | 48.303 | 0.0812 |
| 51416.744 | 0.511 | 0.032 | 0.095 | 18.247 | 45.574 | 0.0979 |
| 51416.772 | 0.795 | 0.052 | 0.068 | 13.292 | 47.424 | 0.0984 |
| 51472.637 | 0.386 | 0.088 | 0.024 | 10.119 | 48.863 | 0.0729 |
| 51694.947 | 0.269 | 0.024 | 0.023 | 23.303 | 42.350 | 0.9512 |
| 51694.962 | 0.246 | 0.026 | 0.015 | 21.226 | 43.806 | 0.9515 |
| 51694.973 | 0.299 | 0.032 | 0.016 | 19.566 | 44.658 | 0.9517 |
| 51694.992 | 0.456 | 0.068 | 0.011 | 16.527 | 46.106 | 0.9520 |
| 51695.002 | 0.766 | 0.073 | 0.182 | 14.756 | 46.764 | 0.9522 |
| 51707.915 | 0.581 | 0.074 | 0.134 | 22.996 | 42.913 | 0.1774 |
| 51707.929 | 0.469 | 0.066 | 0.009 | 20.956 | 44.202 | 0.1777 |
| 51707.956 | 0.632 | 0.080 | 0.162 | 16.666 | 46.282 | 0.1782 |
| 51707.971 | 0.415 | 0.082 | 0.052 | 14.123 | 47.192 | 0.1784 |
| 51707.975 | 0.483 | 0.143 | 0.015 | 13.324 | 47.500 | 0.1785 |
| 51707.989 | 0.430 | 0.142 | 0.030 | 10.823 | 48.181 | 0.1787 |
| 51707.992 | 0.493 | 0.118 | 0.039 | 10.127 | 48.263 | 0.1788 |
| 51708.003 | 0.525 | 0.136 | 0.080 | 8.120 | 48.712 | 0.1790 |
| 51716.888 | 0.276 | 0.045 | 0.046 | 23.348 | 42.595 | 0.3340 |
| 51716.898 | 0.286 | 0.029 | 0.020 | 21.859 | 43.446 | 0.3342 |
| 51716.953 | 1.015 | 0.075 | 0.135 | 12.895 | 47.520 | 0.3351 |
| 51716.963 | 0.935 | 0.101 | 0.078 | 11.014 | 48.043 | 0.3353 |
| 51716.990 | 0.565 | 0.059 | 0.052 | 5.850 | 48.819 | 0.3358 |
| 51717.001 | 0.570 | 0.065 | 0.065 | 3.743 | 49.051 | 0.3359 |
| 51723.876 | 0.874 | 0.067 | 0.025 | 22.044 | 42.796 | 0.4559 |
| 51723.890 | 0.873 | 0.075 | 0.044 | 20.086 | 43.970 | 0.4561 |
| 51723.919 | 0.284 | 0.046 | 0.044 | 15.387 | 46.184 | 0.4566 |
| 51723.933 | 0.426 | 0.061 | 0.024 | 12.929 | 46.946 | 0.4569 |
| 51723.949 | 0.715 | 0.066 | 0.045 | 9.883 | 47.728 | 0.4572 |
| 51723.963 | 0.866 | 0.080 | 0.055 | 7.236 | 48.294 | 0.4574 |
| 51723.974 | 0.822 | 0.224 | 0.014 | 5.106 | 48.406 | 0.4576 |
| 51723.988 | 0.686 | 0.089 | 0.001 | 2.333 | 48.729 | 0.4579 |
| 51723.996 | 0.710 | 0.227 | 0.105 | 0.918 | 48.809 | 0.4580 |
| 51741.797 | 0.976 | 0.055 | 0.048 | 36.915 | 2.364 | 0.7685 |
| 51741.804 | 0.735 | 0.090 | 0.153 | 37.236 | 3.540 | 0.7687 |
| 51741.902 | 0.397 | 0.019 | 0.024 | 33.607 | 18.647 | 0.7704 |
| 51741.909 | 0.559 | 0.036 | 0.019 | 32.877 | 19.660 | 0.7705 |
| 51741.944 | 1.082 | 0.038 | 0.094 | 28.023 | 24.126 | 0.7711 |
| 51741.951 | 1.042 | 0.041 | 0.066 | 26.960 | 24.913 | 0.7712 |
| 51744.796 | 0.254 | 0.024 | 0.011 | 37.043 | 3.596 | 0.8209 |
| 51744.803 | 0.235 | 0.032 | 0.021 | 37.251 | 4.670 | 0.8210 |
| 51744.851 | 0.200 | 0.035 | 0.003 | 36.705 | 12.146 | 0.8218 |
| 51744.858 | 0.191 | 0.020 | 0.013 | 36.328 | 13.234 | 0.8219 |
| 51744.928 | 0.484 | 0.047 | 0.024 | 29.065 | 23.065 | 0.8232 |
| 51744.935 | 0.542 | 0.077 | 0.023 | 28.034 | 23.957 | 0.8233 |
| 51746.822 | 0.206 | 0.045 | 0.000 | 21.122 | 44.293 | 0.8562 |
| 51746.824 | 0.226 | 0.049 | 0.019 | 20.782 | 44.390 | 0.8562 |
| 51746.836 | 0.253 | 0.044 | 0.042 | 19.017 | 45.391 | 0.8564 |
| 51746.839 | 0.287 | 0.086 | 0.076 | 18.522 | 45.707 | 0.8565 |
| 51746.893 | 0.301 | 0.023 | 0.047 | 8.869 | 48.761 | 0.8574 |
| 51746.895 | 0.300 | 0.099 | 0.043 | 8.427 | 48.856 | 0.8575 |
| 51752.793 | 0.460 | 0.032 | 0.008 | 37.534 | 6.427 | 0.9604 |
| 51752.799 | 0.596 | 0.040 | 0.017 | 37.575 | 7.511 | 0.9605 |
| 51752.806 | 0.701 | 0.058 | 0.007 | 37.545 | 8.587 | 0.9606 |
| 51752.829 | 0.955 | 0.075 | 0.015 | 36.897 | 12.119 | 0.9610 |
| 51752.835 | 0.999 | 0.082 | 0.011 | 36.571 | 13.156 | 0.9611 |
| 51752.842 | 0.944 | 0.066 | 0.024 | 36.237 | 14.146 | 0.9612 |
| 51752.872 | 0.468 | 0.048 | 0.040 | 33.585 | 18.607 | 0.9617 |
| 51791.675 | 0.927 | 0.084 | 0.007 | 24.303 | 41.631 | 0.6387 |
| 51791.683 | 0.925 | 0.068 | 0.082 | 23.256 | 42.516 | 0.6388 |
| 51794.671 | 0.282 | 0.050 | 0.019 | 23.622 | 41.847 | 0.6909 |
| 51794.714 | 0.995 | 0.096 | 0.064 | 17.173 | 45.574 | 0.6917 |
| 51794.780 | 0.420 | 0.051 | 0.047 | 5.164 | 48.662 | 0.6928 |
| 51831.634 | 0.981 | 0.282 | 0.117 | 13.669 | 47.076 | 0.3358 |
| 51831.644 | 0.957 | 0.364 | 0.077 | 11.832 | 47.527 | 0.3359 |
| 51832.645 | 0.618 | 0.038 | 0.016 | 11.295 | 48.013 | 0.3534 |
| 51832.655 | 0.513 | 0.057 | 0.026 | 9.402 | 48.524 | 0.3536 |
| 51832.687 | 0.327 | 0.032 | 0.006 | 3.219 | 49.407 | 0.3541 |
| 51832.703 | 0.388 | 0.051 | 0.017 | 0.028 | 49.456 | 0.3544 |
| 51832.741 | 0.613 | 0.079 | 0.006 | 7.522 | 48.791 | 0.3551 |
| 51832.749 | 0.747 | 0.185 | 0.080 | 9.092 | 48.683 | 0.3552 |
| 51833.587 | 0.779 | 0.073 | 0.054 | 20.747 | 44.399 | 0.3698 |
| 51833.594 | 0.797 | 0.076 | 0.030 | 19.686 | 44.961 | 0.3700 |
| 51833.628 | 0.542 | 0.064 | 0.062 | 13.791 | 47.277 | 0.3706 |
| 51833.636 | 0.370 | 0.090 | 0.100 | 12.457 | 47.827 | 0.3707 |
| 51833.671 | 0.404 | 0.065 | 0.020 | 5.797 | 49.071 | 0.3713 |
| 51833.678 | 0.456 | 0.055 | 0.005 | 4.458 | 49.294 | 0.3714 |
| 51833.713 | 0.875 | 0.229 | 0.136 | 2.534 | 49.312 | 0.3720 |
| 51833.720 | 0.959 | 0.244 | 0.184 | 3.949 | 49.290 | 0.3722 |
| 51850.576 | 0.299 | 0.206 | 0.092 | 35.890 | 14.261 | 0.6662 |
| 51850.587 | 0.333 | 0.143 | 0.066 | 35.123 | 16.014 | 0.6664 |
| 51850.589 | 0.774 | 0.457 | 0.331 | 34.953 | 16.216 | 0.6664 |
| 51850.627 | 0.842 | 0.286 | 0.130 | 30.666 | 21.528 | 0.6671 |
| 51850.636 | 0.425 | 0.144 | 0.020 | 29.413 | 22.756 | 0.6673 |
| 51851.630 | 0.586 | 0.128 | 0.095 | 29.867 | 22.233 | 0.6846 |
| 51851.632 | 0.588 | 0.039 | 0.025 | 29.662 | 22.568 | 0.6846 |
| 52120.799 | 0.244 | 0.015 | 0.020 | 37.790 | 8.720 | 0.3804 |
| 52120.806 | 0.435 | 0.028 | 0.017 | 37.598 | 9.746 | 0.3805 |
| 52120.821 | 0.933 | 0.039 | 0.063 | 37.127 | 12.097 | 0.3807 |
| 52120.827 | 1.037 | 0.034 | 0.058 | 36.800 | 13.153 | 0.3809 |
| 52120.850 | 0.517 | 0.030 | 0.009 | 35.175 | 16.534 | 0.3812 |
| 52154.730 | 0.700 | 0.112 | 0.016 | 17.204 | 46.179 | 0.9723 |
| 52154.753 | 1.056 | 0.075 | 0.153 | 13.188 | 47.569 | 0.9727 |
| 52154.776 | 1.025 | 0.099 | 0.114 | 8.897 | 48.621 | 0.9731 |
| 52156.711 | 0.447 | 0.017 | 0.023 | 19.236 | 44.927 | 0.0069 |
| 52156.741 | 0.924 | 0.032 | 0.086 | 14.316 | 46.944 | 0.0074 |
| 52156.767 | 0.949 | 0.025 | 0.030 | 9.421 | 48.279 | 0.0078 |
| 52156.788 | 0.715 | 0.025 | 0.046 | 5.397 | 48.945 | 0.0082 |
| 52180.651 | 0.373 | 0.026 | 0.017 | 37.374 | 11.148 | 0.4245 |
| 52180.658 | 0.657 | 0.027 | 0.021 | 37.059 | 12.252 | 0.4246 |
| 52180.671 | 1.034 | 0.036 | 0.052 | 36.298 | 14.354 | 0.4249 |
| 52180.678 | 0.955 | 0.031 | 0.013 | 35.826 | 15.419 | 0.4250 |
| 52180.692 | 0.458 | 0.034 | 0.028 | 34.620 | 17.493 | 0.4252 |
| 52180.699 | 0.280 | 0.018 | 0.007 | 33.960 | 18.397 | 0.4253 |
| 52180.713 | 0.310 | 0.017 | 0.004 | 32.398 | 20.408 | 0.4256 |
| 52180.720 | 0.543 | 0.021 | 0.018 | 31.499 | 21.269 | 0.4257 |
| Parameter | HIPPARCOSaaThe elements , , , and in this solution were adopted from Duquennoy & Mayor (1991) and held fixed. | Only | RV Only | Full Fit |
|---|---|---|---|---|
| Adjusted quantities | ||||
| (days) | 57.3240 | 57.3298 0.0035 | 57.32161 0.00034 | 57.32178 0.00029 |
| (mas)bbFor the HIPPARCOS solution this is the semimajor axis of the photocenter () rather than the relative semimajor axis. | 5.24 0.66 | 15.368 0.028 | 15.378 0.027 | |
| () | 5.867 0.038 | 5.841 0.037 | ||
| () | 28.944 0.046 | 28.929 0.046 | ||
| () | 36.73 0.21 | 36.72 0.21 | ||
| 0.3060 | 0.30740 0.00067 | 0.3103 0.0018 | 0.30626 0.00057 | |
| (deg) | 89.50 8.43 | 99.379 0.088 | 99.364 0.080 | |
| (deg) | 356.8 | 358.89 0.53 | 357.03 0.35 | 357.40 0.29 |
| (deg)ccPosition angle of the ascending node, i.e., the node at which the secondary is receding. | 327.66 7.56 | 335.061 0.082 | 334.960 0.070 | |
| (HJD2,400,000) | 43327.589ddThis value listed in the HIPPARCOS catalog is erroneous; it should be 43328.589 (cf. Duquennoy & Mayor 1991). | 51354.000 0.069 | 49404.825 0.045 | 51353.813 0.038 |
| (mag) | 1.063 0.031 | 1.056 0.013 | ||
| (mag) | 1.18 0.16 | 1.154 0.065 | ||
| Derived quantities | ||||
| (mas)eeThe determination from the HIPPARCOS data is our revised value (see §4), and the full-fit determination is the orbital parallax. | 45.30 0.46 | 46.08 0.27 | ||
| Other quantities pertaining to the fit | ||||
| (RV) | 7373 | 7373 | ||
| () | 37134 | 37134 | ||
| (/)ffRoot mean square residual from the fit. | 0.0599 / 0.0613 | 0.0592 / 0.0617 | ||
| (A/B, km s-1)ffRoot mean square residual from the fit. | 0.30 / 1.38 | 0.31 / 1.41 | ||
| Parameter | Primary | Secondary |
|---|---|---|
| Mass (M☉) | 0.844 0.018 | 0.6650 0.0079 |
| (K) | 5200 100 | 4200 200 |
| (mas) | 46.08 0.27 | |
| Dist (pc) | 21.70 0.13 | |
| (mag) | 5.511 0.028 | 7.91 0.19 |
| aaIn the CIT system. (mag) | 3.679 0.037 | 4.835 0.059 |
| aaIn the CIT system. (mag) | 3.646 0.033 | 4.702 0.034 |
| aaIn the CIT system. (mag) | 1.865 0.039 | 3.21 0.19 |