Variations of the TeV energy spectrum at different flux levels of Mkn 421 observed with the HEGRA system of Cherenkov telescopes
The nearby BL Lacertae (BL Lac) object Markarian 421 (Mkn~421) at a red shift was observed to undergo strong TeV -ray outbursts in the observational periods from December 1999 until May 2001. The time averaged flux level in the 1999/2000 season was ph cm-2 s-1, whereas in the 2000/2001 season the average integral flux increased to ph cm-2 s-1. Both energy spectra are curved and well fit by a power law with an exponential cut-off energy at TeV. The respective energy spectra averaged over each of the two time periods indicate a spectral hardening for the 2000/2001 spectrum. The photon index changes from for 1999/2000 to in 2000/2001. The energy spectra derived for different average flux levels ranging from 0.5 to 10 ph cm-2 s-1 follow a clear correlation of photon index and flux level. Generally, the energy spectra are harder for high flux levels. From January to April 2001 Mkn 421 showed rapid variability (doubling time as short as minutes), accompanied with a spectral hardening with increasing flux level within individual nights. For two successive nights (MJD 51989-51991, March 21-23,2001), this correlation of spectral hardness and change in flux has been observed within a few hours. The cut-off energy for the Mkn 421 TeV spectrum remains within the errors constant for the different flux levels and differs by TeV from the value determined for Mkn 501. This indicates that the observed exponential cut-off in the energy spectrum of Mkn 421 is not solely caused by absorption of multi-TeV photons by pair-production processes with photons of the extragalactic near/mid infrared background radiation.
Key Words.:
Gamma rays: observations — BL Lacertae objects: individual: Mkn 421 –D.Horns, Dieter.Horns@mpi-hd.mpg.de
1 Introduction
The nearby BL Lac object Mkn 421 () was the first extra-galactic source of very-high energy gamma-ray emission detected (Punch et al., 1992). The source was monitored closely with the HEGRA imaging Cherenkov telescopes (Konopelko et al., 1999) during the observational periods from 1997-1998 while the source remained in a low flux state with an average flux level of a third of the flux observed from the Crab-Nebula and a power law energy spectrum with a photon index of (Aharonian et al., 1999b). It is well known that the source exhibits time variability on a sub-hour timescale at TeV-energies (Gaidos et al., 1996), which constrains the size of the emission region () and indicates a relativistic bulk motion of the emitting plasma with a Doppler factor at an angle to the line of sight to avoid severe internal absorption (Celotti et al., 1998).
The observed variations of the source in the optical and radio energy region have been found to correlate only marginally with the TeV flux (Nied et al., 2001; Jordan et al., 2001). However, the X-ray activity shows good correlation with the TeV flux level. During the observational periods December 1999 until May 2001, extended multi-wavelength observation campaigns were conducted by X-ray satellites (RXTE, BeppoSAX) and TeV observatories (HEGRA, CAT and VERITAS collaborations). During coordinated simultaneous observations in January/February 2001 with RXTE, Mkn 421 showed a soft X-ray spectrum consistent with a peak position of the synchrotron spectrum below keV. The X-ray flux integrated between 2-10 keV reached a value of erg/(cm2 s) on January 31, 2001 (Horns et al., 2001) where Mkn 421 showed also a high TeV flux level. This is the highest X-ray state for Mkn 421 reported during a pointed observation. Interpretation of the broadband spectral energy distribution (SED) in the framework of synchrotron-self-Compton models is discussed in Sect. 5.
The TeV energy spectrum of Mkn 421 has been measured by several instruments (HEGRA, Whipple, CAT) at different flux levels of the source (Aharonian et al., 1999b; Krennrich et al., 1999, 2001; Piron et al., 2001). The observed spectral shape shows tentative indications for variations and a possible correlation with the overall flux level. However, since the instruments have largely different energy thresholds and systematic uncertainties, a firm claim of spectral variations of the TeV emission from Mkn 421 could so far not be made. For Mkn 501, observations of a spectral hardening during the 1997 outbursts in TeV emission have been claimed (Djannati-Ataı et al., 1999), but could not be verified by other experiments (Aharonian et al., 2001b). The TeV-spectrum of Mkn 501 softened during the subsequent years following the strong outburst while the mean flux has decreased by a factor of 10 to of the flux observed from the Crab-Nebula (Aharonian et al., 2001b).
Mkn 421 exhibited strong activity from January to May 2001 (Börst et al., 2001) with a peak diurnal flux level on March 23/24, 2001 (MJD 51991.9-51992.2) with a value of ph cm-2 s-1above 1 TeV corresponding to times the flux of the Crab-Nebula. Only 6 days before reaching the peak flux, the diurnal flux had been as low as ph cm-2 s-1, a factor of 25 lower.
We report on observations of Mkn 421 carried out with the HEGRA system of 5 imaging air Cherenkov telescopes. Sects. 3.1 & 3.2 contain the results on flux and spectral shape of Mkn 421 during the observational periods from December 1999 until May 2001. We show clear evidence for variations of the spectral shape of a TeV -ray source, getting harder with increased flux level (Sect. 3.3). Intranight flux and spectral variations are evident in at least two nights of observations (Sects. 3.4 & 3.5). The difference between cut-off energies present in the TeV spectra of Mkn 421 and Mkn 501 is discussed in Sect. 9
| Date | Year | Obs.Time | |
|---|---|---|---|
| December 3-11 | 1999 | 4.8 | 17.8 |
| January 31-February 15 | 2000 | 58.4 | 20.9 |
| March 3-March 12 | 2000 | 17.9 | 13.2 |
| March 24-March 29 | 2000 | 28.4 | 19.8 |
| April 23-May 5 | 2000 | 21.6 | 17.1 |
| November 24-December 6 | 2000 | 20.8 | 30.5 |
| December 28 | 2000 | 2.0 | 16.4 |
| January 17-February 5 | 2001 | 94.2 | 21.2 |
| February 13-February 28 | 2001 | 63.2 | 20.5 |
| March 17-March 31 | 2001 | 51.6 | 17.8 |
| April 14-April 26 | 2001 | 8.1 | 20.6 |
| May 9- May 23 | 2001 | 14.9 | 20.7 |
| Total | 385.9 | 20.3 |
2 Data selection and analyses


| Period | 111 | |||||
| TeV | ||||||
| Fixed | ||||||
| Dec 1999-May 2000 | 131.1 | 3.6 | ||||
| Nov 2000-May 2001 | 254.8 | 3.6 | ||||
| 222 | 42.9 | 3.6 | ||||
| 77.4 | 3.6 | |||||
| 54.1 | 3.6 | |||||
| 129.4 | 3.6 | |||||
| 17.8 | 3.6 | |||||
| MJD51964/51965 | 3.6 | 3.6 | ||||
| MJD51991/51992 | 4.1 | 3.6 | ||||
| no cut-off | ||||||
| Dec 1999-May 2000 | ||||||
| Nov 2000-May 2001 | ||||||
| MJD51989/51990,preflare | 1.9 | |||||
| MJD51989/51990,flare | 1.1 | |||||
| MJD51990/51991,preflare | 1.5 | |||||
| MJD51990/51991,flare | 1.0 | |||||

The data used here were collected from December 1999 until May 2001 and comprises in total 385.9 hours of observations under stable weather conditions, good atmospheric transparency and good detector performance (see Table 1 for a breakdown of the observation time for individual months). Data taken up to zenith angles of are used which constitute more than 95 % of the data taken in total.
Based upon comparing the observed rate with the expected cosmic ray event rate, individual
runs were rejected if the relative deviation from the expectation exceeds 20 %. In total 35 hrs of data fail to pass this selection.
A large
fraction of data were taken with a 5-telescope setup. However, in January 2000
and April 2001, only 4 telescopes were operating. The collection areas for the spectral
analysis of data taken with a 4 or 5 telescope setup are calculated
separately to take the difference in acceptance between the two setups into account. Additionally, the
degrading mirror reflectivity and the
conversion factors relating the registered digitised Cherenkov amplitude values in the cameras to the
number of photoelectrons detected have been determined for monthly observational
periods and are applied to the Monte-Carlo simulation to calculate the collection areas for
each period separately.
All observations were carried out in the so-called wobble-mode. During wobble-mode observations the source direction is positioned shifted in declination with respect to the centre of the field of view of the camera. This observation mode allows for simultaneous estimate of the background (OFF) rate induced by charged cosmic rays. The analysis uses an extended OFF-region to reduce the statistical error on the background estimate. A ring segment ( opening angle), from to distance from the camera centre at the opposite side of the ON region has been chosen. The events suitable for spectral analysis are selected in a similar way as described in Aharonian et al. (1999b), applying only loose cuts on the image shape and the shower direction in order to minimise systematic effects from energy dependent cut efficiencies. The loose directional and shape cuts accept events with the reconstructed direction being within an angular distance of to the source and the image shape parameter mean scaled width . 80 % of the registered -events pass both the directional and the shape cut. To ensure that the images are not truncated because of the limited field of view, images with a to the centre of the camera are rejected. At the same time the reconstructed core position is required to be within 200 m distance to the central telescope. The energy reconstruction requires two images with more than 40 photoelectrons after applying a two-stage tail-cut removing night sky background contamination of the image. The angle subtended between the major axes of at least two of the registered images is required to be larger than . The number of excess events after applying all selection criteria used in this analysis amounts to 40 000, constituting the largest photon sample collected from a single source with the HEGRA telescopes.
2.1 Spectral analysis method
The energy reconstruction and the reconstruction of energy spectra have been described in detail elsewhere (Aharonian et al., 1999a). For a large part of the data, contemporaneous observations of the Crab-Nebula333The Crab-Nebula is frequently used as a standard candle for TeV astronomy are available, allowing to compare and to verify the expectation for detection rates and cut-efficiencies for -induced air showers derived from Monte-Carlo simulations with data.
In the possible presence of a deviation from a pure power law in the form of an exponential cut-off, the reconstruction of the spectral shape beyond this cut-off is influenced by the energy resolution. Even with an event-by-event energy reconstruction accuracy of as achieved with the stereoscopic reconstruction technique of air showers, a considerable fraction of events with overestimated energies contribute to the flux of neighbouring bins.
This becomes increasingly important for energies well in excess of the cut-off energy. Different methods like deconvolution using suitable algorithms and forward-folding techniques are applicable and have been pursued. An advanced energy reconstruction technique with an improved energy resolution of (Hofmann et al., 2000) has been proven to show similar results as obtained with the analysis technique used here (Aharonian et al., 2001a). However, the results presented here are obtained with the conventional energy reconstruction method being less sensitive to changes in the detector performance and therefore less susceptible to systematic errors.
The influence of the energy resolution has been absorbed in the collection area , indicating the zenith angle. The method applied here follows the same approach as described in Aharonian et al. (1999a), using a collection area being a function of the reconstructed energy . The collection area therefore depends upon the spectral shape assumed. An iterative method is applied to test a spectral hypothesis on the data. The procedure starts with an assumed arbitrary spectral shape. For the sake of simplicity, a Crab-like power law spectrum with a photon index of is assumed. If the reconstructed spectrum shows deviations from this shape, a new hypothesis can be tested by using a different spectral shape to derive the collection area and following the same procedure once more. The process is iterative and usually converges after two iterations.
The method has been carefully checked with simulated energy spectra and also against other methods and has proven to be less dependent upon the exact modelling of the detector response with Monte-Carlo methods than more sophisticated procedures as mentioned above.
2.2 Systematic uncertainties
The systematic errors include as most important contributions the uncertainties in the conversion factors used to calculate the number of photo-electrons from the digitised pulses of the photo multiplier tubes, non-linearities of the electronic chain and the conservatively estimated variations of the response of the telescopes in the threshold region. Additionally, the uncertainties in the spectral shape enter the calculation of the collection area and cause an additional systematic uncertainty especially at energies well above the exponential cut-off energy.
Besides the mentioned uncertainties, the overall flux determination is subject to a uncertainty in the calibration of the absolute energy scale of the telescopes. This uncertainty only affects the absolute flux calibration and does not influence the reconstructed shape of the spectrum. The stability of the calibration of the energy scale has been carefully tested with data taken on the Crab-Nebula constraining possible time dependent effects seen as variations on the reconstructed flux to be less than % which translates into less than % uncertainty on changes of the energy scale (assuming a power law energy spectrum with a photon index of ). A more in-depth discussion of the systematic errors is given in Aharonian et al. (1999a).
3 Results


3.1 Light curve
The observed integral flux above an energy of 1 TeV for individual nights is shown in Fig. 1. In the year 2000, the highest diurnal flux level reached ph cm-2 s-1(MJD 51662/51663). Note the smooth increase and decrease of the flux level in the course of a few days observed from MJD 51659 until MJD 51665 (May 2000). The flux averaged from December 1999 to May 2000 is ph cm-2 s-1. In the observational period from November 2000 until May 2001 the average flux and the amplitude of variations increased. The maximum diurnally averaged flux was observed in MJD 51991/51992 (March 23/24 2002) with ph cm-2 s-1(see also Sect. 3.5). The time averaged flux for the 2000/2001 measurements is ph cm-2 s-1, which corresponds to 2.4 times the flux of the Crab-Nebula (the integral flux above 1 TeV observed from the Crab-Nebula is ph cm-2 s-1(Aharonian et al., 2000)).
3.2 Time averaged energy spectra
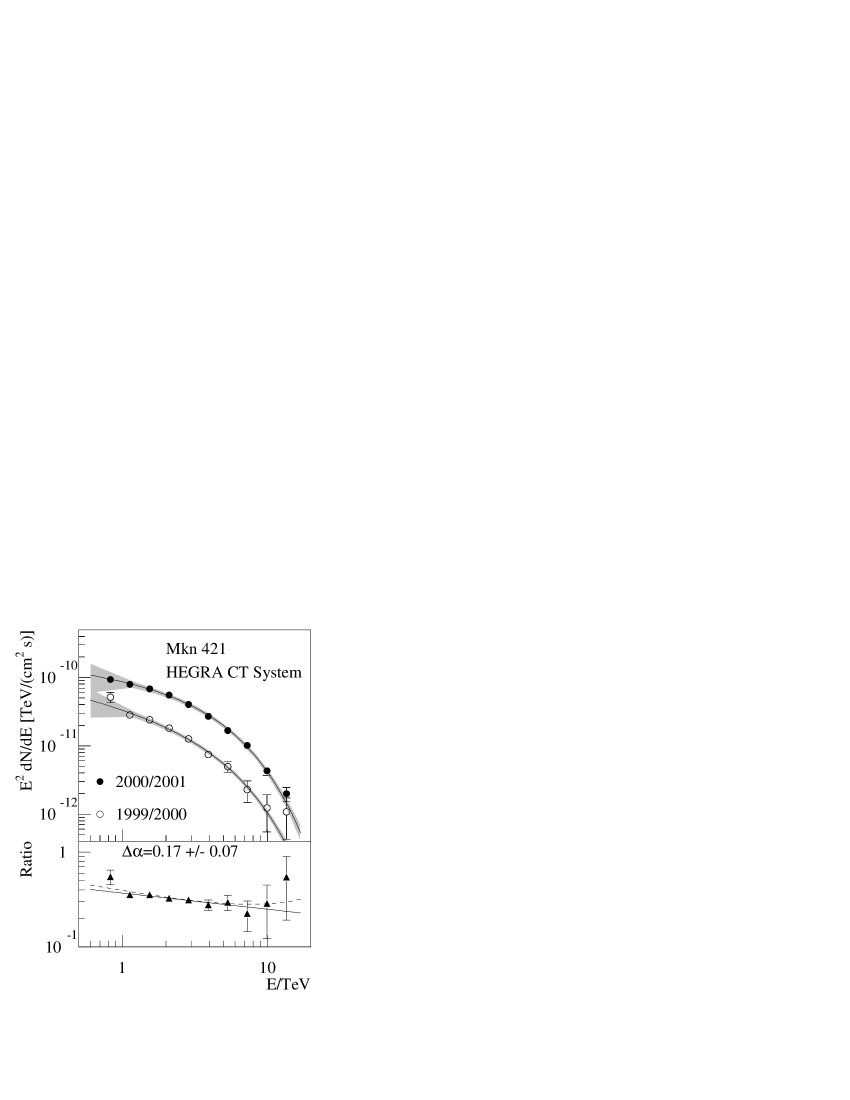
The observational periods 1999/2000 and 2000/2001 are treated separately for two reasons: The average flux level and the amplitude of variability is largely different for the two seasons (see Fig. 1). Secondly, the two measurements are separated by one year and allow to investigate secular changes by comparing the energy spectra for the two observational seasons
A fit of a power law function to the energy spectrum derived from the observations in the years 1999/2000 results in ph cm-2 s-1 TeV-1, with . This makes a power law fit seem unlikely given a probability of for a larger -value. The soft spectral shape is consistent with previous measurements (Aharonian et al., 1999b). A fit of a power law with an exponential cut-off
| (1) |
results in a fit to the data with ph cm-2 s-1 TeV-1, , TeV and . The large statistical error on the position of the cut-off is a result of the strong correlation of the two parameters () used to characterise the spectral shape.
The energy spectrum derived from observations in the period from November 2000 until May 2001 with a substantially larger number of photons and therefore reduced statistical fluctuation is not consistent with a pure power law function ( with 8 degrees of freedom). A fit of a power law function with an exponential cut-off results in a smaller -value of with 7 degrees of freedom and , , TeV. Table 2 shows the individual results on the power law fit and fitting a power law with an exponential cut-off to different time periods and flux levels.
The energy spectra derived individually from the two observational periods are presented in Fig. 2. The differential flux is multiplied by to emphasise the subtle differences between the two spectra444This corresponds to : 1 TeV/(cm2 s)1.6 erg/(cm2 s).. Provided that the exponential cut-off is at the same energy for both years ( TeV), the ratio of the two spectra should follow a power law. The lower panel of Fig. 2 shows the ratio of the two energy spectra. Systematic effects that apply to both data sets in a similar manner cancel out for the ratio of the two spectra. As indicated with a solid line in the lower panel of Fig. 2, a power law fit is a good description of the ratio. The photon indices differ by indicating a trend for the spectrum to become harder at a higher flux level (see also Sect. 3.3) . The dashed curve is the result of a fit with an exponential as expected for different cut-off energies:
| (2) | |||||
The result of a -fit to (see Fig. 3) results in a difference TeV-1 ( TeV) which is consistent with the two cut-off energies being identical.
3.3 Correlation of flux and photon index
To investigate possible correlations of the flux level and the spectral shape, the data have been split in five flux intervals as indicated in Table 2. The energy spectra for three of the flux bins (labelled Low, Medium, and High) are shown in Fig. 3. The different flux levels show different spectral slopes. The ratio of the energy spectra is again well-described by a power law indicating that the cut-off energy for the different flux levels remains constant within the statistical error, whereas the photon index changes by for the ratio of the H and M. For an average flux of (Low), the spectrum softens such that the spectral index changes by with respect to H.
The general trend of hardening of the energy spectrum with increased flux is shown in Fig. 4 where the photon index is shown as a function of integral flux above 1 TeV. To parameterise the dependence of photon index and flux, a function of the form
with represents the data points quite well. A simpler functional dependence of the form
is compatible with the data with a (indicated by the dashed curve in Fig. 4). A -fit of a constant value is excluded by a very large .
It is interesting to note that the energy spectrum of Mkn 421 observed during 1997 and 1998 (Aharonian et al., 1999b) fits nicely in this picture when applying the same fitting method to the archival data keeping the cut-off energy fixed at TeV (see Fig. 4). This data-point has been excluded from the fitting of the functional dependence of the photon index.
3.4 Diurnal flux variations

Intra-night variations of the flux are seen during a large fraction of the observational nights. In the past, doubling times as short as 15 minutes have been observed (Gaidos et al., 1996). To quantify the rise and decay times of flares, a simple profile consisting of two exponentials with a constant background is fit to the light curves:
| (5) |
An example of a night with a fast decay time (March 21/22 2001, MJD 51989.93-51990.14) is shown in Fig. 5a. The exponential decay time as given by the result of a -fit of a function (Eqn. 5) to the light-curve results in min, whereas the rise time turns out to be min. This result is indicating an asymmetry of the light curve during a flare. However, the presence of a possible sub-structure in the light curve (at 1:00 UTC) which is not resolved could be responsible for an overestimated rise time. The night with the fastest rise time (March 22/23 2001, MJD 51990.925-51991.12) of the data set shows a smooth increase of the flux by a factor of 5 within 3 hours (see Fig. 5b). Fitting again a function to the light-curve results in hr. This translates into a doubling time of minutes. The decaying part of the light curve shows indications for a decay time of hr. However, a fit of a Gaussian function with a constant background (dashed line in Fig 5b) describes the data equally well and would increase the estimated doubling time to min.
Another example of a diurnal light curve is shown in Fig. 6 (February 24/25 2001). The light curve of this night is well described by a simple exponential decay with hrs similar to the decay time seen in the night March 23/24 2001 (see Fig. 5b). It is conceivable that the observed light curve in this particular night covers the end of a flare for which the first part was not visible for HEGRA. Another peculiarity of this night is the small and constant hardness ratio indicating a soft spectrum at a comparably high flux level (see also next Sect.).


3.5 Diurnal spectral variations
Even with the large number of photons detected, the sensitivity for intra-night spectral changes is limited. In a few cases, the observational time and the number of detected -rays is sufficient to perform spectroscopy on time scales of hours. A particular set of flares already mentioned in the previous Sect. occurred during the night MJD 51989.9-51990.2 (March 21/22 2001) (see Fig. 5a) and the subsequent night MJD 51990.9-51991.2 (March 22/23 2001) (see Fig. 5b). The light curves show in both cases a rising flux with a doubling time of less than 1 hr. At the end of the flare, the flux smoothly decreased. During the rising time of the flux, the hardness ratios exhibit in both cases a spectral hardening, well correlated with the increase of flux and a spectral softening at the end of the flare. For the night March 21/22 the hardness ratio as well as the flux level return after the flare to the initial state it had prior to the flare. For the night March 22/23, the spectrum softens to the level it had before the flare, whereas the flux remains at a high level at a factor of 3 higher than before the flare.
To gain further information on the spectral shape for the individual nights with indications for spectral variations, energy spectra were extracted for two time intervals (indicated by the vertical lines in Fig 5a-b) from each night. The time intervals were chosen to cover the preflare and the flare state. For both flares, the preflare energy spectrum is well described by a power law with a photon index of , and a hardening by during the flare (see Fig. 7a-b).
However, light curves with flux variations have been observed that are not accompanied by spectral variations. An example of a night with a varying flux and a constant spectral shape is given in Fig. 8a, where the energy spectra for two time intervals from the night MJD 51964/51965 have been extracted (marked by vertical lines in Fig. 6). The spectrum is despite the large flux ( ph cm-2 s-1) comparably soft with a photon index of for the first half of the night and for the second half of the night.
It is also interesting to note after comparing individual nights, that the spectral shape does not always relate directly to the absolute flux-level. As an example, Fig. 8b displays the spectrum of the night with the highest diurnal flux (MJD 51991/51992) with a level only 20 % higher than the night February 24/25 discussed earlier. During this night, no strong indication for flux variability or changes in the hardness ratio are evident. The energy spectrum is hard with a photon index of (Fig. 8b). The ratio of the two spectra indicate a difference of .
4 Mkn 501 and Mkn 421 cut-off energies

In the presence of extragalactic background light (EBL) at wavelengths of m, TeV-energy photons are subject to absorption by pair-production processes with the low energy background photons (Gould & Schréder, 1966; Stecker et al., 1992). As a result, the observed spectrum of extragalactic TeV sources is modified. A very likely feature in the observed spectrum is an exponential cut-off. However, the presence of a cut-off in the observed spectra could also be caused by processes related to the production of TeV photons (e.g. decrease of the Compton-scattering cross-section for large centre-of-momentum energies, absorption inherent to the source). In the simplest picture of a source spectrum that follows a power law, the position of the cut-off should be identical for all sources at the same red-shift provided that the EBL is isotropical.
The two well-established extragalactic sources of TeV-radiation (Mkn 421 & Mkn 501) happen to almost coincide in red shift, which makes an investigation of differences in the position of the cut-off energies meaningful.
In Fig. 9 the energy spectrum of Mkn 501 as measured during 1997 with a cut-off energy of TeV and the energy spectrum derived from observations of Mkn 421 in 2000/2001 are compared. The upper panel contains the differential energy spectra multiplied by together with the respective fit functions indicated as solid lines. The dashed curve is the result of a fit of a power law with a fixed exponential cut-off at TeV to the Mkn 421 data points. Ignoring possible systematic errors, the resulting excludes TeV as a cut-off energy for the Mkn 421 spectrum. The lower panel of Fig. 9 shows the ratio of the two energy spectra. A pure power law fit to the data is very unlikely because of a large whereas a function as defined in Eqn. 2 results in a acceptable with and TeV-1. We note that constraining the fit region to energies above TeV where absorption starts to become important, a pure power law fit is not excluded any more for the ratio.
There is an overlap of the cut-off energies determined for Mkn 421 ( TeV) and Mkn 501 ( TeV) (Aharonian et al., 1999a) taking the combined systematic and statistical errors into account. However, the origin of the systematic errors are very similar for both results and therefore strongly correlated. As mentioned in Sect. 2.2, a 6 % systematic uncertainty on the relative energy scale remains when comparing the two energy spectra. Combining the independent statistical uncertainty and the estimated systematic uncertainty on the relative energy scale results in TeV for the difference on the energy of the cut-off position. A detailed investigation of possible differences of energy spectra will be the issue of a forthcoming paper.
5 Multi-wavelength observations
The flux increase observed from Mkn 421 in the TeV energy band has been accompanied by a strongly increased X-ray flux. Detailed studies of the correlation of the variability in both energy bands are under-way. The simultaneously taken data from January/February 2001 with RXTE and HEGRA (Horns et al., 2001) reveal a largely different spectral evolution for Mkn 421 in the X-ray and TeV being almost opposite to what has been observed from Mkn 501: Whereas the shape of the TeV-spectrum of Mkn 501 remained constant during the 1997 activity period (Aharonian et al., 1999a), the Mkn 421 spectrum showed a spectral hardening with increasing flux. A different spectral evolution is also seen in the X-ray spectrum for the two sources: Whereas the X-ray spectrum of Mkn 501 is very hard during the flare which is commonly interpreted as a shift of the synchrotron peak position from below 1 keV to 100 keV and back (Tavecchio et al., 2001), the X-ray spectrum of Mkn 421 remains soft with a moderate shift of the synchrotron peak from below 1 keV at a flux level of erg/(cm2 s) (Malizia et al., 2000) to keV on January 31,2001 when the flux measured between 2-10 keV reached erg/(cm2 s) (Horns et al., 2001). These observations confirm the energy dependence of the peak-position claimed to follow a power law behaviour with for Mkn 421. For Mkn 501 the relation of the peak position and flux follows underlining the very different behaviour of the two extreme BL Lac objects (Fossati et al., 2000).
The TeV data of Mkn 421 taken simultaneously with the X-ray observations in January/February 2001 indicate a hard spectrum with a photon index that deviate substantially from the quiescent energy spectrum being much softer (). The constraints on a one-zone SSC model of the source derived from these multi-wavelength observations are severe. The X-ray spectrum with a peak-energy keV constrains the electron-spectrum which is responsible for the synchrotron peak emission to have a low energy (). As a result, without invoking large and a small magnetic field, the SSC model predicts a peak energy for the Compton-scattered spectrum below 1 TeV and the spectral shape is expected to be soft in the energy region from 1-20 TeV because of the Klein-Nishina suppression of the Compton-scattering cross-section. However, the observed TeV-spectra are very hard and a small magnetic field G and a large Doppler-factor are required to achieve an adequate fit of the TeV data with a SSC-model (see e.g. Krawczynski et al. (2001)). The absorption of TeV photons due to pair production with photons of the extragalactic radiation field adds to the difficulties, because the source spectra corrected for the absorption are intrinsically harder than the observed spectra which are not easily described with a simple SSC-one-zone model (see e.g. Aharonian (2001)).
6 Summary and conclusions
The observations of Mkn 421 at TeV-energies indicate significant spectral variations for different flux levels. The photon index changes from to with a flux increasing from . Diurnal flux variations have been observed with rise and decay times as short as min. During particular nights where a complete flare was observed, the photon index determined during the preflare and the flare period differ by as much as getting harder while the flux increases. All energy spectra are well-fit by a power law with an exponential cut-off at TeV without indications for variations of the cut-off energy at different flux-levels. However, the sensitivity on changes of the cut-off energy is limited by strong correlations between the two parameters (,) used to describe the energy spectra. A comparison of for Mkn 501 and Mkn 421 indicates that the position of the cut-off energy for Mkn 501 is larger by TeV taking the combined systematic and statistical error into account. A difference of the cut-off energies for two sources at similar red shift precludes the possibility of the cut-off being only an absorption feature.
Acknowledgements.
The support of the German ministry for research and technology (BMBF) and of the Spanish Research Council (CICYT) is gratefully acknowledged. GR acknowledges receipt of a Humboldt fellowship. We thank the Instituto de Astrofísica de Canarias for the use of the site and for supplying excellent working conditions at La Palma.References
- Aharonian et al. (1999a) Aharonian, F. A. et al. 1999a, A&A, 349, 11
- Aharonian et al. (1999b) Aharonian, F. A. et al. 1999b, A&A, 350, 757
- Aharonian et al. (2000) Aharonian, F. A. et al. 2000, ApJ, 539, 317
- Aharonian et al. (2001a) Aharonian, F. A. et al. 2001a, A&A, 366, 62
- Aharonian et al. (2001b) Aharonian, F. et al. 2001b, ApJ, 546, 898
- Aharonian (2001) Aharonian, F. A. 2001, in Proc. of the 27th ICRC, Hamburg, (astro-ph/0112314).
- Börst et al. (2001) Börst, H. G., Götting, N., & Remillard, R. 2001, IAU Circ., 7568, 3
- Celotti et al. (1998) Celotti, A., Fabian, A. C., & Rees, M. J. 1998, MNRAS, 293, 239
- Djannati-Ataı et al. (1999) Djannati-Ataı , A. et al. 1999, A&A, 350, 17
- Fossati et al. (2000) Fossati, G. et al. 2000, ApJ, 541, 166
- Gaidos et al. (1996) Gaidos, J. A. et al. 1996, Nature, 383, 319
- Gould & Schréder (1966) Gould, J. & Schréder, G. 1966, Phys. Rev. Lett.16, 252
- Konopelko et al. (1999) Konopelko, A. et al. 1999, Astroparticle Physics, 10, 275
- Hofmann et al. (2000) Hofmann, W. Lampeitl, H., Konopelko, A., Krawczynski, H. 2000, Astroparticle Physics, 12, 207
- Hofmann et al. (1999) Hofmann, W., Jung, I., Konopelko, A., Krawczynski, H., Lampeitl, H., & Pühlhofer, G. 1999, Astroparticle Physics, 12, 135
- Horns et al. (2001) Horns, D., Kohnle, Remillard, R.A. et al. 2001, in Proc. of the 27th ICRC, Hamburg, 106ff.
- Krennrich et al. (1999) Krennrich, F. et al. 1999, ApJ, 511, 149
- Krennrich et al. (2001) Krennrich, F. et al. 2001, ApJ, 560, L45
- Krawczynski et al. (2000) Krawczynski, H., Coppi, P. S., Maccarone, T., & Aharonian, F. A. 2000, A&A, 353, 97
- Krawczynski et al. (2001) Krawczynski, H. et al. 2001, ApJ, 559, 187
- Jordan et al. (2001) Jordan, M. et al. 2001, in Proc. of the 27th ICRC, Hamburg, 2851ff..
- Malizia et al. (2000) Malizia, A. et al. 2000, MNRAS, 312, 123
- Nied et al. (2001) Nied, P. M. et al. 2001, American Astronomical Society Meeting, 199, 9817
- Piron et al. (2001) Piron, F. et al. 2001, A&A, 374, 895
- Punch et al. (1992) Punch, M. et al. 1992, Nature, 358, 477
- Stecker et al. (1992) Stecker, F.W., De Jager, O.C., Salamon, M.H. 1992, ApJ, 390, L49
- Tavecchio et al. (2001) Tavecchio, F. et al. 2001, ApJ, 554, 725