Discovery of the host galaxy of HDF850.1, the brightest sub–mm source in the Hubble Deep Field
Abstract
Despite extensive observational efforts, the brightest sub–mm source in the Hubble Deep Field, HDF850.1, has failed to yield a convincing optical/infrared identification almost 4 years after its discovery. This failure is all the more notable given the availability of supporting multi-frequency data of unparalleled depth, and sub-arcsec positional accuracy for the sub-mm/mm source. Consequently, HDF850.1 has become a test case of the possibility that the most violently star-forming objects in the universe are too red and/or distant to be seen in the deepest optical images.
Here we report the discovery of the host galaxy of HDF850.1. This object has been revealed by careful analysis of a new, deep image of the HDF obtained with the Subaru 8.2-m telescope. Its reality is confirmed by a similar analysis of the HST NICMOS F160W image of the same region. This object is extremely faint (), clumpy (on sub-arcsec scales) and very red (; ). The likelihood that it is the correct identification is strongly reinforced by a reanalysis of the combined MERLIN+VLA 1.4-GHz map of the field which provides a new radio detection of HDF850.1 only 0.1 arcsec from the new near-infrared counterpart, and with sufficient positional accuracy to exclude all previously considered alternative optical candidates.
We have calculated new confidence limits on the estimated redshift of HDF850.1 in the light of the new radio detection, and find . We have also determined the scale-length, and hence estimated the mass of the apparently nearby (0.5 arcsec distant) elliptical galaxy 3-586.0. From this we calculate that the flux density of HDF850.1 has been boosted by a factor of through gravitational lensing by this intervening elliptical, consistent with predictions that a small but significant fraction of blank-field sub-mm sources are lensed by foreground galaxies. We discuss the wider implications of these results for the sub-mm population and cosmic star-formation history.
keywords:
cosmology: observations – galaxies: evolution – galaxies: formation – galaxies: starburst – infrared: galaxies1 Introduction
HDF850.1 was the first sub–mm source discovered via unbiased, blank-field surveys at 850 , its presence becoming apparent only hr into the hr SCUBA imaging observation of the Hubble Deep Field (HDF) undertaken by Hughes et al. (1998). It was also the first SCUBA-selected source to be detected in continuum emission through mm-wavelength interferometry, with a further hr of observations, this time with the IRAM PdB interferometer, yielding its position to an accuracy of arcsec (Downes et al. 1999). Frustratingly, however, despite this accurate position and the obvious availability of optical data of unparalleled depth and resolution, a convincing host galaxy for this bright sub-mm source has not yet been identified. Indeed, the difficulty experienced in finding an optical counterpart for HDF850.1 has even motivated some authors to explore the possibility that some of the sub-mm sources uncovered via high galactic latitude SCUBA surveys are actually galactic objects (Lawrence 2001).
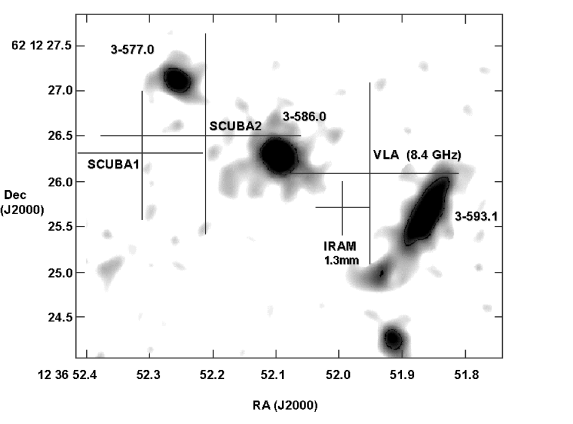
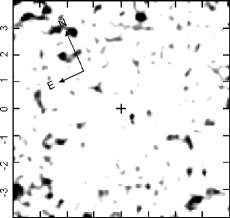
It is important to note, however, that even though the search radius permitted by the IRAM PdB results is small, this identification failure is not due to a lack of potential optical counterparts (see Fig. 1). Indeed, both Hughes et al. (1998) and Downes et al. (1999) noted that the galaxy 3-586.0, one of the most obviously red objects in the three-colour image of the HDF, is not only consistent with the mm/sub-mm position of HDF850.1, but is statistically rather unlikely to lie so close to the sub-mm/mm source by chance (, because 3-586.0 is relatively bright). However, both Hughes et al. and Downes et al. rejected the possibility that this apparently favourable statistical association necessarily implies that 3-586.0 is the correct optical identification. This is because, while optical–near-infrared photometry of 3-586.0 strongly indicates it is a passively evolving elliptical at (Fernández-Soto et al. 1999; Rowan-Robinson 2001), existing sub-mm radio detections and limits yield an estimated redshift for the 850 source of , and appear to exclude (e.g. Carilli & Yun 1999, 2000; Dunne et al. 2000). Furthermore, as argued by Downes et al., it is not expected that such a quiescent elliptical should be a strong emitter of sub-mm radiation.
Consequently, HDF850.1 has become the classic test case of the extent to which the technique of estimating redshifts from sub-mm radio photometry can be trusted, and indeed of the whole idea that many/most bright sub-mm sources lie at high redshift ().
Given the apparent unsuitability of 3-586.0, the two remaining potential high-redshift objects in the vicinity of HDF850.1 have both been considered as potential identifications. First, Hughes et al. tentatively suggested 3-577.0 as the correct identification because, while statistically quite likely to lie close to the sub-mm position by chance (), it appeared to be the only candidate within the SCUBA search radius with an estimated redshift in the appropriate range (; Fernández-Soto et al. 1999; Rowan-Robinson 2001, and a tentative spectroscopic redshift of ; Zepf et al. 1997). Subsequently, the improved IRAM PdB position excluded this object as a possible counterpart, and Downes et al. concluded in favour of 3-593.1. However, the relatively modest estimated redshift of this source (; Fernández-Soto et al. 1999; Rowan-Robinson 2001) means that this option also appears unconvincing.
One might reasonably ask why the correct identification for HDF850.1 has proved so elusive, given that several other comparably bright sub-mm sources have been discovered and unambiguously identified in the intervening years (e.g. Smail et al. 1999, Ivison et al. 1998, 2000, Gear et al. 2000, Frayer et al. 2000, Lutz et al. 2001). The most likely explanation is that HDF850.1 simply lies at a more extreme redshift than these identified sources. The strongest hint of this comes from the fact that these now identified SCUBA sources have been detected in the radio at , whereas HDF850.1 has evaded radio detection at the level of (3-).
The radio investigation of HDF850.1 was temporarily confused by the suggestion of Richards (1999) that the sub-mm source should be associated with the radio source VLA 3651+1221, some 6 arcsec south-west of the SCUBA position. This possibility was excluded shortly thereafter by the IRAM PdB detection. However, this diversion does at least serve to emphasize the dangers of making the (initially understandable) assumption that every SCUBA source can be reliably associated with a VLA source provided one is found within a fairly generous search radius (e.g. Barger et al. 2000), and confirms that any redshift distribution for the sub-mm population deduced from such SCUBA+VLA associations should be regarded as conservative (as noted by Smail et al. 2000). In fact, to date the most promising radio counterpart of HDF850.1 is VLA 3651+1226, listed in the supplementary list of sources provided by Richards et al. (1998) as a 2.3- detection at 8.4 GHz. Subsequent re-analysis of these data has raised the significance of this detection to over 3-, with . However, even if real, this 8.4-GHz detection is still consistent with the 1.4-GHz limit, and the fact that the observed radio flux-density from HDF850.1 is lower than that of comparably bright sub-mm sources which have already been successfully identified.
In this paper we report new results which reveal the host galaxy of HDF850.1 to be a faint, extremely red object lying at . This conclusion follows from a detailed analysis of a new, deep (10-hr), high-quality (0.6-arcsec seeing) image of the HDF obtained with the 8.2-m Subaru telescope. This has revealed a new near-infrared counterpart to HDF850.1, which we also find to be marginally detected in the HST NICMOS F160W image of the HDF. Our conclusion that this new, faint, red object is indeed the host of the sub-mm source is then strengthened by a re-analysis of the combined MERLIN+VLA 1.4-GHz radio image of the HDF. This yields a 4- detection of HDF850.1 only 0.1 arcsec distant from the new near-infrared counterpart, and with sufficient positional accuracy to exclude all the previously-considered alternative optical candidates discussed above. We have also utilised this new radio detection in a calculation designed to set realistic confidence limits on the estimated redshift of HDF850.1, and find . Finally, since this new discovery cannot change the fact that the elliptical 3-586.0 is unlikely to lie so close to the sub-mm/mm/radio source by chance, we calculate the probability of the most likely explanation of this coincidence, namely that HDF850.1 is gravitationally lensed by 3-586.0. This possibility has been considered before by Hughes et al. and Downes et al. (and indeed a lensing model for 3-586.0 was discussed by Hogg et al. (1996) prior to the discovery of HDF850.1). However, a more accurate calculation can now be performed given the improved positional accuracy for HDF850.1, new limits on the brightness of a counter image, and the accurate estimate of the mass of 3-586.0 which we have deduced from our detailed modelling of the infrared and optical images.
The structure of the paper is as follows. In the next section we briefly summarize all the multi-frequency information for HDF850.1 (and its immediate vicinity) which was available prior to this new study. Then, in section 3 we describe the new data, and the results of the reanalysis of the MERLIN+VLA 1.4–GHz dataset. In section 4 we explain how we analysed the image in two independent ways, and demonstrate that both methods reveal the same new candidate identification, which we hereafter refer to as HDF850.1K. We also show that a similar analysis of the existing HST NICMOS F160W image of the HDF yields a marginal -band detection of this object.
In section 5 we present photometric and astrometric information for HDF850.1K, summarize the properties of the elliptical 3-586.0 derived from our image analysis, and present new confidence limits on the estimated redshift of HDF850.1. In section 6 we draw this information together and provide a quantitative discussion of the likelihood that the new near-infrared identification is indeed the host galaxy of HDF850.1. We also calculate the likely extent to which this source has been gravitationally lensed by the elliptical 3-586.0. We conclude with a discussion of the implications of these new results for the sub-mm galaxy population in general, and for current estimates of star-formation density at high redshift. Throughout this paper we assume a flat cosmology with , , and .
2 Existing Data
2.1 Sub–millimetre data
HDF850.1 was detected by Hughes et al. (1998) at 850
with a flux density of mJy.
This flux density,
derived from the map, was also confirmed to within the errors by
pointed photometric observations. The position of this
object as derived from the original SCUBA map of the HDF was (J2000)
RA 12h 36m 52.32s Dec +62∘ 12′ 26.3′′
The formal uncertainty in this position, based on the SCUBA beam size at 850 , and the S/N of the detection was quoted by Hughes et al. to be 0.7 arcsec (1-) in each dimension. This position, and the 1- errors, are marked by a cross in Fig. 1, and labelled ‘SCUBA1’.
A reanalysis of the HDF SCUBA map has recently been completed by Serjeant
et al. (2002), using the maximum-likelihood source extraction
technique described by Scott et al. (2002). This yields a slightly different
position for HDF850.1 (albeit one consistent with the originally
quoted formal uncertainty) which is (J2000):
RA 12h 36m 52.22s Dec +62∘ 12′ 26.5′′
Serjeant et al. (2002) also performed a series of simulations to estimate the effect of confusion noise on extracted source position in the SCUBA HDF map, and found that, even at the 7 mJy level, the mean positional offset is arcsec. In Fig. 1 we therefore also show this revised SCUBA position for HDF850.1, labelled ‘SCUBA2’, with a positional error of 1.5 arcsec (1.1 arcsec in each dimension).
Hughes et al. also derived a 450 3– upper limit of mJy. As discussed by Hughes et al., a non-detection at this level constrains the redshift of HDF850.1 to , for the known range of far-infrared–to–sub-mm spectral energy distributions.
Finally, we note that Serjeant et al. quote a somewhat smaller value for the 850 flux density of HDF850.1 than Hughes et al. (i.e. mJy). However, in this paper we adopt the originally quoted value of 7 mJy, because this value is more consistent with the result derived from the pointed photometric observations.
2.2 Millimetre data
HDF850.1 was also detected by Hughes et al. at 1.35 mm, and found to have a flux density of mJy. This observation was made with a beam of FWHM 23 arcsec, and so can safely be regarded as a measure of the total 1.35 mm flux density of the source. Given this, the subsequent measurement of mJy by Downes et al. (1999) within the -arcsec beam of the IRAM PdB interferometer, indicates that the source is reasonably compact.
The 1.3-mm position measured for HDF850.1 by Downes et al. is (J2000)
RA 12h 36m 51.98s Dec +62∘ 12′ 25.7′′
with an uncertainty of 0.3 arcsec (1-) in each dimension This position, and the 1- errors, are also marked by a cross in Fig. 1. This position is clearly consistent with the SCUBA position in the light of the revised uncertainty in the SCUBA astrometry discussed above. It is 1.9 arcsec distant from the SCUBA position of HDF850.1 derived by Serjeant et al. (2002), corresponding to the 69th percentile of the distributions of positional offsets estimated from the simulations of the effects of confusion noise on source position.
2.3 Radio data
The formal position of the only possible marginal radio
detection of HDF850.1 (i.e. the
3-
‘source’ VLA 3651+1226 from the supplementary
list of sources in Richards et al. 1998) is (J2000)
RA 12h 36m 51.96s Dec +62∘ 12′ 26.1′′
but the low significance of this detection means that the 1- error in this position is arcsec in each dimension. This position and the 1- errors are marked by the large cross in Fig. 1. It can be seen that the position of this radio detection is consistent with both the SCUBA and IRAM positions.
2.4 Optical data
Finally, also shown (and labelled) in Fig. 1 are the 3 optical objects 3-577.0, 3-586.0, and 3-593.1 which, as discussed in the introduction, have been previously considered as potential identifications by various authors. Unfortunately, a spectroscopic redshift has yet to be determined for any of these objects despite, at least in the case of 3-586.0, deep optical spectroscopy with the 10-m Keck telescope (Stern, private communication). The colour-estimated redshifts for these 3 objects are , and respectively (Fernandez-Soto et al. 1999; Rowan-Robinson 2001). In the case of 3-586.0 the estimated redshift is relatively secure due to the fact that its broad–band SED so clearly mimics that expected from an evolved elliptical at , with a clear break between the and bands. The apparent passivity of this elliptical is also the most likely explanation for the lack of any discernable emission-line features in its optical spectrum.
The positions of the optically-detected galaxies shown in Fig. 1 are as given in Williams et al. (1996) and Downes et al. (1999). However, the -arcsec errors on RA and Dec given in these papers can now be revised down to arcsec following the registration of the HDF optical image with the MERLIN image (see section 3.2) to within an accuracy of 50 milliarcsec.
3 New observations
3.1 Deep Subaru Imaging
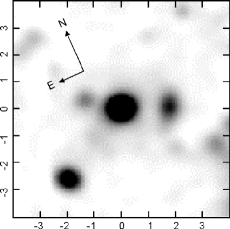
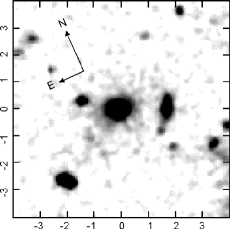
The new deep image of the HDF-N was obtained with the Subaru 8.2-m telescope equipped with the NIR camera CISCO (Motohara et al. 1998) on April 3–4, 2001. Full details of the observations and data reduction will be given in a future publication (Kajisawa et al., in prep.). Here we briefly summarize the data properties. The net on-source integration time is 10.2 hr. The data were reduced in a standard manner; each individual frame was flat-fielded and median-sky subtracted before the frames were combined. Photometric calibration was peformed using UKIRT Faint Standard Stars observed at various altitudes during the observation, to produce magnitudes in the UKIRT Mauna Kea system (Hawarden et al. 2001). We have ignored the colour correction, which introduces an uncertainty in the magnitude of the detected sources of at most 0.1 mag depending on their spectra. The original pixel scale of CISCO is 0.111 arcsec, but the images have been carefully resampled to match the WFPC2 drizzeled data (see subsection 4.1 below). The seeing was arcsec during the observations and the FWHM of stellar objects in the final image is arcsec. The peak of the number counts of the detected sources reaches a magnitude of . A greyscale representation of the arcsec sub-region of this image, centred on 3-586.0, is shown in the top panels of Fig. 2.
3.2 MERLIN+VLA 1.4-GHz image
18 days of MERLIN data and 42 hours of A–array VLA data at 1.4 GHz have been combined to image radio sources in a 10-arcmin field centred on the HDF. This area includes both the HDF and the Hubble Flanking Fields (HFF). These are the most sensitive 1.4-GHz images yet made, with rms noise levels of 3.3 /beam in the 0.2-arcsec resolution images (Muxlow et al. 2002). Positions derived from the independent MERLIN and VLA imaging are with respect to the International Celestial Reference Frame (ICRF, Ma et al. 1998), and agree to better than 15 milliarcsec over the entire 10 arcmin field. Radio sources associated with compact galaxies have been used to align the HST WFPC2 optical fields to better than 50 milliarcsec in the HDF itself, and to better than milliarcsec in the outer parts of the HFF (Muxlow et al. 2000). This astrometric alignment of the HST WFPC2 fields has been used by Garrington, Muxlow & Garrett (2000) to argue that the position of HDF850.1 as measured by the IRAM telescope (Downes et al. 1999), again with respect to the ICRF, precludes its identification with any galaxy visible on the HDF WFPC2 frame.
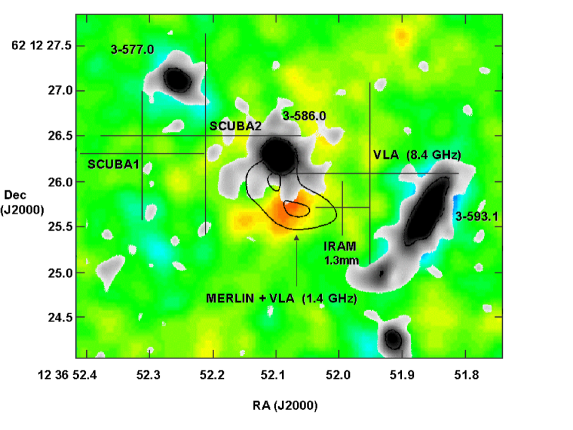
In that region of the HDF close to the position of HDF850.1, the high-resolution MERLIN+VLA image has been smoothed to 0.6-arcsec resolution. In the smoothed image, an area of extended radio emission is detected between the elliptical galaxy 3-586.0 and the IRAM position for HDF850.1. This detection is shown by the contours in Fig. 4a, where it can be seen that the radio emission splits roughly into two components, one partially overlaying the central region of 3-586.0, and the other lying 0.5 arcsec to the East of the IRAM position. Fitting a two-dimensional Gaussian to the latter radio component yields a flux of 16 at the position given in Table 2. With an rms noise level of 3.7 /beam in the smoothed radio image, the source detection is significant at better than the 4- level.
4 Near-Infrared Image Analysis
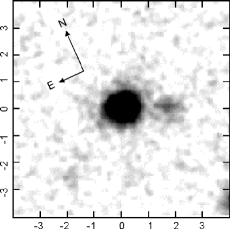
The raw Subaru image of the field shown in the top panel of Fig. 2 contains no obvious new candidate identification for HDF850.1 over and above those present in the HST WFPC2 optical images as discussed in Section 2. However, because of the extreme depth of this image, and the fact it has been taken from the ground (albeit in excellent conditions, with a seeing disc FWHM of 0.6 arcsec) the objects in the vicinity of HDF850.1 appear considerably more extended than in the corresponding HST images. In particular, near-infrared emission from the elliptical 3-586.0 is detectable out to an angular radius of arcsec, and thus covers a significant region of the image within which the true identification of HDF850.1 could potentially lie. We therefore decided to attempt to remove the light of 3-586.0 from the image. This was done in two independent ways, first by subtracting an appropriately blurred and scaled version of the F814W image of the field, and second by fitting and removing a model representation of the elliptical from the image. As described below, these two alternative approaches yielded re-assuringly similar results. We have also performed a similar analysis on the HST NICMOS Camera-3 F160W image of the HDF (Dickinson et al. 2002) and find that this yields a marginal -band detection at the same position (to within arcsec) as the detection.
4.1 Subtraction of the F814W image from the image
The image was interpolated onto the same pixel scale as the drizzled F814W image (0.04 arcsec), and then arcsec postage-stamp images were extracted at both wavelengths, centred on the fitted centroid of the elliptical 3-586.0. The F814W image was then convolved with a Gaussian, scaled to the same central peak height as the image, and subtracted from it. The FWHM of the convolving Gaussian was varied until optimally clean subtraction of 3-586.0 from the residual image was achieved. The optimum FWHM was 0.57 arcsec which, when added in quadrature to the intrinsic width of the HST F814W point spread function, makes good sense given the rms seeing of 0.6 arcsec determined from the full image of the HDF.
This process is summarized in Fig. 2 (left-hand column) which shows the image, the convolved F814W image, and the residual image. The small cross in the residual image marks the position of the centroid of 3-586.0. It can be seen that the brightest source in this pseudo residual flux-density image is a small source, of visible angular extent arcsec, lying 0.55 arcsec distant from the projected centre of 3-586.0.

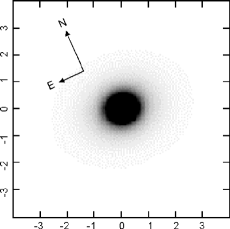
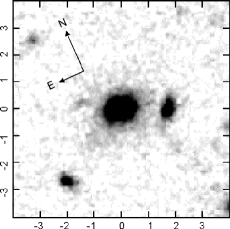
4.2 Subtraction of a model elliptical from the image
A model elliptical galaxy was fitted to the original 0.1-arcsec pixel Subaru image of 3-586.0 using a 2-dimensional modelling code originally developed for modelling quasar host galaxies (McLure, Dunlop & Kukula 2000), incorporating 0.6-arcsec seeing. This model elliptical was then simply subtracted from the image to produce a second, alternative residual map of the field which was then interpolated onto 0.04-arcsec pixels for ease of comparison with the pseudo image discussed in the previous subsection.
This process is also summarized in Fig. 2 (right–hand column), which shows the raw image, the image of the best fitting de Vaucouleurs model of 3-586.0, and the residual image. All objects detected in the image other than 3-586.0 are obviously still present in this residual image, but the one new object revealed by this model subtraction process is once again a small source, of visible angular extent arcsec, lying 0.55 arcsec distant from the projected centre of 3-586.0.
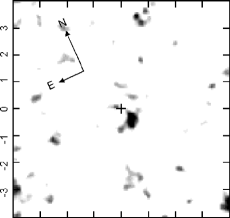
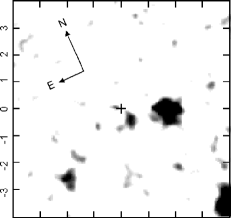
4.3 Subtraction of the F814W image from the NICMOS F160W image
The drizzled F160W image of the HDF (Dickinson et al. 2002) was interpolated onto the same pixel scale as the drizzled F814W image (0.04 arcsec), and then arcsec postage-stamp images were extracted at both wavelengths, centred on the fitted centroid of the elliptical 3-586.0. The F814W image was then convolved with a Gaussian of FWHM 3.5 pixels (in an attempt to degrade it to a resolution comparable to that of the F160W image), scaled to the same central peak height as the F160W image, and subtracted from it. The result of this process was not as clean as that achieved using the image. In particular it produced a region of oversubtraction around the centroid of 3-586.0 (at a radius arcsec) presumably due to the difference between the Gaussian-convolved WFPC2 PSF and the more Airy disc-like NICMOS PSF. However, attempts to resolve this problem using convolution with the F160W PSF predicted by the tiny tim software did not produce any significant improvement. The resulting residual image should therefore be regarded with some caution. Nevertheless, as shown in Fig. 3, (which shows the NICMOS F160W image, the convolved F814W image, and the residual image) the brightest source in the central region of this pseudo residual flux-density image lies in exactly the same position, and has the same basic shape as the source revealed by the analysis of the image discussed above and illustrated in Fig. 2.
5 Results
5.1 Discovery of HDF850.1K, the faint ERO host of the sub-mm source HDF850.1
The detection of a new source 0.55 arcsec distant from 3-586.0 in the bottom-right panel of Fig. 2 shows that it is genuinely due to an excess of -band flux-density, rather than some defect in the F814W image. Conversely its presence in the bottom-left panel of Fig. 2 demonstrates that it is not simply an artefact of the model-fitting process due to, for example, the galaxy 3-586.0 not being well described by a smooth elliptical model. Moreover, the similarity of this object in these two alternative residual images ( and ) means that this object must be undetected in the F814W image.
To quantify the significance of this new detection we have performed aperture photometry on both the alternative residual images described above. To quantify the significance of its non-detection in the -band, we have also performed aperture photometry at the same position in a residual F814W image, produced by fitting and subtracting a 2-dimensional elliptical model to the F814W image of 3-586.0. To obtain an estimate of its colour we have performed aperture photometry on the residual NICMOS F160W image shown in the bottom panel of Fig. 3, centred on the position of the detection.
The results of this photometry are given in Table 1. In summary, this new object (which we hereafter call HDF850.1K) is a faint, but clearly significant detection at with , and is an extremely red object, with and .
As can be seen from Table 1, the faintness of HDF850.1K means that its magnitude has to be based on measurements made through relatively small software apertures ( arcsec). There is no evidence that HDF850.1K is significantly more extended than the 0.6-arcsec seeing disc in the sense that, correcting for the effects of seeing, the 0.5-arcsec measurement is certainly consistent with the 1.0-arcsec aperture measurement. However we cannot rule out the possibility that, given imaging of sufficient depth, HDF850.1K might prove to be as extended as the -band identification of Lockman850.1 recently reported by Lutz et al. (2001) (for which the 3-arcsec diameter aperture magnitude is 1.6 mag. brighter than the 1-arcsec diameter aperture magnitude).
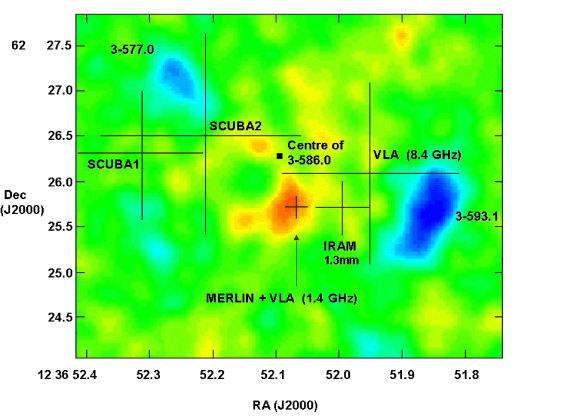
After clockwise rotation of the images shown in Fig. 2 to align with the RA and Dec co-ordinate system, a colour version of the residual image has been combined with the information presented in Fig. 1, along with the MERLIN+VLA contours discussed in section 3.2, to produce the combined image shown in Fig. 4a. The accurate alignment of the residual colour image with Fig. 1 is aided by the negative images of 3-557.0 and 3-593.1 present in the former.
Relative to the centre of 3-586.0, the centroid of HDF850.1K lies
arcsec west, and arcsec south of
the elliptical galaxy. Use of the
accurate (50 milliarcsec rms) reference frame established from matching the
MERLIN and HST images of the HDF then yields a position for HDF850.1K of
(J2000)
RA 12h 36m 52.072 Dec +62∘ 12′ 25.75.
Given the IRAM PdB position for HDF850.1, and the well-documented fact (see Hughes et al. 1998 and Downes et al. 1999) that none of the other plausible optical/IR counterparts (3-586.0, 3-593.1 or 3-593.2) appear to have estimated redshifts consistent with that estimated for HDF850.1, it seems highly probable that HDF850.1K is indeed the long-sought host galaxy of the brightest SCUBA source in the HDF. This probability is obviously further increased by the fact this object is an ERO, with a colour very similar to that which has been found for other, sucessful SCUBA source identifications (e.g. Lutz et al. 2001; Ivison et al. 2000, 2001; Smail et al. 1999; Frayer et al. 2000). However, perhaps most impressive of all, as illustrated in Fig. 4b, is the essentially exact astrometric coincidence of HDF850.1K with the tentative detection of HDF850.1 in the combined MERLIN+VLA 1.4-GHz image discussed above in section 3.2 which yields a new radio position for HDF850.1 accurate to 0.1 arcsec. The astrometric information for the various detections of HDF850.1 as a function of frequency is summarized in Table 2.
The probability that HDF850.1K is the correct identification of HDF850.1 is quantified and discussed in more detail in Section 6.1, while the possible effects of lensing by 3-586.0 are discussed in Section 6.2. However, to better inform this discussion we first consider what can be learned about 3-586.0 from the optical-infrared image analysis presented here, and also calculate what new constraints can be placed on the estimated redshift of HDF850.1 incorporating its new detection at 1.4 GHz.
| Band | Flux/Magnitude | Method/Source |
| 0.5′′ diameter, | ||
| 0.5′′ diameter, | ||
| 1.0′′ diameter, | ||
| 1.0′′ diameter, | ||
| 1.0′′ diameter, adopted average | ||
| 1.0′′ diameter, seeing corrected | ||
| 0.5′′ diameter, seeing corrected | ||
| 0.5′′ diameter, seeing corrected | ||
| mJy | SCUBA; Hughes et al. (1998) | |
| mJy | SCUBA; Hughes et al. (1998) | |
| mJy | IRAM; Downes et al. (1999) | |
| mJy | SCUBA; Hughes et al. (1998) | |
| Jy | E.Richards, priv. comm. | |
| 3 Jy | VLA; Richards (1999) | |
| Jy | Merlin+VLA; this paper |
| Band | RA (J2000) | Dec (J2000) |
|---|---|---|
| 850 | 12h 36m 52.32 | 62∘ 12′ 26.3 |
| 850 | 12h 36m 52.22 | 62∘ 12′ 26.5 |
| 1.3 mm | 12h 36m 51.98 | 62∘ 12′ 25.7 |
| 1.4 GHz | 12h 36m 52.060 | 62∘ 12′ 25.67 |
| 12h 36m 52.072 | 62∘ 12′ 25.75 |
5.2 Properties of the elliptical galaxy 3-586.0
As outlined in the introduction, the galaxy 3-586.0 is already known to be a relatively quiescent, red elliptical with a fairly solid estimated redshift of . As part of the analysis presented here we have fitted a 2-dimensional de Vaucouleurs model to the new ground-based -band, and existing HST - and -band images of this galaxy. The results of this modelling are summarized in Table 3, where it can be seen that the half-light radius depends on wavelength to a degree which is entirely consistent with the colour gradients exhibited by other well-studied ellipticals of comparable size.
We have used these results to estimate the velocity dispersion of this elliptical galaxy from the -band fundamental plane (Mobasher et al. 1999). This was done in the following way. The observed -band surface brightness of 3-586.0, at the half-light radius , is . To convert this to a present-day surface brightness we have made the standard correction for cosmological dimming, incorporating a -correction based on a rest-frame colour of , and assuming that between and this galaxy would be expected to dim by mag due to passive evolution. This latter assumption, equivalent to assuming a minimum level of evolution (i.e. a high formation redshift), is justified by the fact that, with observed colours of and , it is clear that 3-586.0 is already a very passive and well-evolved galaxy close to the red envelope of galaxy evolution at .
This calculation yields a rest-frame -band surface brightness at of , which converts to a mean surface brightness internal to of .
This number was then inserted into the relation between effective diameter (), velocity dispersion () and mean surface brightness () derived by Mobasher et al. for the Coma cluster:
| (1) |
To obtain from this relation we calculated for 3-586.0 by first converting the geometric average value of given in Table 3 to the major axis value, doubling this and then transforming the result to the redshift of the Coma cluster (). This yields a value of arcsec.
The resulting estimate for the velocity dispersion of 3-586.0 is , with an rms uncertainty of which we have calculated directly from the data for the Coma cluster provided by Mobasher et al.
This new estimate for the velocity dispersion of 3-586.0 is somewhat lower than the value previously estimated by Hogg et al. (1996). However, this earlier estimate was based purely on the Faber-Jackson relation, and did not allow for the effects of passive evolution.
| RA (J2000) | Dec (J2000) | Magnitude | Scalength | velocity dispersion | |
|---|---|---|---|---|---|
| 12h 36m 52.101 | 62∘ 12′ 26.27 | 3.0 kpc (at ) | |||
| 3.0 kpc (at ) | |||||
| 3.3 kpc (at ) | |||||
| 4.0 kpc (at ) |
5.3 The estimated redshift of the sub–mm source
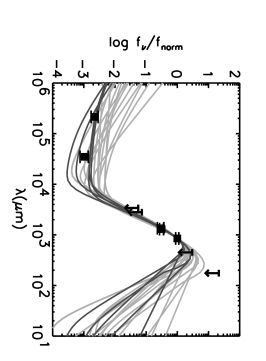

As discussed in Sections 2 and 3, the SED of HDF850.1 is well sampled from radio to FIR wavelengths. The upper panel of Fig. 5 shows the observed long-wavelength SED of HDF850.1, normalized to its flux density at 850 m. The shape of this SED can be used to determine the redshift probability distribution of the source. A Monte Carlo photometric redshift method has been developed (Hughes et al. 2002; Aretxaga et al. 2002) to also take into account constraining prior information such as the number counts of sub-mm galaxies, the favoured evolutionary model of the sub-mm population, and the amplification and clustering properties of a certain field. We assume that the SEDs of sub-mm galaxies are well represented by 20 SEDs of local starbursts, ULIRGs and AGN, all of which are well sampled in the radio–FIR regime to allow the reliable fitting of physically-motivated functional relationships. The Monte Carlo yields the probability of producing the colours and flux densities of the sub-mm galaxy under study at any given redshift, and thus provides us with the whole redshift probability distribution and not with just the first and second moment of the distribution, as popular maximum-likelihood techniques do.
This Monte Carlo photometric redshift technique places the most likely redshift of HDF850.1 at with a 68% confidence interval of and a 90% confidence interval of . The redshift probability distribution is clearly consistent with earlier claims that locate HDF850.1 at (Hughes et al. 1998; Downes et al. 1999). The lower panel of Fig. 5 shows the redshift probability distributions found under different assumptions (details about the calculations are given in Aretxaga et al. 2002). Different lines correspond to different adopted evolutionary models of the sub-mm population and possible lensing amplifications. The thick solid line corresponds to an unlensed scenario and the thick dashed line to a lensed scenario where HDF850.1 is amplified by a factor of 3 (see section 6.2). The results are almost independent of the adopted evolutionary model of the sub-mm population and the lensing amplification of HDF850.1 considered. Lensed models produce a minor transfer of probability from redshifts to redshifts , as the likelihood of detecting fainter, higher-redshift sources with compatible colours is increased. However, the most probable redshift in the lensed scenarios is still basically the same, i.e. .
6 Discussion
6.1 Robustness of the sub-mm source identification HDF850.1K
6.1.1 Statistical association with the IRAM source
To estimate the statistical confidence with which this newly-discovered faint ERO can by identified with the SCUBA source, we first ignore the new radio information and simply add HDF850.1K to the list of possible identifications for the 1.3 mm detection of HDF850.1 considered by Downes et al. (1999). As illustrated in Fig. 4b, the distance from the IRAM position to HDF850.1K is 0.65 arcsec. The number density of galaxies with is arcsec-2 (Maihara et al. 2001). Consequently, the raw Poisson probability of finding HDF850.1K so close to the IRAM position is . However, as discussed by Downes et al. (1986) (see also Dunlop et al. 1989, and Serjeant et al. 2002), this number needs to be corrected for the different ways that objects with this a posteriori Poisson probability could be found down to the limiting magnitude of the available data. Using the corrected number counts from Table 3 of Maihara et al., the cumulative surface density of objects down to is 0.07 arcsec-2. So, for an adopted search radius around the IRAM source of 1 arcsec, the corrected probability that this is a chance coincidence is .
It is interesting to consider how this compares with the statistical probability that the elliptical 3-586.0 lies so close to the IRAM source by chance. In this case, using the -band HST data, we get a range of values depending on whether we use the catalogue of Williams et al. 1996 (W96), the SExtractor catalogue (N98), or the shallower Barger et al. (1999a) catalogue (B99). The raw Poisson probabilities of this coincidence calculated from these three different catalogues are (W96), 0.03 (N98) or 0.01 (B99). If we again adopt a search radius of 1 arcsec around the IRAM source, the corrected probabilities become , 0.09 or 0.03 respectively. The probabilities for 3-593.1 are somewhat higher and, as already noted, 3-577.0 lies outwith any reasonable search radius from the IRAM position.
Thus, ignoring the radio data we can conclude that the probability that HDF850.1K lies so close to the IRAM source position by chance is %, and that this 2- result is comparable to the statistical significance of the IRAM+3-586.0 association. If, as has been argued above, 3-586.0 can be rejected as a potential SCUBA identification on the grounds of estimated redshift, we can conclude that HDF850.1K is the most likely counterpart for the IRAM source as revealed by all optical and near-infrared imaging undertaken to date.
Qualitatively, this identification seems all the more likely because it is an ERO (, ), given that several of the most secure SCUBA identifications have comparable colours (e.g. Lutz et al. 2001; Smail et al. 1999; Dey et al. 1999; Ivison et al. 2000, 2001). However, factoring this observation into the statistical calculation is difficult because the surface density of EROs is not properly determined at this depth. Specifically, while -band number counts reaching have been published in three papers (Maihara et al., Bershady et al. 1998 and Moustakas et al. 1997) in only one of these are deep -band data also presented (Moustakas et al. 1997), and in this case the authors find no galaxy with and in a 2 arcmin2 field.
Alexander et al. (2001) define ‘very red objects’ (VRO) as having and report a cumulative number density of 1500 () degree-2 to , and 6100 () degree-2 to . So, down to we can calculate that the probability of finding a ‘VRO’ 0.65 arcsec from the IRAM position by chance (even adopting a source density of 8900 degree-2) is . Clearly this number will be increased by going to increased depth in , but it will also decrease if the redder threshold appropriate to the current study is adopted. In fact, these two factors will roughly cancel out, as can be seen from an extrapolation of the results of Smith et al. (2002), who estimate the number densities of EROs (in and subsamples) down to K=21.5. Extrapolating the results of their redder subsample, as appropriate for HDF850.1K, yields a very rough estimate of 0.001 ERO arcsec-2 at K=23.5, which translates to a probability of that such an object would be found 0.65 arcsec from the IRAM position by chance.
6.1.2 Statistical association with the new 1.4-GHz detection
The statistical probabilities calculated above are already reasonably compelling. However, we have not yet made use of the new 1.4-GHz MERLIN+VLA detection to refine the expected position and search radius for the optical/IR counterpart.
To do this we first calculate the probability that this 1.4-GHz MERLIN+VLA source is indeed the same source as detected by IRAM at 1.3 mm. In fact, since the angular separation of these two sources is only 0.56 arcsec (see Fig. 4b), and the surface density of radio sources down to is only arcsec-2, the Poisson probability of such a chance coincidence transpires to be only .
We can therefore safely assume that the 1.4-GHz source is indeed the mm/sub-mm source, and therefore that the MERLIN+VLA 1.4-GHz detection offers the most accurate available position for HDF850.1. If we now recalculate the probability that HDF850.1K is a chance coincidence with HDF850.1 we find a raw Poisson probability of , corrected to if we adopt a 3- search radius of 0.3 arcsec. This is a compellingly small number, which would only become smaller if we were able to factor in reliably the prior probability that the object is an ERO.
We conclude by noting that the 3- search radius from the MERLIN+VLA position does not now extend to include the centroid of 3-586.0 (see Fig. 4), and so this object can now be excluded as a possible identification without recourse to arguments based on redshift estimates for both sources. Of course, the fact that 3-586.0 has eventually turned out not to be a feasible identification on astrometric grounds in a sense lends credence to the pre-existing redshift-estimate argument.
However, despite its rejection as a possible identification, it still remains the case that 3-586.0 lies surprisingly close to HDF850.1 on the sky (at the 2- level), a statistical result which merits a physical explanation. The most likely explanation is that HDF850.1 has been gravitationally lensed by 3-586.0, a possibility which we explore and quantify below in section 6.2.
6.1.3 Optical-IR constraints on the redshift of the HDF850.1K


Having established that HDF850.1K is statistically highly likely to be the true host galaxy of the sub-mm source, it remains to consider whether, unlike 3-586.0, its optical-infrared photometric redshift estimate is at least consistent with that derived for the sub-mm source from the longer-wavelength data in section 5.3.
Given that the available information on HDF850.1K consists of only a magnitude, an approximate colour, and a limit on colour, it is obviously impossible to make an accurate estimate of its redshift. However, it is still worth exploring what constraints can be placed on its redshift under the assumption that its intrinsic properties are not unlike those of low-redshift ULIRGs. This assumption is of course debatable, and indeed there is some evidence that the near-infrared to ultraviolet properties of local ULIRGs do not quite correspond to the red colours of the sub-mm population (local ULIRGs are in general bluer than the EROs associated with sub-mm galaxies; Dannerbauer et al. 2002). Nevertheless, in the absence of a good set of UV–optical–IR templates to determine the photometric redshift of HDF850.1K, we have used the local sample of ULIRGs to look for constraints on its redshift, independently of the redshift associated with the radio–mm–FIR source.
The upper panel of Fig. 6 shows the vs. colours of three local ULIRGs with available UV–optical colours (Trentham et al. 1999) when placed at different redshifts. At , the predicted magnitude is calculated based on extrapolations from the rest-frame 1450Å measurements, the shortest-wavelength at which these ULIRGs have been detected, and thus this redshift regime should be interpreted with caution. The colour offset produced by increasing amounts of reddening E()=0.2, 0.4 according to a typical starburst extinction law (Calzetti et al. 2000) are shown for I121120305, and are similar for the other ULIRGs. The colours of HDH850.1K can be reproduced within the 1 confidence interval by VII Zw 31 at ( within 3), by I121120305 at allowing for a E()=0.2 increased extinction ( within 3), and by I224911808 at allowing for a E()=0.4 increased extinction ( within 3). Increasing amounts of extinction over these values can also accommodate lower redshift ranges, as shown by the parallel tracks of I121120305 in Fig. 6. Similarly, de-reddening values of E 0.5 can accommodate higher redshift intervals () for VII Zw 31.
Recently, Dannerbauer et al. (2002) have produced a diagnostic diagram to estimate the redshifts of mm-galaxies based on the magnitude of their IR counterparts, taking a local sample of ULIRGs as templates. Their method provides a complementary constraint on the redshift interval compatible with the optical–IR observations of HDF850.1K. The lower-panel of Fig. 6 shows the vs magnitude–colour relationship that the local ULIRGs sample describes when located at different redshifts. Following Dannerbauer et al. (2002), the -band magnitudes are derived from scaled UV–optical–IR–mm SEDs that reproduce 5mJy sources at 1.2mm, and HDF850.1K is, therefore, accordingly scaled to .
Disregarding reddening corrections, the only ULIRG compatible with the , colours and -band magnitude of HDF850.1K within a 3 confidence level is VII Zw 31 at . However, a small increase E()= 0.2 in the amount of reddening of I121120305 can reproduce the colours of HDF850.1K within a 1 confidence interval at , and within a 3 confidence interval at . For I224911808, the same is true using additional extinction corrections E()= 0.4, at within a 1 interval, and at within a 3 interval.
In summary, if placed at , the template local ULIRGs could reproduce the , colours and magnitudes of HDF850.1K within the 3 confidence interval. The probability that the redshift of the sub-mm source is in the regime is 90% based on its radio–sub-mm–FIR colours (section 5.3.) . Therefore, although the derivation of a reliable optical–IR photometric redshift for HDF850.1K is not possible given the present optical-infrared data, this analysis does at least show that these are completely consistent with the redshift interval derived in section 5.3.
6.2 Gravitational lensing

6.2.1 The HDF850.1 + 3-586.0 system
One striking aspect of the new proposed identification of HDF850.1 is its proximity to the elliptical 3-586.0. With a low photometric redshift (, this was considered a poor candidate identification by Hughes et al. (1998). Hughes et al. nevertheless recognized that a elliptical such as 3-586.0 had a low probability of aligning with a SCUBA source by chance, and they proposed that gravitational lensing by the foreground elliptical could have enhanced this probability. We now revisit this possibility in the light of our improved knowledge of the identification of HDF850.1 and the properties of 3-586.0.
The main features of the putative lens-source system are as follows. The observed separation of lens and main image is 0.55 arcsec, but there is no suggestion of a counter-image. This statement does not assume that any counter-image would be exactly opposite the main image; Fig. 2 shows that there is no other significant image in the general vicinity. Based on the noise within 0.5-arcsec diameter photometric apertures on the image, we adopt a 2- limit for a counter-image of , which implies an upper limit of 0.26 for the flux ratio between any counter-image and the main image. This lack of evidence for strong lensing constrains a combination of the mass of 3-586.0 and the redshift of HDF850.1; in the following discussion, we assume a standard , geometry.
The simplest lens model to consider for 3-586.0 is a singular isothermal sphere, for which the only parameter is the angular radius of the Einstein ring:
| (2) |
For an observed separation between lens and main image, multiple imaging is predicted if , with total amplification , and a flux ratio between counter-image and main image of . The lack of an obvious counter-image suggests that we cannot be very far into the strong-lensing regime; the 2- limit is a counter-image with flux density 0.26 times that of the main image, which corresponds to a total amplification . Together with the observed radius of the main image at 0.55 arcsec from the centre of 3-586.0, this yields the following constraint on the Einstein radius:
| (3) |
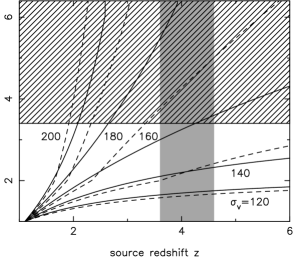
This allows a redshift-dependent limit to be set on the velocity dispersion of 3-586.0, as shown in Fig. 7a. If the photometric redshift indication for HDF850.1 is at all realistic, the velocity dispersion of 3-586.0 cannot exceed about in this model.
A more realistic model will have a finite core to the mass distribution. We assume that 3-586.0 is baryon-dominated in the centre, so that the observed profile gives the bend-angle profile directly, up to a free . With this assumption the bend angle has a broad peak at 0.9 arcsec radius, falling to half this value at 0.15 arcsec. We connect this to the isothermal sphere model by assuming that the bend angle remains constant beyond 0.9 arcsec, and we use this asymptotic value to give an effective velocity dispersion to the lens, which is most conveniently quoted as the Einstein radius that corresponds to a singular model with the same asymptotic bend angle. For this non-singular profile, the onset of multiple lensing is more abrupt: additional images first form with divergent amplification via caustic-crossing, at which point the amplification of the main image is . The limit on the lens properties now changes to
| (4) |
This permits a slightly more massive lens: up to for , as compared to a limit of for the singular model with this source redshift. Given the velocity dispersion estimate of for 3-586.0, inferred from the -band fundamental plane in Table 3, it seems that 3-586.0 must be causing significant lensing amplification. This is shown in Fig. 7b, which evaluates the likelihood over the plane of source redshift and total amplification (assuming the non-singular model), using the estimate of the velocity dispersion (assuming the error distribution to be Gaussian in ) and the photometric source redshift estimate of (assuming the error distribution to be Gaussian in ). Integrating the likelihood values up to yields a median amplification of 3.6, with a 95% confidence lower limit of 1.7.
For a more massive lens, constrained to yield one image at 0.55 arcsec radius, significant counter-images are generally predicted. There are however two ways of evading the conclusion that the maximum lensing amplification is 6.4. The first is to consider the possibility that the observed image is in fact not the principal image: if the true position of HDF850.1 is actually on the opposite side of 3-586.0, the observed image could be the result of a merging pair of secondary images produced when the source crosses the outer caustic. The amplification for this situation can be divergent. This seems improbable, however, since the lens would need to be unrealistically massive in order to produce secondary images at 0.55 arcsec ( arcsec). A more realistic alternative with extreme amplification results if we relax the assumption of a circularly symmetric lens, in accord with the measured axial ratio of 1.28 for 3-586.0. This has little effect on the lensing properties at moderate amplifications, but greatly changes the high-amplification limit. An inner caustic opens up, and it is possible to achieve divergent amplification with large image flux ratios if the source is placed close to this caustic. For this option, the lens mass has to be such that the observed critical line passes through the image radius of 0.55 arcsec. For a circular lens, this would require arcsec, or for .
Finally, we should consider whether it is legitimate to model the lens as a single component. If 3-586.0 were to lie in a rich cluster with a constant-density core just below the critical surface density, strong lensing effects could arise with a much less massive galaxy – e.g. the case of cB58 (e.g. Seitz et al. 1998), which has some similarities to the present situation. However, cB58 was found towards a pre-selected X-ray luminous cluster; even at , it is clear that nothing remotely as massive exists around 3-586.0. Assuming a source redshift of 4.1, the critical surface density at 3-586.0 is ; the most massive known clusters at have surface densities similar in magnitude to the the critical value of interest here (Clowe et al. 1998), but these are rare systems, which would be extremely prominent on data of the HDF depth.
Such systems would also be very easily detected at X-ray wavelengths in the deep Chandra imaging of this field. In fact, the 1 Msec Chandra image centred on the HDF revealed 6 extended sources in the full arcmin field (Bauer et al. 2002). These can be used to obtain a conservative upper limit on any cluster emission in the vicinity of HDF850.1, which lies in the most sensitive part of the X-ray image. The two faintest extended sources from Bauer et al. (2002) have an X-ray flux density of ( keV). There is no evidence for any X-ray emission in the vicinity of HDF850.1 which, assuming for a high-redshift cluster containing 3-586.0, leads to an upper limit on cluster X-ray luminosity of . This corresponds to the X-ray luminosity of a weak group, times fainter than the ROSAT and EMSS clusters discussed by Clowe et al. (1998).
In summary, there are two possibilities regarding gravitational lensing of HDF850.1, assuming it to lie at : (i) A lens with would imply that there is no multiple imaging, and that the total amplification is moderate (); (ii) for close to , there is also the possibility of extreme nearly on-axis lensing, in which the amplification is not constrained, and could plausibly be more than 10 times larger. The velocity dispersion estimate of for 3-586.0 favours the former model, but does not completely rule out the on-axis case. One may suspect that is already so faint that cB58-like amplifications of order 30 are implausible, but in the absence of other evidence it is best to consider the a priori probabilities of these outcomes, as discussed below.
6.2.2 Estimated prevalence of lensing within the sub-mm source population
What are the implications of HDF850.1 for the occurrence of lensing in other SCUBA sources? It is important to understand whether this is an isolated rare event, or if lensing needs to be taken into account in interpreting the data on all bright SCUBA sources (see also Chapman et al. 2002).
The expected amplification distribution is , so we need an estimate of the lensing optical depth, . For a source at , this is on the assumption that the galaxy population at is unchanged compared to (e.g. Peacock 1982). Note that the optical depth is not sensitive to the exact lens model, and depends mainly on the total density of mass in systems of above critical surface density. The neglect of evolution means that is probably an overestimate. Figures about a factor of 4 lower are obtained from calculations based on evolving dark-matter haloes (e.g. Perrotta et al. 2002). However, because these estimates neglect halo substructure, they are almost certainly too low. The correct figure is unlikely to be far from , so the intrinsic probability of strong () lensing is only about 2%. This is boosted by amplification bias: if the slope of the counts is , the biased lensing probability is
| (5) |
For counts with the observed near–Euclidean slope of , this raises the probability to . The probability of extreme amplification is lower, but here a power-law approximation to the counts is inadequate. If we adopt the count model from equation (25) of Peacock et al. (2000), we obtain a biased probability . Together with the higher velocity dispersion needed for 3-586.0 in the on-axis case, this strengthens the case for single-image lensing with a moderate amplification in the case of HDF850.1. The observation of such an amplification in one of the first bright sub-mm sources from a blank-field survey is consistent with our simple probability calculations, which indicate that a substantial fraction (perhaps of order 1/5th) of the high-redshift SCUBA sources should be affected by lensing amplifications of this order (Blain 1996; Blain et al. 1999).
It should be possible to test this prediction once deep radio and infrared follow-up imaging of large, unbiased blank-field SCUBA surveys (such as the ‘8-mJy’ survey; Scott et al. 2002) has been completed. For now the best we can say is that a lensed fraction of this order seems not unreasonable. There is good evidence that, in a few cases, SCUBA sources have been significantly lensed by an intervening galaxy –2 arcsec distant from the true identification, based on radio or -band imaging (Smail et al. 1999; Frayer et al. 2000). However, in at least one of these cases the lensing galaxy is associated with a foreground cluster used to boost the sensitivity of the SCUBA survey (Smail et al. 1999) and thus the likelihood of such a lensing system may well be substantially greater than in blank field SCUBA surveys.
Indeed, in contrast to HDF850.1, none of the three other best-studied SCUBA sources selected from unbiased, blank-field surveys shows any evidence of having been lensed by an intervening galaxy (CUDSS14A – Gear et al. 2000; Lockman850.1 – Lutz et al. 2001; ELAISN2850.2 – Dunlop 2001a). Moreover, this is also true for the 3 bright mm sources recently discussed by Dannerbauer et al. (2002). It thus seems clear that significant lensing is not in general responsible for the bright sub-mm/mm source population. On the other hand, lensing of a significant minority of the sources detected in the ‘8-mJy’ survey may well offer an explanation for the apparent correlation between the SCUBA sources, and galaxies at relatively modest redshift found in the ELAIS N2 field by Almaini et al. (2002).
6.3 Cosmic star-formation history revisited
We conclude this discussion by considering how the new information we now possess on HDF850.1 impacts on the original estimation of dust-enshrouded star-formation density at high redshift performed by Hughes et al. (1998). The three main issues to consider are (i) the improved confidence in radio–FIR photometric redshifts which follows from the discovery of HDF850.1K, (ii) revised constraints on the plausibility that HDF850.1 and other SCUBA sources are powered by AGN rather than starbursts, and (iii) appropriate corrections for gravitational lensing in the light of this study.
6.3.1 Estimated redshifts
One important consequence of the discovery of HDF850.1K, is that it provides renewed confidence that the high SCUBA-source redshifts inferred from radio–far-infrared SED fitting should be trusted, even when the SCUBA source itself appears (at first, or even second sight) to be associated with a galaxy of surprisingly modest redshift. It also reinforces the importance of very deep radio, mm and infrared imaging for SCUBA source follow-up prior to attempting spectroscopy of candidate identifications within the original SCUBA error circle (e.g. Barger et al. 1999b).
If one trusts the radio–far-infrared SED-based redshift estimates, then current evidence suggests a median redshift for the bright SCUBA galaxy population (Dunlop 2001b; Smail et al. 2000), with the substantial majority of SCUBA sources lying at . Equally, the relative ease with which several other bright SCUBA sources have been identified compared to HDF850.1 suggests the majority probably lie at . Thus, it still seems reasonable to follow Hughes et al. (1998) and assume an approximate redshift range for calculating the contribution made by sub-mm sources to star-formation density.
6.3.2 X-ray constraints on AGN activity
Evidence continues to grow that SCUBA and Chandra/XMM sources, while perhaps correlated on large scales, are rarely coincident (e.g. Fabian et al. 2000; Bautz et al. 2000; Hornschemeier et al. 2000; Barger et al. 2001a,b; Almaini et al. 2002). As already discussed in the introduction, for the case of HDF850.1, the nearest detected X-ray source lies arcsec south-west of the SCUBA source. However, the extreme depth of the 1 Msec Chandra image of the HDF, coupled with the fact we now possess such an accurate position for HDF850.1, makes it of interest to calculate what limits can be placed on the presence of an AGN in this source.
We have deduced 3- upper limits on the X-ray flux density of HDF850.1 using the Bayesian method of Kraft, Burrow & Nousek (1991). This yields a limit of in the soft band (keV), and in the hard band ( keV)
The resulting submm–to–X-ray ratios yield a spectral index . Reference to Fig. 4 of Almaini et al. (2002) demonstrates that such a value is entirely consistent with a starburst, but means that an AGN cannot be powering the sub-mm emission unless the obscuring column is Compton–thick with a negligible scattered fraction (%).
What limits can we place on the luminosity/black hole mass of any AGN present in HDF850.1? This clearly depends on the level of absorption assumed. If we assume no absorption, than adopting yields a limiting X-ray luminosity of , comparable to the output of a weak Seyfert galaxy. Using a standard bolometric correction (a factor ), the assumption of Eddington-limited accretion yields an upper limit on black-hole mass of .
If we consider a range of absorbing columns, the upper limits on the inferred X-ray luminosity and black-hole mass are as summarized in Table 4. Thus it can be seen that unless the absorbing column is Compton-thick, the limiting black-hole mass is .
| Comp thick (1% scat) |
|---|
6.3.3 Impact of gravitational lensing
Although the results of this study indicate that the flux density of HDF850.1 has almost certainly been boosted by gravitational lensing, the inferred magnification factor is relatively modest, . There is also no evidence to support the existence of a similar lensing system for any of the other HDF SCUBA sources. This is not surprising since it is the brightest source uncovered that is statistically most likely to be significantly lensed, and the occurrence of one case of lensing within the 5 sources reported by Hughes et al. (1998) is certainly consistent with the estimates of lensing prevalence given above.
It therefore seems reasonable to simply scale down the intrinsic sub-mm luminosity of HDF850.1 by a factor of 3, for the purpose of re-calculating the total comoving star-formation density of the 5 SCUBA sources in the HDF. This produces a reduction of 30% in the estimate of comoving star-formation density reported by Hughes et al. (1998).
7 Conclusion
This study has provided a particularly striking demonstration of the importance of ultra-deep near-infrared and radio imaging for the successful identification of even the brightest of sub-mm selected sources. The contrast between the sub-mm and optical views of the HDF could hardly be more striking, with the host galaxy of the brightest sub-mm source in this field transpiring to be one of faintest and reddest objects ever uncovered at near-infrared/optical wavelengths. At such imaging depths sub-arcsec astrometric accuracy is clearly crucial if an unambiguous identification is to be secured.
It is obviously unrealistic to expect that multi-frequency data of this depth and quality will be easily achieved for large samples of bright sub-mm sources. It is therefore worth briefly revisiting what would have been concluded about HDF850.1 without the enormous investment of observing time made with the IRAM PdB interferometer, VLA+Merlin, and most recently Subaru. As discussed at the beginning of this paper, on the basis of statistical association one would have concluded that HDF850.1 was hosted by the elliptical galaxy 3-586.0. Alternatively, given the growing evidence that SCUBA source host galaxies are EROs, and given the uncertainty in raw SCUBA-source positions, another apparently plausible (and statistically likely) conclusion would be that HDF850.1 is hosted by the nearby (5-arcsec distant) ERO which is also the nearest obvious Chandra and VLA source (VLA 3651+1221). The former error would lead to the conclusion that HDF850.1 lies at relatively modest redshift, and that sub-mm–radio SED-based redshift estimation cannot be trusted. The latter error would lead to the conclusion that HDF850.1 is an AGN.
In fact of course neither of these previously possible conclusions can now be viewed as tenable, and we find that HDF850.1 does indeed appear to be a violently star-forming galaxy at , which could never be discovered via Lyman-break selection techniques.
ACKNOWLEDGEMENTS
This work was based in part on data collected at the Subaru Telescope, which is operated by the National Astronomical Observatory of Japan. MERLIN is a UK National Facility operated by the University of Manchester at Jodrell Bank Observatory on behalf of PPARC. This work was based in part on observations with the NASA/ESA Hubble Space Telescope, obtained at the Space Telescope Science Institute, which is operated by the Association of Universities for Research in Astronomy, Inc. under NASA contract No. NAS5-26555. James Dunlop acknowledges the enhanced research time provided by the award of a PPARC Senior Fellowship. Ross McLure, Bob Mann and Graham Smith also acknowledge the support of PPARC. Ian Smail and Omar Almaini acknowledge support from the Royal Society. David Hughes and Itziar Aretxaga’s work is supported by CONACyT grants 32180-E and 23143-E.
References
- [1] Alexander, D.M., Brandt, W.N., Hornschemeier, A.E., Garmire, G.P., Schneider, D.P., Bauer, F.E., Griffiths, R.E., 2001, AJ, 122, 2156
- [2] Almaini, O., et al., 2002, MNRAS, in press (astro-ph/0108400)
- [3] Aretxaga, I., et al. 2002, MNRAS, submitted
- [4] Barger, A.J., Cowie, L.L., Richards, E.A., 2000, AJ, 119, 2092
- [5] Barger, A.J., Cowie, L.L., Trentham, N., Fulton, E., Hu, E.M., Songaila, A., Hall, D., 1999a, AJ, 117, 102
- [6] Barger, A.J., Cowie, L.L., Smail, I., Ivison, R.J., Blain, A.W., Kneib, J.-P., 1999b, AJ, 117, 2656
- [7] Barger, A.J., Cowie, L.L., Mushotzky, R.F., Richards, E.A., 2001a, AJ, 121, 662
- [8] Barger, A.J., Cowie, L.L., Steffen, A.T., Hornschemeier, A.E., Bradnt, W.N., Garmire, G.P., 2001b, ApJ, 560, L23
- [9] Bauer, F.E., et al. 2002, AJ, 123, 1163
- [10] Bautz, M.W., et al., 2000, ApJ, 543, L119
- [11] Bershady, M.A., Lowenthal, J.D., Koo, D.C., 1998, ApJ, 505, 50
- [12] Blain, A.W., 1996, MNRAS, 283, 1340
- [13] Blain, A.W., Moller, O., Maller, A., 1999, MNRAS, 303, 423
- [14] Blain, A., 2001, MNRAS, in press (astro-ph/0110403)
- [15] Calzetti, D., et al., 2000, ApJ, 533, 682
- [16] Carilli, C., Yun, M., 1999, ApJ, 513, L13
- [17] Carilli, C., Yun, M., 2000, ApJ,, 530, 618
- [18] Chapman, S.C., Smail, I., Ivison, R.J., Blain, A.W., 2002, MNRAS, submitted
- [19] Clowe, D., Luppino, G.A., Kaiser, N., Henry, J.P., Gioia, I.M., 1998, ApJ, 497, L61
- [20] Dannerbauer, H., Lehnert, M., lutz, D., Tacconi, L., Bertoldi, F., Carilli, C., Genzel, R., Menten, K., 2002, ApJ, submitted (astro-ph/0201104)
- [21] Dey, A., Graham, J.R., Ivison, R.J., Smail, I., Wright, G.S., Liu, M.C., 1999, ApJ, 519, 610
- [22] Dickinson, M., et al., 2002, in preparation
- [23] Downes, A.J.B., Peacock, J.A., Savage, A., Carrie, D.R., 1986, MNRAS, 218, 31
- [24] Downes, D., et al., 1999, A&A, 347, 809
- [25] Dunlop, J.S., 2001a, in: Deep Millimetre Surveys, p.11, eds. Lowenthal, J.D. & Hughes, D.H., World Scientific (astro-ph/0011077)
- [26] Dunlop, J.S., 2001b, in: FIRSED2000, New Astronomy Reviews, 45, p.609, eds. van Bemmel, I.M., Wilkes, B. & Barthel, P., Elsevier. (astro-ph/0101297)
- [27] Dunlop, J.S., Peacock, J.A., Savage, A., Lilly, S.J., Heasley, J.N., Simon, A.J.B., 1989, MNRAS, 238, 1171
- [28] Dunne, L., Clements, D.L., Eales, S.A., 2000, MNRAS, 315, 115
- [29] Fabian, A.C., et al., 2000, MNRAS, 315, L8
- [30] Fernández-Soto, A., Lanzetta, K.M., Yahil, A., 1999, ApJ, 513, 34
- [31] Frayer, D.T., Smail, I., Ivison, R.J., Scoville, N.Z., 2000, AJ, 120, 1668
- [32] Garrington, S.T., Muxlow, T.W.B., Garrett, M.A., 2000, in IAU 2005 ’Galaxies and their Constituents at the Highest Angular Resolutions’, ed. R.T. Schilizzi, in press
- [33] Gear, W.K., et al., 2000, MNRAS, 316, L51
- [34] Hawarden, T.G., Leggett, S.K., Letawsky, M.B., Ballantyne, D.R., Casali, M.M., 2001, MNRAS, 325, 563
- [35] Hogg, D.W., Blandford, R., Kundić, T., Fassnacht, C.D., Malhotra, S., 1996, ApJ, 467, L73
- [36] Hornschemeier, A.E., et al., 2000, ApJ, 541, 49
- [37] Hughes, D.H., et al., 1998, Nat, 394, 241
- [38] Hughes, D.H., et al., 2002, MNRAS, in press (astro-ph/0111547)
- [39] Ivison, R.J., Smail, I., Le Borgne, J.-F., Blain, A.W., Kneib, J.-P., Bézecourt, J., Kerr, T.H., Davies, J.K., 1998, MNRAS, 298, 583
- [40] Ivison, R.J., et al., 2000, MNRAS, 315, 209
- [41] Ivison, R.J., Smail, I., Frayer, D.T., Kneib, J.-P., Blain, A.W., 2001, ApJ, 561, L45
- [42] Kraft, R.P., Burrows, D.N., Nousek, J.A., 1991, ApJ, 374, 344
- [43] Lawrence, A., 2001, MNRAS, 323, 147
- [44] Lutz, D., et al., 2001, A&A, 378, 70
- [45] Ma, C., Arias, E.F., Eubanks, T.M., Fey, A.L., Gontier, A.-M., Jacobs, C.S., Sovers, O.J., Archinal, B.A., Charlot, P., 1998, AJ 116, 516
- [46] Maihara, T., et al., 2001, PASJ, 53, 25
- [47] McLure, R.J., Dunlop, J.S., Kukula, M.J., 2000, MNRAS, 318, 693
- [48] Mobasher, B., Guzmán, R., Aragón-Salamanca, A., Zepf, S., 1999, MNRAS, 304, 225
- [49] Motohara, K. et al. 1998, in Proc. SPIE 3354: Infrared Astronomical Instrumentation, p.659, ed. A. M. Fowler
- [50] Moustakas, L., Davis, M., Graham, J.R., Silk, J., Peterson, B.A., Yoshii, Y., 1997, ApJ, 475, 445
- [51] Muxlow, T.W.B., Garrington, S.T., Richards, A.M.S., Richards, E.A., Garrett, M.A., Kellermann, K.I., Alberdi, A., 2000, in EVN Symposium 2000, ed. J.E. Conway, A.G. Polatidis, R.S. Booth, & Y.M. Pihlstrom (Onsala Space Observatory), 133-136.
- [52] Muxlow, T.W.B., Richards, A.M.S., Garrington, S.T., Wilkinson, P.N., Anderson, B., Richards, E.A., Axon, D.J., Partridge, R.B., Kellermann, K.I., Fomalont, E.B., 2002, MNRAS, in prep.
- [53] Peacock, J.A., 1982, MNRAS, 199, 987
- [54] Peacock, J.A., et al., 2000, MNRAS, 318, 535
- [55] Perrotta, F., Magliocchetti, M., Baccigalupi, C., Bartelmann, M., De Zotti, G., Granato, G.L., Silva, L., Danese, L., 2001, MNRAS, submitted (astro-ph/0111239)
- [56] Richards, E.A., 1999, ApJ, 513, L9
- [57] Richards, E.A., Kellerman, K.I., Fomalont, E.B., Windhorst, R.A., Partridge, R.B., 1998, AJ, 116, 1039
- [58] Rowan-Robinson, M., 2001, ApJ, submitted
- [59] Scott, S., et al., 2002, MNRAS, in press (astro-ph/0107446)
- [60] Seitz, S., Saglia, R.P., Bender, R., Hopp, U., Belloni, P., Ziegler, B., 1998, MNRAS, 298, 945
- [61] Serjeant, S., et al., 2002, MNRAS, in press (astro-ph/0201502)
- [62] Smail, I., et al., 1999, MNRAS, 308, 1061
- [63] Smail, I., Ivison, R.J., Kneib, J.P., Cowie, L.L., Blain, A.W., Barger, A.J., Owen, F.N., Morrison, G.E., 1999, MNRAS, 308, 1061
- [64] Smail, I., Ivison, R.J., Owen, F.N., Blain, A.W., Kneib, J.-P., 2000, ApJ, 528, 612
- [65] Smith, G.P., Smail, I., Kneib, J.P., Czoske, O., Ebeling, H., Edge, A.C., Pello, R., Ivison, R.J., Packham, C., Le Borgne, J.-F., 2002, MNRAS, 330, 1
- [66] Trentham, N., Kormendy, J., Sanders, D.B., 1999, AJ, 117, 2152
- [67] Williams, R.E., et al., 1996, AJ, 112, 1335
- [68] Zepf, S.E., Moustakas, L.A., Davis, M., 1997, ApJ, 474, L1