Nonradial pulsation of the Scuti star UV Trianguli
Abstract
We present the results of a three-year photometric study of the Scuti star UV Trianguli. Our data sets consist of 9378 differential measurements in Johnson together with a few data collected into the Strömgren uvby system. UV Tri is at least a biperiodic variable. The two best-fitting frequencies, =9.3298 d-1 and =10.8513 d-1, are still not the complete set of pulsation frequencies representing the star’s light variations. A suspected third frequency might present in the star. Several “anomalous cycles” are observed in the light curves. They seem real, but are aperiodic. We derive the colour indices and physical parameters for the variable and conclude that it is a Population I Sct star with normal metal abundance ([Me/H]=0.00.1 dex) evolving on its main sequence stage at an early evolutionary phase before the turn-off point. Finally, we compare the observed oscillation frequencies with theoretical models. The two pulsation modes of UV Tri are likely nonradial to be gravity modes.
keywords:
techniques: photometric – stars: oscillations – stars: individual: UV Tri – Scuti1 Introduction
The detection of multiple modes along with observational mode identifications raises the real possibility of performing rigorous asteroseismology on stars other than the Sun. Stellar oscillation frequencies are sensitive to stellar structure and the measurement of a full-set of frequencies should allow an understanding of the internal structure of a star. This is the way for us to gain insight into the internal stellar physics. Scuti stars are regularly pulsating variables situated in the lower classical Cepheid instability strip on or near the main sequence (MS). In general, the period range lies between 0.02 and 0.25 d and the spectral types range from A2 to F2. The majority of Sct stars pulsate with a number of nonradial -modes simultaneously excited to low amplitudes, but some are (pure) radial pulsators with larger amplitudes and others pulsate in a mixture of radial and nonradial modes. The Sct stars have been proven to be a class of promising pulsators for asteroseismology (e.g. Templeton et al. 1997; Pamyatnykh et al. 1998; Breger et al. 1999; Michel et al. 1999; Templeton, Bradley & Guzik 2000). Therefore, it is necessary to detect as many oscillation frequencies as possible for individual stars. For this reason, the star UV Trianguli was selected as one of the targets of a mission dedicated to the investigations of poorly-studied Sct stars.
UV Tri (=GSC 02293-01382, , , =11.2 mag, A3; Rodríguez, López-González & López de Coca 2000) was discovered to be a Sct star by Shaw et al. shaw (1983) when they observed its neighbour eclipsing binary V Tri. They found a period of 0.1 d and pointed out the possibility of multiple periods, but they could not give further results due to the deficiency of data. Hence UV Tri was observed from 1999 to 2001. We collected a number of CCD and photoelectric photometric data in the Johnson band, as well as some photoelectric data in Strömgren . We are interested in the behaviour of multiperiodicity and amplitude variability. A preliminary analysis based on part of the data showed that UV Tri is a low-amplitude biperiodic Sct pulsator. Two pulsation frequencies, =9.3299 d-1 and =10.8483 d-1 with semi-amplitudes of 0.026 and 0.010 mag, respectively, basically fit the light variations of UV Tri (Liu, Zhou & Rodríguez 2001).
In this paper, we perform a complete data analysis with the aims to explore additional pulsation frequencies and to check possible amplitude variations in the detected frequencies over the observing years. Section 2 contains an outline of the observational journal and data reduction. We derive the astrophysical parameters using the indices in Section 4. An attempt is also made in this section to model the pulsations by calculating an appropriate stellar evolution and oscillation model. Our main results are discussed and summarized in Section 5.
2 Data acquisition
The and observations of UV Tri were secured at two observatories between 1999 November 17 and 2001 November 22. The data consist of 9378 measurements in Johnson band (165.1 h) and 55 in Strömgren colours, collected in 35 observing nights. Additionally, a few data were also obtained. A journal of the observations is given in Table 1.
2.1 Johnson photometry
From 1999 November 17 to 2000 January 14, Johnson photometry of UV Tri was obtained with the light-curve survey CCD photometer (Wei, Chen & Jiang 1990; Zhou et al. 2001) mounted on the 85-cm Cassegrain telescope at the Xinglong Station of the Beijing Astronomical Observatory (BAO) of China. The photometer employed a red-sensitive Thomson TH7882 576384 CCD with a whole imaging size of 13.258.83 mm2 corresponding to a sky field of view of , which allows sufficient stars to be toggled in a frame as reference. Depending on the nightly seeing the integration times varied from 20 to 60 s. During this observing run, the following reference stars in the field of UV Tri were simultaneously monitored: C1=GSC 02293-01028 was used as the main comparison star, C2=GSC 02293-01422, C3=GSC 02293-01027, C4=GSC 02293-01461, C5=GSC 02293-01456 and C6=GSC 02293-01021 were used as check stars. The magnitude differences between the reference stars yielded a typical accuracy of 0.010 to 0.006 mag. Before constructing differential time series for the target variable, special emphasis was made to ensure the constancy of the comparison stars. Consequently, GSC 02293-01021 was discovered to be a new W Ursae Majoris-type variable (Liu et al. 2000), while the others were detected as nonvariables within the observational errors. Finally the remained five reference stars were selected to produce differential magnitudes for the variable by taking their mean combination as UV Tri(C1+C2+C3+C4+C5)/5. Atmospheric extinction was ignored because of the proximity between the selected objects. The procedures of data reduction, including on-line bias subtraction, dark reduction and flatfield correction, are outlined in Zhou et al. zhou01 (2001).
From 2000 October 24 to 2001 November 22, UV Tri was reobserved with the three-channel high-speed photoelectric photometer (Jiang & Hu 1998) attached to the same telescope. This detector is used in Whole Earth Telescope campaigns (WET; Nather et al. 1990). GSC 02293-01331 (, , =10.71) was chosen as the comparison star. The variable, comparison star and sky background were simultaneously monitored in continuous 10-s intervals through a standard Johnson filter throughout the two observing seasons. The typical observational accuracy with the three-channel photometer is 0.005 mag (Zhou 2001). Most of the data have been merged into 60-s bins.
2.2 Strömgren photometry
In 2000 simultaneous photometric observations of UV Tri were carried out using the six-channel spectrograph photometer attached to the 90-cm telescope at the Observatorio de Sierra Nevada (OSN), Granada, Spain (Rodríguez et al. 1997). Additionally, a few data using the Crawford Hβ system were also collected. This colour photometry allows us the determination of the corresponding photometric indices and hence astrophysical parameters for the variable.
During these observations, HD 9483 (=8.1, A3) was used as the main comparison star with HD 9445 (=8.5, F0) and HD 8826 (=8.0, F0) as check stars. The spectral types and colour indices of the three stars locate them inside the instability region of the Sct and/or Dor type pulsators. However, during the observations reported here, no variability was detected for any of the comparison stars within the observational errors.
To transform our data into the standard system we have used the same procedure described in Rodríguez et al. (1997). In the present work 10 standard stars were observed for purposes of calibration. The standard deviations obtained in the transformation equations were 0.011, 0.007, 0.009, 0.009 and 0.008 mag for , , , and , respectively. The results, together with the standard deviations and the number of points collected for each object, are listed in Table 2. As can be seen, our results are in good agreement with those available in the bibliography (Hauck & Mermilliod 1998). Due to the small number of data, points were not merged into the data.
| Set | Night(UT) | JD | Time interval(d) | Points, Filter |
|---|---|---|---|---|
| 1999 | 1999.11.17 | 1500 | 0.1051 | 122, |
| 1999.11.18 | 1501 | 0.1714 | 199, | |
| 1999.11.24 | 1507 | 0.1262 | 133, | |
| 2000 | 2000.01.08 | 1552 | 0.0709 | 89, |
| 2000.01.14 | 1558 | 0.1477 | 95, | |
| 2000.01.29 | 1573 | 0.1210 | 14, | |
| 2000.02.02 | 1577 | 0.1120 | 21, | |
| 2000.02.03 | 1578 | 0.1022 | 20, | |
| 2000.10.24 | 1842 | 0.2948 | 419, | |
| 2000.10.25 | 1843 | 0.3840 | 554, | |
| 2000.10.26 | 1844 | 0.0493 | 72, | |
| 2000.10.29 | 1847 | 0.3687 | 498, | |
| 2000.10.31 | 1849 | 0.4006 | 569, | |
| 2000.11.01 | 1850 | 0.4048 | 584, | |
| 2000.11.02 | 1851 | 0.2333 | 337, | |
| 2000.11.04 | 1853 | 0.2682 | 378, | |
| 2000.11.05 | 1854 | 0.1278 | 123, | |
| 2000.11.06 | 1855 | 0.0424 | 62, | |
| 2000.11.07 | 1856 | 0.0576 | 74, | |
| 2000.11.10 | 1859 | 0.1263 | 176, | |
| 2000.11.11 | 1860 | 0.1882 | 268, | |
| 2000.11.12 | 1861 | 0.3223 | 465, | |
| 2000.11.13 | 1862 | 0.3180 | 459, | |
| 2000.11.14 | 1863 | 0.3569 | 515, | |
| 2000.11.17 | 1866 | 0.3381 | 435, | |
| 2000.11.19 | 1868 | 0.1779 | 235, | |
| 2000.11.20 | 1869 | 0.2842 | 367, | |
| 2001 | 2001.10.17 | 2200 | 0.1013 | 128, |
| 2001.10.18 | 2201 | 0.4138 | 593, | |
| 2001.10.22 | 2205 | 0.2595 | 367, | |
| 2001.11.06 | 2220 | 0.0645 | 94, | |
| 2001.11.07 | 2221 | 0.1209 | 174, | |
| 2001.11.08 | 2222 | 0.1409 | 204, | |
| 2001.11.09 | 2223 | 0.0742 | 108, | |
| 2001.11.22 | 2236 | 0.3403 | 482, |
| Object | |||||
|---|---|---|---|---|---|
| UV Tri | 11.085 | 0.215 | 0.169 | 0.783 | 2.775 |
| (55, 4) | .021 | .015 | .014 | .041 | .016 |
| HD 9483 | 8.091 | 0.116 | 0.161 | 0.985 | 2.835 |
| (91, 7) | 4 | .004 | .005 | .015 | .009 |
| HD 9445 | 8.482 | 0.252 | 0.162 | 0.779 | 2.722 |
| (20, 4) | 4 | .005 | .005 | .015 | .007 |
| HD 8826 | 7.998 | 0.274 | 0.148 | 0.459 | 2.669 |
| (21, 4) | 5 | .004 | .004 | .011 | .012 |
| HD 9483 | 8.06 | 0.120 | 0.141 | 0.979 | 2.838 |
| HD 9445 | 8.50 | 0.255 | 0.167 | 0.788 | 2.717 |
| HD 8826 | 8.01 | 0.267 | 0.163 | 0.456 | 2.671 |
3 Data analysis
3.1 Frequency solution
To find a complete set of pulsation frequencies of UV Tri, we merged all the data collected from 1999 to 2001. The frequency analysis was carried out by using the programmes period98 (Breger 1990; Sperl 1998) and mfa (Hao 1991; Liu 1995), where single-frequency Fourier transforms and multifrequency least-squares fits were processed. The two programmes use the Discrete Fourier Transform method (Deeming 1975) and basically led to identical results. To judge whether or not a peak is significant in the amplitude spectra we followed the empirical criterion of Breger et al. (1993), that an amplitude signal-to-noise (S/N) ratio larger than 4.0 usually corresponds to an intrinsic peak of the variable. Hence the noise levels at each frequency were computed using the residuals at the original measurements with all the trial frequencies prewhitened. Then the confidence levels of the frequencies were estimated following Scargle (1982). Note that the S/N criterion assumes a good spectral window typical of multisite campaigns. However, in the case of single-site observations, the noise level can be enhanced by the spectral window patterns of the noise peaks and possible additional frequencies. Therefore a significant peak’s S/N value might be a little less than 4.0.
First, we need to check the constancy of the comparison star GSC 02293-01331 used in the photoelectric observations. Unfortunately, no differential photometry was made for it. We analysed the amplitude spectrum of the comparison star in the frequency range 0–50 d-1. The data from the 9 photometric nights on 2000 October 24, 25 and 31; November 1, 4, 12, 13, 14 and 20 were thus used. A forced Fourier analysis produced four peaks in the lower frequency region: 3.0125, 2.6722, 4.8577 and 1.7974 d-1 with amplitudes of 0.064, 0.025, 0.020 and 0.019 mag, respectively. We are unable to judge whether these peaks are or not intrinsic to the comparison star depending on their S/N values alone. The first (highest) peak at 3.0 d-1 is due to the atmospheric extinction, which could not be completely corrected in the case of lacking a check star. The other peaks might be mainly attributed to atmospheric or instrumental effects. We keep in mind that caution must be taken in detecting frequencies in the region lower than 4 d-1, as pointed out by Breger (1994), that 0–4 d-1 can be regarded as the garbage heap for observational problems such as incomplete extinction corrections and equipment changes. In order to reduce the low-frequency noise, these four frequencies have been removed from the differential measurements for UV Tri below.
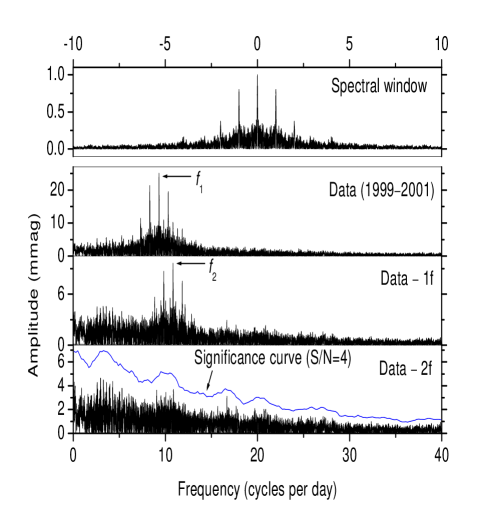
Fourier analyses of all the data for UV Tri show two dominate frequencies at =9.3298 d-1 and =10.8513 d-1, verifying the previous detection (Liu et al. 2001) with an exception of the term at 3.6 d-1. Subsequent analyses of the residuals after prewhitening the two frequencies show that the domain in 0–7 d-1 was highly contaminated. The higher noise in the region lower than 4 d-1 mostly reflects the effects caused by instrumental drifts, atmospheric changes (e.g. irregularities in sky transparency and scintillation noise) and other similar phenomena not caused by the target star. For safety, we stopped searching for pulsation in this lower-frequency region. We have noted the existing aliases in the data by taking into account the integer multiples of 0.00137, 0.033 and 1.0 d-1 corresponding to two-year alias, monthly alias and daily alias, respectively. For the judgement of significant peaks the amplitude spectra and spectral window are shown in Fig. 1, in which each spectrum panel corresponds to the residuals with all the previous frequencies prewhitened. The last panel (‘Data – 2f’) shows the residuals after subtracting the fit of the two outstanding frequencies, together with the significance curve – a spline-connected points – four times the noise points obtained in a spacing of 0.2 d-1. The observational noise is frequency-dependent and it was defined as the average amplitude of the residuals in a range of 1 d-1 (11.57 Hz), close to the frequency under consideration. As a final result, the pulsation frequencies =9.3298 d-1 and =10.8513 d-1 with amplitudes of 0.0254 and 0.010 mag, respectively, are confirmed to be intrinsic to UV Tri. So the variable is currently a biperiodic Sct pulsator. The two frequencies fit the light curves with a standard deviation of =0.013 mag. Fourier parameters of the best-fitting sinusoids are listed in Table 3, where the errors in frequencies, amplitudes and phases were estimated assuming the root-mean-square deviation of the observational noise to be of 0.013 mag, the standard deviation of the fit, through the formulae of Montgomery & O’Donoghue (1999). We used the real nights with data for the time baseline rather than the span of observations, so that the errors would not be underestimated. The differential light curves along with the fit are presented in Fig. 2.
From Figs. 1 and 2, the detection of pulsation frequencies seems not complete. The residual spectrum (‘Data – 2f’ panel in Fig. 1) is still not consistent with white noise. This indicates that other pulsation frequencies are possibly present in the data. Poor fits on some nights, such as HJD 2451842, 2451849 and 2451850, also show this possibility. The region around 10 d-1 might be affected by potential amplitude modulation of and and by additional frequencies very close to . We noted a peak at 16.6862 d-1 () with an amplitude of 0.0031 mag (S/N = 3.4). It is probably a candidate frequency as its height is obviously higher than its neighbour peaks. Inspection of the light curves showed several peculiar cycles on HJD 2451843.1, 2451850.05, 24511851.12, 2451863.2 and 2452201.3, in which irregular portions of the light curves occurred on the ascending branches near the maxima. They were not fitted at all by the two detected frequencies. Fitting by taking into account did not reproduce these unusual cycles and did not improve the goodness of fitting remarkably. We paid close attention to these asymmetric shapes in the light curves because we found them immediately after the end of observations in those nights. These unusual cycles seemed not related with non-photometric conditions, instruments or the comparison star. They are probably real and aperiodic. The effect may be referred to a similar phenomenon of “anomalous cycles” reported by Paparó et al. (2000) in their study of the Sct star 57 Tauri. These authors described the phenomenon as single unusual cycles of light variation with larger amplitude than the surrounding cycles or with asymmetric shapes. Hence the amplitudes are larger than expected from multifrequency solution of the light curve. They also pointed out that another Sct star XX Pyxidis seems to show anomalous cycles. However, Handler (2001) argued that the hypothesis that XX Pyx shows anomalous cycles is quite unlikely. Handler suggested that single anomalous cycles of Sct stars are physically implausible. The possibility of anomalous cycles occurring in pulsating stars should not be dismissed on superficial grounds, but the evidence for it needs to be accumulated and critically scrutinized. The case of anomalous cycles in UV Tri, which needs further observational check, supports the suggestion that the phenomenon is intrinsic to Sct stars. Investigation of possible causes and implications of the anomalous cycles becomes more interesting.

| Freq. | Ampl. | Phase, Epoch | S/N | Conf. | |
|---|---|---|---|---|---|
| ( d-1) | (mmag) | (0–1, days) | (%) | ||
| 9.3298 | 25.37 | 0.096, .015 | 21.2 | 100 | |
| .0001 | .18 | .001, | |||
| 10.8513 | 9.91 | 0.524, .018 | 9.3 | 100 | |
| .0003 | .18 | .001, | |||
3.2 Frequency and amplitude variability
It is possible to search the data for amplitude and/or frequency variability on an annual time-scale for UV Tri. We divided the data into three subsets according to the observing gaps: data set ‘1999’ included measurements collected between 1999 November 17 and 2000 January 14 (5 nights), data set ‘2000’ from 2000 October 24 to November 20 (19 nights), while ‘2001’ for those in 2001 (8 nights). Individual Fourier analyses were then carried out for each subset. However, we are aware that the Fourier results highly depend on the data structure, i.e. the number of data points, sampling rate, time span, etc. Furthermore, Fourier analysis assumes the frequency and amplitude of a signal to be constant in the time domain. Therefore, our results for the time-dependence of frequency and amplitude should be regarded as the averaged values during the investigated period. Given the trial frequency values of =9.3298 d-1 and =10.8513 d-1, non-linear least-squares sinusoidal fit to each data set were made. Our results are presented in Table 4, where the errors were estimated following the methods in previous section. The standard deviations of fit for the three subsets are =0.0115, 0.0118 and 0.0108 mag, respectively. The fitting quality is generally consistent among the three solutions. As can be seen, the two frequencies were constant in 1999–2001 within the calculated errors.
| Subset | Frequency(d-1) | Amplitude(mmag) | Phase(0–1) |
|---|---|---|---|
| 1999 | 9.327.003 | 28.3.7 | .264.004 |
| 10.852.006 | 13.5.7 | .611.008 | |
| 2000 | 9.329.0002 | 26.0.2 | .663.001 |
| 10.847.001 | 10.1.2 | .695.003 | |
| 2001 | 9.328.001 | 24.1.4 | .196.002 |
| 10.855.003 | 9.0.4 | .286.007 |
By fixing the two frequencies =9.3298 d-1 and = 10.8513 d-1 and allowing their amplitudes and phases to change, we obtained the amplitudes of both frequencies for different years’ data. The details are given in Table 5. In the estimated errors range, there is still a difference of the values of the amplitude of between Tables 4 and 5. Other values are basically consistent with each other. One reason causing this difference probably is the shortest data in 1999 because the results in Table 4 are the least-squares optimised values of all three Fourier parameters of the two frequencies. While the results in Table 5 are the optimised values of amplitude and phase when the frequencies are fixed. Compared with the results in Table 3 obtained for the overall data sets, which are shown as the solid line in Fig. 2, the amplitudes calculated in Table 5 are more certain and reasonable than in Table 4. We did not see anomalous cycles in the light curves of 1999. Deviations between fits and light curves are relatively smaller in the 1999 data set than in other two sets. The overall frequency solution is good enough for the 1999 data set. We believe anomalous cycles did not affect the amplitude in 1999. The error for amplitudes in 1999 may be underestimated due to shorter data length. However, even in Table 5, the amplitude of in 1999 is obviously higher than in other two years. In 2000 and 2001, there are many cycles covered by the observations, so we think that a few disturbances (i.e. the anomalous cycles) among so many cycles is not enough to affect the amplitude. Consequently, from Tables 4 and 5 we think that the amplitude of did not change during these three years, but the amplitude of is larger in 1999 than those in 2000 and 2001. In view of the higher noise around 10 d-1 in the amplitude spectra, amplitude variability as a cause cannot be ignored and it deserves further investigation.
| 1999 | 2000 | 2001 | |
|---|---|---|---|
| = 9.3298 | 25.6.7 | 26.1.2 | 24.2.4 |
| =10.8513 | 13.6.7 | 9.7.2 | 9.3.4 |
4 Properties of UV Tri
In this section, we derive the stellar properties of UV Tri.
4.1 Physical parameters from indices
An estimate of stellar physical parameters including absolute magnitude, surface gravity, effective temperature and other quantities can be derived by applying suitable calibrations for photometry. Using the observed colour indices obtained in the present work (Table 2), we can deredden these indices making use of the dereddening formulae and calibrations for A stars given by Crawford (1979). This way, we derive a colour excess of =0.048 mag and the following intrinsic indices: =0.167, =0.185 and c0=0.774 mag. Furthermore, deviations from the zero age main sequence values of =0.009 and c0=0.044 mag are also found. These values suggest this variable to be a normal Population I Sct star with normal abundance in metals and well-situated into the Sct region in the H-R diagram as can be seen from fig. 8 of Rodríguez & Breger (2001). In fact, a value of the mean metal abundance of [Me/H]=0.014 dex (or Z=0.019) can be derived using the calibrations by Smalley (1993) for metallicity of A-type stars with =0.009 mag. We note here that the spectral type of UV Tri, A3, the same as that of V Tri, was estimated by Shaw et al. (1983). No one spectroscopically-determined type is available.
We further derived the effective temperature, surface gravity, bolometric magnitude and radius: K, , mag ( mag) and =1.740.23 R⊙. We used , which is free of interstellar extinction effects, as the independent parameter for measuring temperature (Crawford 1979). The effective temperature and gravity were determined from the model-atmosphere calibrations of photometry by Moon & Dworetsky (1985). The bolometric magnitude was found at normal metal abundance. A bolometric correction, B.C.=0.02 mag, derived from Malagnini et al. (1986) for =7480 K was assumed. The radius value was calculated by the radiation law. For the B.C., Balona (1994) gives 0.050.047 mag for the temperature, so the bolometric magnitude of UV Tri becomes: = 2.490.25 mag ( = 0.900.10). The two values are in agreement within the error range. Following Crawford & Mandwewala (1976) the interstellar reddening is 0.21 mag for the colour excess of =0.048 mag. Consequently, a distance modulus D.M.=8.40.2 mag was obtained.
Moreover, it is possible to gain some insight into the mass and age of this star using the evolutionary tracks of Claret (1995) for solar abundances. In this case, values of an evolutionary mass =1.780.1 M⊙, a bolometric magnitude =2.030.3 mag and an age of 0.890.05 Gyr are found with =7480 K and =4.06. So a mean density of =0.340.14 ☉ was derived. In addition, an asteroseismic mass of 1.63 M⊙ can be derived by using the equation of Arentoft et al. (1998) with =2.46 mag.
The results have been checked against two other calibrations using photometry: firstly, the biparametric calibrations for stellar mass, radius and surface gravity by Ribas et al. (1997) and, secondly, the absolute magnitude calibration by Domingo & Figueras (1999). A good agreement with the above was reached. In addition, our previously calculated values of , and M are also supported by the grids of Smalley & Kupka (1997) with [Me/H]=0.0 and by Balona’s (1994) calibrations. Table 6 summarizes the parameters obtained for UV Tri.
| Parameter | Values (mag) | Parameter | Values |
|---|---|---|---|
| 0.0480.01 | age (Gyr) | 0.890.05 | |
| 0.1670.01 | /M⊙ | 1.780.08 | |
| 0.1850.01 | /R⊙ | 1.740.23 | |
| 0.7740.01 | 0.900.08 | ||
| 0.0090.01 | (K) | 7480150 | |
| 0.0440.01 | 3.8740.009 | ||
| 2.44 0.2 | (dex) | 4.060.06 | |
| 2.46 0.2 | [Me/H] (dex) | 0.0140.1 | |
| D. M. | 8.4 0.2 | 0.340.14 |
4.2 Possible mode identification
Here we try to identify the modes for the two detected frequencies in terms of their pulsation constants and frequency ratio. We also compare them with existing models.
The physical parameters derived above are used to compute the observed pulsation constants related to each frequency by means of the empirical formula of Petersen & Jrgensen pete72 (1972). We obtained =0.053 and =0.046 d for and . The values derived from photometry have an uncertainty of 18 per cent (0.01 d in our case) according to Breger et al. (1999). Taking this and the models of Fitch (1981) into account, and can be identified as modes with =2 and 3, respectively. That is, UV Tri pulsates in low-degree () nonradial gravity () modes of low-order (radial overtone 1). This result is quite interesting because Dor-type stars pulsate in low-degree nonradial gravity modes of high-order and UV Tri locates in the overlapped region of Sct and Dor variables (Handler 1999; Guzik et al. 2000). The mode identifications based upon values rely on the available models, of which the Fitch’s modes are widely used and are effective. On the other hand, the results using solely might be dramatic (Garrido 2000).
In addition, we can also refer the variable to other existing models. The observed frequency ratio =0.86 first rules out at least the existence of two radial modes. According to the empirical period-luminosity-colour relations of Stellingwerf stel79 (1979) and López de Coca et al. lope90 (1990) and adopting =2.46 mag and =7480 K, both and cannot be referred to a radial mode. Referred to the theoretical frequencies as well as frequency ratios of the radial oscillation modes of the 2.2 M☉ model with solar metallicity (Z=0.02) of Viskum et al. visk98 (1998), our derived mean density =0.340.14 does not suggest a radial mode at the values of either or . Furthermore, both frequencies are neither present in the 2.0 M☉ (Z=0.02) model with =0–2 of Templeton et al. temp97 (1997) nor in the models of Breger et al. (1999) for the well-studied Sct star FG Virginis. It is clear that the degree for the two modes is at least nonzero.
Consequently, the oscillation nature of both and is most likely to be purely nonradial. Unfortunately, current data are too few to perform an observational mode identification for the variable. Confirmation for the nonradial nature is needed.
4.3 A pulsation model
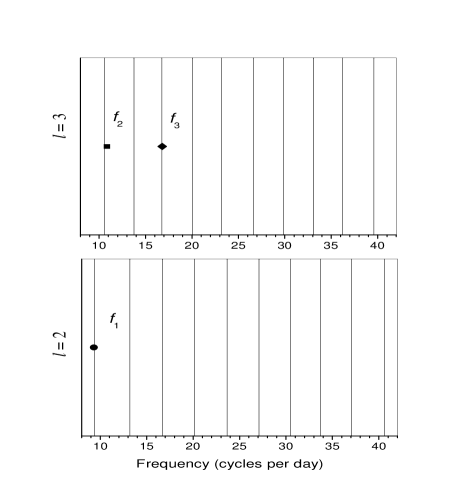
Here we try to construct an asteroseismic model for UV Tri. This model tends to identify the star’s evolutionary phase and pulsation modes. According to the evolutionary status of UV Tri and referring to the asteroseismic mass calculated above, we computed the theoretical pulsation frequencies following the minimal asteroseismological approach (Liu et al. 1999; Breger 2000). A pulsation model, corresponding to the evolutionary stage of = 1.00 and = 3.871 (=7430 K) of 1.65 M☉, was computed using the program developed by Li & Stix (1994). Finally, the computed frequencies were compared to the observed ones and we are led to the results: two theoretical frequencies at 108.25 and 122.22 Hz (i.e. 9.353 and 10.560 d-1), corresponding to =2 and =3 nonradial mode respectively, roughly match the two observed frequencies (107.98 and 125.18 Hz). The theoretical pulsation constants for these two model frequencies are 0.050 and 0.045 d, perfectly agreeing with the observed ones. This model suggests following physical parameters: R=1.95 R☉, age=0.90 Gyr, =7.32 (central temperature), =17.24 (central pressure) and =1.92 (central density). The radius and age conform to those derived for UV Tri in the preceding section. Figure 3 shows the computed frequencies compared with the observed ones. We note that the suspected term has a counterpart (at 16.7 d-1 with =3) in the model frequencies.
5 Discussion and conclusions
We present the data of mainly Johnson and Strömgren uvby for the Sct-type variable UV Tri collected at the Beijing Astronomical Observatory (China) and the Observatorio de Sierra Nevada (Spain). The data were carefully analysed for multiperiodicity and used to derive stellar physical parameters. The two frequencies =9.3298 d-1 and =10.8513 d-1 were detected over a commonly acceptable confidence level, confirming the previous detection. Besides the two dominating frequencies, some other frequencies higher than 8 d-1 as well as noise peaks in 0–7 d-1 domain are visible. Lower-frequency peaks might be caused by incomplete extinction correction between variable and comparison stars and from instrumental shifts. We have no information on the comparison stars’ colours and spectral types. Colour extinction because of different spectral types between the variable and comparison may also be a cause. Another possible reason causing the red noise might be the presence of small amplitude variations of the two frequencies and . Therefore, we gave up period-searching in the lower-frequency region and only considered higher frequencies.
However, the observed light curves could not be well reproduced by the synthetic curves with the two frequencies. There are deviations on some nights. Some data points are undulatory. These mean that additional pulsation frequencies might present in the light curves of the variable. The frequency =16.6863 d-1 is suspected to be intrinsic and is also predicted by the theoretic pulsation model, but confirmation is required because its amplitude is below the confidence level of current detection.
On the other hand, we noted that the poor fit may be resulted from instrumental, atmospheric and other unknown effects. We pointed out the phenomenon of anomalous cycles observed in the light curves of UV Tri similar to that reported for 57 Tau by Paparó et al. (2000) and further scrutinized by Handler (2001). We explored the data for possible reasons. The fact is clear that the two frequencies do not fit these special shapes. The anomalous cycles seemed not to be caused by non-photometric conditions, unstable instruments or the comparison star’s variability. As argued by Handler (2001), intrinsic multiperiodicity or atmospheric/instrumental effects could not explain such a phenomenon. They seem intrinsic but non-periodic. In order to examine the phenomenon and derive any regularity, further observations, especially coordinated multisite observations would be helpful. The use of different instruments will be a good tool for excluding the possibility of an instrumental cause.
We further searched the three-year data for possible frequency and amplitude variability. The pulsation frequencies were constant within the error bars (see Table 4). Table 5 shows the amplitudes in the three years. We think the presence of anomalous cycles had little effect on the amplitudes in 2000 and 2001, while no anomalous cycles were observed in 1999. Within the error ranges, the amplitudes of were constant in 1999–2001. Concerning the shorter data set in 1999, the corresponding amplitudes might be suffered from higher but underestimated errors. However, the amplitude of seemed to increase from 1999 to 2000.
Based on the photometric indices, we derived the physical parameters for UV Tri. UV Tri is a normal Pop. I Sct star with solar abundances evolving on its MS stage before the turn-off point (age=0.890.05 Gyr). The derived photometric properties and stellar parameters are given in Table 6. From these parameters, we calculated the pulsation constants for the two modes. We compared UV Tri to the models calculated for several well-studied Sct stars available in the literature, such as FG Vir, XX Pyx and others, and to the models for radial fundamental and overtone oscillations. All the existing models consistently identify both modes to be nonradial. No trace of a radial mode was found in these models for the observed frequencies of the variable. An attempt of theoretic pulsation modelling made by us refer and to be two nonradial modes with =2 and 3, respectively. The most interesting result is the identification from the models of Fitch (1981), which advises both frequencies to be modes. According to the star’s location in the colour-magnitude diagram (see fig. 8 of Rodríguez & Breger 2001 or fig. 1 of Handler 1999), UV Tri is located in the overlapped portion of the instability regions of Sct and Dor variables. We recall the spectral type A3, used currently for UV Tri, is in fact for its nearby star V Tri (Shaw et al. (1983). Liu et al. (2001) inferred A8 or F0 in terms of a relation of effective temperature, spectral type and absolute magnitude. According to the Morgan-Keenan (MK) types in the []-[] diagram of Strömgren (1966) or the effective temperature-spectral type scales of Fitzpatrick & Garmany (1990), we can refer UV Tri to a type of A8V or F0V. The spectral type helps us further position the star in the colour-magnitude diagram. The possible presence of low-degree gravity mode pulsation tends to suggest UV Tri to be a Sct star pulsating in nonradial modes similar to Dor variables. The possible connection between the Sct and Dor variables has been discussed by Breger & Beichbuchner (1996). These kind of stars would greatly increase the possibility for asteroseismology of both classes of variable star. Furthermore, a Dor star may pulsate in Sct-like -modes. A few other stars with surface abundance peculiarities ( Boötis-type and Am stars) also have been observed that exhibit Dor pulsations. These stars with -mode pulsations offer interesting observational tests for current Dor pulsation-driving mechanisms (Guzik et al. 2000).
Acknowledgments
The authors are very grateful to the anonymous referee for his constructive comments and many small changes made to the English in this paper, which helped to improve the manuscript. This research was funded by the National Natural Science Foundation of China. Eloy Rodríguez acknowledges partial research support from the Junta de Andalucía and the Direccion General de Investigacion (DGI) under project AYA2000-1559.
References
- Arentoft et al. (1998) Arentoft T., Kjeldsen H., Nuspl J., Bedding T. R., Front’o A., Viskum M., Frandsen S., Belmonte J. A., 1998, A&A, 338, 909
- Balona (1994) Balona L. A., 1994, MNRAS, 268, 119
- Breger (1990) Breger M., 1990, Comm. in Asteroseismology, 20, 1 (Univ. Vienna)
- Breger (1994) Breger M., 1994, in Sterken C., de Groot M., eds., NATO ASI Ser. C, Vol. 436, The Impact of Long-term Monitoring on Variable Star Research: Astrophysics, Instrumentation, Data Handling, Archiving. Kluwer, Dordrecht, p. 393
- (5) Breger M., 2000, Baltic Astron., 9, 149
- Breger (1996) Breger M., Beichbuchner F., 1996, A&A, 313, 851
- Breger (1993) Breger M. et al., 1993, A&A, 281, 90
- Breger (1999) Breger M., Pamyatnykh A. A., Pikall H., Garrido R., 1999, A&A, 341, 151
- Claret (1995) Claret A., 1995, A&AS, 109, 441
- Crawford (1979) Crawford D. L., 1979, AJ, 84, 1858
- Crawford (1976) Crawford D. L., Mandwewala N., 1976, PASP, 88, 917
- (12) Deeming T. J., 1975, Ap&SS, 36, 137
- (13) Domingo A., Figueras F., 1999, A&A, 343, 446
- Fitch (1981) Fitch W. S., 1981, ApJ, 249, 218
- (15) Garrido R., 2000, in Breger M., Montgomery M. H., eds., ASP Conf. Ser. Vol. 210, Delta Scuti and Related Stars. Astron. Soc. Pac., San Francisco, p. 67
- (16) Guzik J. A., Kaye A. B., Bradley P. A., Cox A. N., Neuforge C., 2000, ApJ, 542, L57
- (17) Handler G., 1999, MNRAS, 309, L19
- (18) Handler G., 2001, Comm. in Asteroseismology, 140, 6 (Austrian Acad. Sci.)
- (19) Hao J.-X., 1991, Publ. Beijing Astron. Obs., 18, 35
- (20) Hauck B., Mermilliod M., 1998, A&AS, 129, 431
- (21) Jiang X.-J., Hu J.-Y., 1998, Acta Astron. Sinica, 39, 438
- (22) Li Y., Stix M., 1994, A&A, 286, 811
- (23) Liu Z.-L., 1995, A&AS, 113, 477
- (24) Liu Z.-L., Zhou A.-Y., Jiang S.-Y., Liu Y.-Y. and Li Z.-P., 1999, A&AS, 137, 445
- (25) Liu Z. L., Zhou A. Y., Xu D. W., Lu Y., 2000, IBVS, No. 4981
- Liu et al. (2001) Liu Z.-L., Zhou A.-Y., Rodríguez E., 2001, Comm. in Asteroseismology, 140, 52 (Austrian Acad. Sci.)
- (27) López de Coca P., Rolland A., Rodríguez E., Garrido R., 1990, A&AS, 83, 51
- (28) Malagnini M. L., Morossi C., Rossi L., Kurucz R. L. , 1986, A&A, 162, 140
- (29) Michel E., Hernández M. M., Houdek G., Goupil M. J., Lebreton Y., Pérez Hernández F., Baglin A., Belmonte J. A., Soufi F., 1999, A&A, 342, 153
- (30) Montgomery M. H., O’Donoghue D., 1999, Delta Sct Star Newsletter, 13, 28 (Univ. Vienna)
- (31) Moon T. T., Dworetsky M. M., 1985, MNRAS, 217, 305
- (32) Nather R. E., Winget D. E., Clemens J. C., Hansen J. C., Hine B. P., 1990, ApJ, 361, 309
- (33) Pamyatnykh A. A., Dziembowski W. A., Handler G., Pikall H., 1998, A&A, 333, 141
- (34) Paparó M., Rodríguez E., McNamara B. J., Kolláth Z., Rolland A., Gonzalez-Bedolla S. F., S.-Y. Jiang, Z.-P. Li., 2000, A&AS, 142, 1
- (35) Petersen J. O., Jrgensen H. E., 1972, A&A, 17, 367
- (36) Ribas I., Jordi C., Torra J., Giménez A., 1997, A&A, 327, 207
- (37) Rodríguez E., Breger M., 2001, A&A, 366, 178
- (38) Rodríguez E., González-Bedolla S. F., Rolland A., Costa V., López-González M. J., 1997, A&A, 324, 959
- (39) Rodríguez E., López-González M. J., López de Coca P., 2000, A&AS 144, 469.
- (40) Scargle J., 1982, ApJ, 263, 835
- (41) Shaw J. S., Fraquelli D. A., Martins D. H., Stooksbury D. E., 1983, IBVS, No. 2289
- (42) Smalley B., 1993, A&A, 274, 391
- (43) Smalley B., Kupka F., 1997, A&A, 328, 349
- (44) Sperl M., 1998, Comm. in Asteroseismology, 111, 1 (Univ. Vienna)
- (45) Stellingwerf R. F., 1979, ApJ, 227, 935
- (46) Templeton M. B., McNamara B. J., Guzik J. A., Bradley P. A., Cox A. N., Middleditch J., 1997, AJ, 114, 1592 itself
- (47) Templeton M. R., Bradley P. A., Guzik J. A., 2000, ApJ, 528, 979
- (48) Templeton M., Basu S., Demarque P., 2001, ApJ, submitted (astro-ph/0108458)
- (49) Viskum M., Kjeldsen H., Bedding T. R., Dall T. H., Baldry I. K., Bruntt H., Frandsen S., 1998, A&A, 335, 549
- (50) Wei M.-Z., Chen J.-S., Jiang Z.-J., 1990, PASP, 102, 698
- (51) Zhou A.-Y., 2001, A&A, 374, 235
- (52) Zhou A.-Y., Rodríguez E., Liu Z.-L., Du B.-T. 2001, MNRAS, 326, 317