The rich 6 to 9 spectrum of interstellar PAHs ††thanks: Based on observations with ISO, an ESA project with instruments funded by ESA Member States (especially the PI countries: France, Germany, the Netherlands and the United Kingdom) and with the participation of ISAS and NASA.
IR spectroscopy provides a valuable tool for the characterisation and identification of interstellar molecular species. Here, we present 6–9 spectra of a sample of reflection nebulae, HII regions, YSOs, evolved stars and galaxies that show strong unidentified infrared bands, obtained with the SWS spectrograph on board ISO. The IR emission features in this wavelength region show pronounced variations. 1) The 6.2 feature shifts from 6.22 to 6.3 and clearly shows profile variations. 2) The 7.7 complex is comprised of at least two subpeaks peaking at 7.6 and one longwards of 7.7 . In some cases the main peak can apparently shift up to 8 . Two sources do not exhibit a 7.7 complex but instead show a broad emission feature at 8.22 . 3) The 8.6 feature has a symmetric profile in all sources and some sources exhibit this band at slightly longer wavelengths. For the 6.2, 7.7 and 8.6 features, the sources have been classified independently based on their profile and peak position. The classes derived for these features are directly linked with each other. Sources with a 6.2 feature peaking at 6.22 exhibit a 7.7 complex dominated by the 7.6 component. In contrast, sources with a 6.2 profile peaking longwards of 6.24 show a 7.7 complex with a dominant peak longwards of 7.7 and a 8.6 feature shifted toward the red. Furthermore, the observed 6–9 spectrum depends on the type of object. All ISM-like sources and a few PNe and Post-AGB stars belong to the first group while isolated Herbig AeBe stars, a few Post-AGB stars and most PNe belong to the second group. We summarise existing laboratory data and theoretical quantum chemical calculations of the modes emitting in this wavelength region of PAH molecules. We discuss the variations in peak position and profile in view of the exact nature of the carrier. We attribute the observed 6.2 profile and peak position to the combined effect of a PAH family and anharmonicity with pure PAHs representing the 6.3 component and substituted/complexed PAHs representing the 6.2 component. The 7.6 component is well reproduced by both pure and substituted/complexed PAHs but the 7.8 component remains an enigma. In addition, the exact identification of the 8.22 feature remains unknown. The observed variations in the characteristics of the IR emission bands are linked to the local physical conditions. Possible formation and evolution processes that may influence the interstellar PAH class are highlighted.
Key Words.:
Circumstellar matter - Stars: pre-main sequence - HII regions - ISM: molecules; - Planetary nebulae: general - Infrared: ISM: lines and bands1 Introduction
Mid-infrared spectra of many sources are dominated by the well-known emission features at 3.3, 6.2, 7.7 and 11.2 , commonly called the unidentified infrared (UIR) bands (cf. Gillett et al. 1973; Geballe et al. 1985; Cohen et al. 1986). These UIR bands are associated with a wide variety of objects - including HII regions, Post-AGB stars, PNe, YSOs, the diffuse ISM and galaxies - and are generally attributed to polycyclic aromatic hydrocarbon (PAH) molecules (Léger & Puget 1984; Allamandola et al. 1985; Puget & Léger 1989; Allamandola et al. 1989), although the exact molecular identification of the carriers remains unknown. Beyond serving as simple PAH indicators, they can serve as red-shift indicators, as tracers of elemental evolution in external galaxies, as tracers of chemical evolution and can be used to probe environmental conditions within the objects (Genzel et al. 1998; Lutz et al. 1998; Helou 1999; Serabyn 1999; Genzel & Cesarsky 2000; Helou et al. 2000; Joblin et al. 2000; Hony et al. 2001; Vermeij et al. 2002; Verstraete et al. 2001).
The region from 6 to 9 reveals a number of emission features with bands at 5.2, 5.7, 6.0, 6.2, 6.8, ”7.7” and 8.6 . The ”7.7” feature is particularly important as it is the strongest of the interstellar ”UIR” bands and, as such, can be used to probe objects in which the other features are weak.
Until quite recently, most of the interstellar emission bands were considered to be more-or-less invariant in position and profile. Although some minor variations were noted, by and large the 6.2 feature was considered fixed at 6.2 , regardless of the reported shift in peak position by Molster et al. (1996). The ”7.7” band was generally treated similarly in spite of earlier papers showing this band is comprised of at least two variable components (e.g. Bregman 1989; Cohen et al. 1989; Beintema et al. 1996; Molster et al. 1996; Roelfsema et al. 1996; Moutou et al. 1999a, c; Peeters et al. 1999). It was recognised some time ago that the 7.7 complex appears either with a dominant 7.6 component or with the dominant component peaking at 7.8–8 (Bregman 1989; Cohen et al. 1989). In addition, it was found that the former profile is associated with HII regions and the one peaking near 7.8 is associated with planetary nebulae (Bregman 1989; Cohen et al. 1989). Recently, thanks to the high resolution spectra obtained with ISO, more subpeaks of the 7.7 complex were reported near 7.2 to 7.4 and 8.2 (Moutou et al. 1999a, b).
In Sect. 2, our sample and the observations are presented, the data reduction, the influence of extinction and the decomposition of the spectra are discussed. Sections 3.1, 3.2 and 3.3 analyse the 6.2, 7.7 and 8.6 features respectively. The link between the observed variations in the 6.2, 7.7 and 8.6 features and the connection with the type of object is highlighted in Sect. 4. Section 5 presents the observed trends. The spectral characteristics of PAHs in this wavelength range as measured in the laboratory and calculated by quantum chemical theories are summarised in Sect. 6. Section 7 highlights the astronomical implications. Finally, in Sect. 8 our main results are summarised.
2 The data
2.1 Sample
| Source | TDTb | Obs. | Ref. | A | Sp. Typed | G | Object Type | ||
|---|---|---|---|---|---|---|---|---|---|
| (J2000)a | (J2000)a | modec | |||||||
| NGC 253 | 00 47 33.19 | 25 17 17.20 | 24701422 | 01(4) | 1 | - | - | Seyfert Galaxy | |
| W 3A 02219+6125 | 02 25 44.59 | 62 06 11.20 | 64600609 | 01(2) | 2 | 1.5 | O6 | 1E4 | CHII |
| IRAS 02575+6017 | 03 01 31.28 | 60 29 13.49 | 15200555 | 01(2) | 2 | 2 | 1E5 | CHII+YSO | |
| IRAS 03260+3111 | 03 29 10.37 | 31 21 58.28 | 65902719 | 01(3) | 3 | B9 | 2E4 | non-isolated Herbig Ae Be stars | |
| Orion PK1 | 05 35 13.67 | 05 22 08.51 | 68701515 | 01(4) | 4 | 0.15 | O6 | HII | |
| Orion PK2 | 05 35 15.79 | 05 24 40.69 | 83301701 | 01(4) | - | O6 | HII | ||
| OrionBar D8 | 05 35 18.22 | 05 24 39.89 | 69501409 | 01(2) | 5 | O6 | HII | ||
| OrionBar BRGA | 05 35 19.31 | 05 24 59.90 | 69502108 | 01(2) | - | O6 | HII | ||
| OrionBar D5 | 05 35 19.81 | 05 25 09.98 | 83101507 | 01(2) | - | O6 | 5E4 | HII | |
| OrionBar H2S1 | 05 35 20.31 | 05 25 19.99 | 69501806 | 01(4) | 6 | O6 | 7E3 | HII | |
| OrionBar D2 | 05 35 21.40 | 05 25 40.12 | 69502005 | 01(2) | - | O6 | HII | ||
| NGC 2023 | 05 41 38.29 | 02 16 32.59 | 65602309 | 01(3) | 7 | B1.5V | 3E2 | RN | |
| HD 44179 | 06 19 58.20 | 10 38 15.22 | 70201801 | 01(4) | 8 | B8V | 5E6 | Post-AGB star | |
| IRAS 07027-7934 | 06 59 26.29 | 79 38 48.01 | 73501035 | 01(2) | 9 | WC10 | 2E7 | PN | |
| M 82 | 09 55 50.70 | 69 40 44.40 | 11600319 | 01(4) | 1 | - | - | starburst galaxy | |
| HR 4049 | 10 16 07.56 | 28 59 31.31 | 17100101 | 01(2) | 8,10 | B9.5Ib-II | Post-AGB star | ||
| IRAS 10589-6034 | 11 00 59.78 | 60 50 27.10 | 26800760 | 01(2) | 2 | 1.5 | 1E5 | CHII | |
| HD 97048 | 11 08 04.61 | 77 39 18.88 | 61801318 | 01(4) | 11 | 0.12 | A0 | 1.7E4 | non-isolated Herbig Ae Be star |
| HD 100546 | 11 33 25.51 | 70 11 41.78 | 27601036 | 01(1) | 12 | 0.03 | B9Vne | 9E3 | isolated Herbig Ae Be star |
| IRAS 12063-6259 | 12 09 01.15 | 63 15 54.68 | 25901414 | 01(2) | 2 | 1.5 | 1E5 | CHII | |
| IRAS 12073-6233 | 12 10 00.32 | 62 49 56.50 | 25901572 | 01(2) | 2 | 1.5 | O6-O7.5 | 1E6 | CHII/star forming region |
| IRAS 13416-6243 | 13 46 07.61 | 62 58 19.98 | 62803904 | 01(3) | - | Post-AGB star | |||
| circinus | 14 13 09.70 | 65 20 21.52 | 07902231 | 01(4) | 13 | - | - | Seyfert 2 galaxy | |
| HE 2-113 | 14 59 53.49 | 54 18 07.70 | 43400768 | 01(2) | 14 | WC10 | 6E4 | PN | |
| IRAS 15384-5348 | 15 42 17.16 | 53 58 31.51 | 29900661 | 01(2) | 2 | 1.5 | 5E4 | CHII | |
| G 327.3-0.5 | 15 53 05.89 | 54 35 21.08 | 11702216 | 01(1) | - | 38,000 | HII | ||
| IRAS 15502-5302 | 15 54 05.99 | 53 11 36.38 | 27301117 | 01(2) | 2 | 3.1 | 3E6 | CHII | |
| IRAS 16279-4757 | 16 31 38.20 | 48 04 06.38 | 64402513 | 01(3) | 15 | Post-AGB star | |||
| CD -42 11721 (off) | 16 59 05.82 | 42 42 14.80 | 28900461 | 01(2) | 3,16,17 | 0.7 | B0 | non-isolated Herbig Ae Be star | |
| CD -42 11721 | 16 59 06.79 | 42 42 07.99 | 64701904 | 01(2) | 16,17 | 0.4-0.7 | B0 | non-isolated Herbig Ae Be star | |
| IRAS 17047-5650 | 17 00 00.91 | 56 54 47.20 | 13602083 | 01(3) | 9 | WC10 | 5E6 | PN | |
| IRAS 16594-4656 | 17 03 09.67 | 47 00 47.90 | 45800441 | 01(1) | 18 | B7 | Post-AGB star | ||
| IRAS 17279-3350 | 17 31 17.96 | 33 52 49.30 | 32200877 | 01(2) | 2 | 2.2 | 5E3 | CHII | |
| IRAS 17347-3139 | 17 36 00.61 | 31 40 54.19 | 87000939 | 01(3) | 19 | 8E5 | PN | ||
| XX-OPH | 17 43 56.42 | 06 16 08.00 | 46000601 | 01(4) | - | Ape | variable star, irregular type | ||
| Hb 5 | 17 47 56.11 | 29 59 39.70 | 49400104 | 01(3) | 17 | 120,000 | PN | ||
| IRAS 18032-2032 | 18 06 13.93 | 20 31 43.28 | 51500478 | 01(2) | 2 | 1.1 | 2E5 | CHII | |
| IRAS 18116-1646 | 18 14 35.29 | 16 45 20.99 | 70300302 | 06 | 2 | 8E4 | CHII | ||
| GGD -27 ILL | 18 19 12.03 | 20 47 30.59 | 14900323 | 01(2) | 2 | B1 | 1E6 | star forming region | |
| 18 19 12.00 | 20 47 31.10 | 14802136 | 01(2) | 2,20 | |||||
| MWC 922 | 18 21 16.00 | 13 01 30.00 | 70301807 | 01(2) | - | Be | 6E6 | emission-line star | |
| IRAS 18317-0757 | 18 34 24.94 | 07 54 47.92 | 47801040 | 01(2) | 2 | 2.0 | O8 | 1E5 | CHII |
| IRAS 18434-0242 | 18 46 04.09 | 02 39 20.02 | 51300704 | 06 | 21 | 1.6 | O3-O5 | 2E6 | CHII |
| IRAS 18502+0051 | 18 52 50.21 | 00 55 27.59 | 15201645 | 01(2) | 2 | O7 | 1E6 | CHII | |
| HD 179218 | 19 11 11.16 | 15 47 18.58 | 32301321 | 01(3) | 22 | 0.37 | B9 | 2E4 | isolated Herbig Ae Be star |
| IRAS 18576+0341 | 19 00 10.50 | 03 45 47.99 | 32401203 | 01(1) | 23 | 15,000 | 4E3 | LBV | |
| BD +30 3639 | 19 34 45.19 | 30 30 58.79 | 86500540 | 01(3) | 14 | WC9 | 1E5 | PN | |
| IRAS 19442+2427 | 19 46 20.09 | 24 35 29.40 | 15000444 | 01(2) | 2,20 | O7 | 7E6 | CHII | |
| BD +40 4124 | 20 20 28.31 | 41 21 51.41 | 35500693 | 01(3) | 24 | 0.3 | B2V | 1E4 | non-isolated Herbig Ae Be star |
| S 106 (IRS4) | 20 27 26.68 | 37 22 47.89 | 33504295 | 01(2) | 25 | 1.4 | O8 | 2E5 | YSO |
| NGC 7023 I | 21 01 31.90 | 68 10 22.12 | 20700801 | 01(4) | 7 | B3 | 5E2 | RN | |
| CRL 2688 | 21 02 18.79 | 36 41 37.79 | 35102563 | 01(3) | - | F5Iae | 5E3 | Post-AGB star | |
| NGC 7027 | 21 07 01.70 | 42 14 09.10 | 55800537 | 01(4) | 8 | 200,000 | 2E5 | PN | |
| IRAS 21190+5140 | 21 20 44.89 | 51 53 26.99 | 74501203 | 06 | 21 | 0.0 | 6E5 | CHII | |
| IRAS 21282+5050 | 21 29 58.42 | 51 03 59.80 | 05602477 | 01(2) | 8 | O9 | 1E5 | Post-AGB star | |
| IRAS 22308+5812 | 22 32 45.95 | 58 28 21.00 | 17701258 | 01(2) | 2,20 | O7.5 | 1E3 | CHII | |
| IRAS 23030+5958 | 23 05 10.60 | 60 14 40.99 | 75101204 | 06 | - | 0.0 | O6.5 | 8E3 | CHII |
| IRAS 23133+6050 | 23 15 31.39 | 61 07 08.00 | 56801906 | 01(2) | 2 | 0.4 | O9.5 | 3E5 | CHII |
a : Units of are hours, minutes, and seconds, and units
of are degrees, arc minutes, and arc seconds.
b : each ISO observation is given a unique TDT (Target
Dedicated Time) number. c SWS observing mode used
(see de Graauw et al. 1996). Numbers in brackets correspond to the scanning
speed. d see text for details.
References : 1 : Sturm et al. (2000); 2 : Peeters et al. (2002); 3 : Van Kerckhoven et al. (2000);
4 : Rosenthal et al. (1999); 5 : Cesarsky et al. (2000); 6 : Verstraete et al. (2001);
7 : Moutou et al. (1999a); 8 : Beintema et al. (1996); 9 : Szczerba et al. (2001);
10 : Molster et al. (1996); 11 : Van Kerckhoven et al. (1999); 12 : Waelkens et al. (1996);
13 : Moorwood et al. (1996); 14 : Waters et al. (1998); 15 : Tielens et al. (1999);
16 : Benedettini et al. (1998); 17 : Hony et al. (2001); 18 : García-Lario et al. (1999);
19 : Cohen et al. (1999); 20 : Roelfsema et al. (1996) ; 21 : Peeters et al. (1999);
22 : Meeus et al. (2001); 23 : Hrivnak et al. (2000); 24 : Wesselius et al. (1996);
25 : van den Ancker et al. (2000)
The sample includes 57 sources from a wide variety of objects, ranging from Reflection Nebulae (RNe), HII regions, Young Stellar Objects (YSOs), Post-AGB stars, Planetary Nebulae (PNe) to galaxies (see Table 1). We give in Table 1 characteristics of the sources; i.e. the extinction in the K-band, AK, the spectral type of the illuminating source, and an estimate of the incident UV flux density at 1000Å, , at the location where the PAH emission originates in units of the average interstellar radiation field (=1.6 10-6 W/m2, Habing 1968).
For the compact HII regions (CHII) present in our sample, Martín-Hernández et al. (2002a) estimated AK based upon HI recombination lines to be between 0 and 2.7 magn. AK is taken from Cidale et al. (2001) for CD -42 11721, from Miroshnichenko et al. (1999) for HD 179218, from Everett et al. (1995) for Orion Peak1 and from van den Ancker (1999) for IRAS 03260, GGD -27, S 106, HD 97048, BD +40 4124 and HD 100546.
For most sources, the spectral types are taken from Simbad. The spectral type of IRAS 12073 and IRAS 18434 are taken from Kaper et al. (2002a, b, and private communication) and that of IRAS 16594-4656 is from Su et al. (2001). The effective temperatures for Hb 5, NGC7027, IRAS 18576 and G327 are taken from Gesicki & Zijlstra (2000), Latter et al. (2000), Ueta et al. (2001) and Ehrenfreund et al. (1997) respectively.
For the CHII regions and GGD -27 ILL, we have derived values from the observed IR flux and the angular size of the PAH emission region (cf. Hony et al. 2001). This estimate is based on the assumption that all the UV light is absorbed in a spherical shell with the angular diameter of the HII region and re-emitted in the IR. We have used for the size of the HII regions the measured radio sizes. This is reasonable since the PAHs are expected to be destroyed inside the HII region. The IR flux was derived from the LIR given by Peeters et al. (2002) and the radio sizes used are taken from Peeters et al. (2002) and Martín-Hernández et al. (2002b). The G0 values are similar to those derived by Hony et al. (2001) for the sources present in both samples. For the Orion bar, we refer to Tielens et al. (1993) and Joblin et al. (1996) for the given values. We have taken G0 values for the Herbig Ae Be stars from Van Kerckhoven et al. (2002, in preparation) who derived from the UV flux between 6 and 13.6 eV, FUV, and the spatial distribution of the PAHs in the sources. FUV is derived from the observed stellar flux and the known spectral type. CRL 2688 has an effective temperature of 6400K. Hence, the FUV luminosity is 0.04% of the total luminosity of the star. The star’s luminosity and the NIR size are taken from Goto et al. (2002). The FIR flux of IRAS 17347 and IRAS 18576 are obtained by integrating the modified blackbody that is fitted to the SWS spectra. The size of IRAS 17347 and IRAS 18576 are taken from Meixner et al. (1999) and Ueta et al. (2001) respectively. For MWC 922, the diameter is taken from Meixner et al. (1999) and its FIR flux is derived by integrating the combined SWS and LWS spectrum longwards of 20 . For the RNe, PNe and Post-AGB stars not mentioned in this paragraph, the values are taken from Hony et al. (2001).
2.2 Observations
All spectra presented here were obtained with the Short Wavelength Spectrometer (SWS, de Graauw et al. 1996) on board the Infrared Space Observatory (ISO, Kessler et al. 1996). The spectra were taken using the AOT 01 scanning mode at various speeds or the AOT 06 mode, with resolving power () ranging from 500 to 1600. See Table 1 for details of the observations.
2.3 Reduction
The data were processed with the SWS Interactive Analysis package IA3 (de Graauw et al. 1996) using calibration files and procedures equivalent with pipeline version 7.0 or later. Further data processing consisted of bad data removal and rebinning with a constant resolution. The (sub-)features discussed here are present in all available scans.
In case of high fluxes, the obtained spectra can suffer from memory effects. These memory effects can influence the general shape of the continuum as well as the profile of broad features. The sources in our sample for which memory effects are present, are indicated in Table 2. At the time the data reduction was done, no memory correction tool was available. Hence, in case of memory effects, the average of the up and down scans is taken. In order to investigate the influence of memory effects on this study, we analyse the source that suffers the most from memory effects in our sample, i.e. HD 44179, by comparing the up and down scans in the region of interest, i.e. 5.5-9 . Fig. 1 shows the influence on the 6.2 profile. The differences are small, even in this most extreme case. The influence is more severe for the 7.7 complex (Fig. 2). The blue wing of the feature is affected, as well as the relative strength of the 7.6 component. However, the error due to detector memory effects ( 5 %) is less than the uncertainty on the integrated band intensity. It will not hamper the spectral analysis and source classification performed in this paper. Hence, it will not hamper the analysis done in this paper. Recently, a memory correction tool has become available (OLP10) and, as a check, the sources suffering from memory effects have been re-reduced. We found that that memory effects do not alter significantly the band profiles. In order to be consistent with the analysis of the other sources, we did not apply this memory correction.
Two sources in this sample (Orion peak 1 and Orion peak 2) have strong atomic emission lines perched on top of the 6.2 PAH feature. These lines and the PAH feature are easily separated at the resolution of the SWS instrument. The contribution from any line is removed prior to the analysis of the profiles.
2.4 The spectra
Fig. 3 shows spectra of two typical sources to illustrate the spectral detail present. The complete 6–9 spectrum reveals an extremely rich collection of emission features with bands at 6.0, 6.2, 6.6, 7.0, ”7.7”, 8.3 and 8.6 (Beintema et al. 1996; Molster et al. 1996; Roelfsema et al. 1996; Verstraete et al. 1996; Moutou et al. 1999a, c; Peeters et al. 1999; Verstraete et al. 2001). In particular, upon close inspection, some of these features are perched on top of an emission plateau of variable strength. The beginning of this emission plateau seems to be variable and falls longwards of 6 while it extends until 9 .
From the richness of the region, it is clear that several components are present. The well known 7.7 feature consists of two main features at 7.6 and 7.8 plus shoulders at 7.3-7.4, 7.45 and 8.2 . For example, Verstraete et al. (2001) fit the total region with several Lorentzian profiles and Van Kerckhoven et al. (2002, in prep.) fit the 7.7 complex with 4 Gaussians peaking at 7.5, 7.6, 7.8 and 8.0 .
2.5 Decomposition of the spectra
2.5.1 The continuum
The profile of the 6.2 feature in the spectra of all sources is determined by subtracting a local spline continuum or a polynomial of order 1. To assess the sensitivity of the resulting profiles to the continuum choice, two extreme baselines have been defined and subtracted. In general, the influence of the continuum determination on the profile is very small and hence does not change significantly the band profiles nor the source classification performed hereafter. In some sources however, the continuum determination is subject to some freedom. These sources are indicated in Table 2.
The continuum determination around the 7.7 and 8.6 features is quite arbitrary. We choose to draw first a general continuum splined through points from 5-6 and 9-10 and through points near 7 , excluding possible small features in those regions (see Fig. 4, dashed line). In this way, the influence of a silicate absorption feature in some sources (see Table 2) is completely ignored. In addition, to separate and study the individual 7.7 and 8.6 contributions, we have also drawn a continuum under the 7.7 and 8.6 features themselves. This second (local) continuum is determined by taking additional continuum points near 8.3 - between the 7.7 and 8.6 features (see Fig. 4, full line). In this way, an underlying plateau component is defined.
Other ways of decomposing the broad, blended bands and determining the underlying continuum will yield other results. In particular, for different bandshapes (Gaussian, Lorentzian, etc.), different continua and profile parameters (central wavelength and FWHM) are obtained (Boulanger et al. 1998; Uchida et al. 2000). However, these differences will affect all sources in a systematic way and while this will influence the profiles of the derived features, this will not affect the source-to-source variations we follow.
2.5.2 Extinction
Extinction can have a serious effect on the apparent PAH spectrum (Spoon et al. 2002, see also Fig. 5). In particular, with increasing optical depth of the silicate absorption feature, the 8.6 feature is decreased tremendously (see Fig. 5). To asses the influence of extinction on the band profiles and their intensities, the ”standard” extinction law (Draine 1985; Mathis 1990; Martin & Whittet 1990) is applied to a template PAH spectrum. This template spectrum is obtained by a continuum divided spectrum of a source suffering no extinction. From the resulting spectrum, the band profiles and band intensities were derived in the same way as for the sources considered in this paper (see Fig. 5). Although the full PAH spectrum changes significantly with increasing AK, the normalised 6.2, 7.7 and 8.6 band profiles derived with the above discussed continuum determination are hardly affected by the applied extinction, largely because the extinction is quite grey over this wavelength region. But, the derived intensities and hence their ratios are certainly influenced. For this work, no extinction correction has been applied.
Five sources show water ice absorption at 6.0 (see Table 2) and hence the profile of the 6.2 feature can be influenced. In view of the profile of the water ice band, its influence would be expected to be strongest on the blue side of the 6.2 feature. However, the ice absorption is very small in our sources and the 6.2 band is situated in the red non-steep wing of the water band. Therefore, its influence on the 6.2 band profile (FWHM and peak position) is negligible (see Spoon et al. 2002).
2.5.3 Normalisation of the profiles
For comparison, the 6.2 profiles shown in Figs. 6, 7, 8, 9, 10 and 11 are scaled in such a way that the integrated flux within the profile is equal to 1. In this normalization procedure, the lower limit (6.1 ) is chosen so as to exclude the 6.0 emission feature, while the upper limit is determined by the most extreme end of the feature (i.e. 6.6 ). Analogously, the 7.7 band profiles shown in Figs. 13, 14, 15 and 16 were normalised so that the total flux from 7.2 to 8.2 equals one. For the sources IRAS 17347, IRAS 07027, He2-113 and HD 100546, we normalised the spectra so that the total flux from 7.2 to 8.35 equals one in order to cover the 7.7 complex completely. The 8.6 band profiles were normalised so that the total flux from 8.2 to 8.9 equals one.
3 The band profiles
In this section, we show how the various types of PAH emission spectra found in our sample can be rationalised into spectral classes which correspond to different band profiles. This is done independently for the three main features in the 6–9 region : the 6.2, 7.7 and 8.6 bands. Note however that there is some variability of the band shapes within a single class.
3.1 The 6.2 m feature
In this section, we classify the 6.2 bands present in our sample. In addition, a decomposition of the band profile into two symmetric components is discussed.
3.1.1 The profile of the 6.2 m feature
The sources show a pronounced 6.2 feature, sometimes preceded by a weak feature at about 6.0 m. The emission profiles of the 6.2 feature are distinctly asymmetric with a steep blue rise and a red tail (see Fig. 6). Although the profile of the 6.2 feature is similar for all the sources, when examined in detail significant differences become apparent. A definite range in peak positions is present in our sample, varying between 6.19 and 6.29 m (see Fig. 7). The width also varies. The peak positions and FWHM values for all sources are given in Table 2. Perusing the derived profiles, we recognise three main classes, which we will designate by A, B, and C.
First, the majority of the 6.2 bands peak between 6.19 and 6.23 m. This group will be referred to as class A. Note that the strength of the red tail relative to the peak strength, and hence the FWHM, varies within this class (see bottom panel of Fig. 6). Furthermore, the top of the profile can be peaked or rounded off (see top panel of Fig. 6).
Second, the remaining sources have peak positions that range up to 6.29 m. We define members of class B as those having profiles with a peak position between 6.235 and 6.28 (see Table 2 and Fig. 7 and 8). In general, the profiles of class B have a larger FWHM compared to those of class A.
Class B can be further subdivided. In particular, the peak position of MWC 922 is shifted toward longer wavelengths compared to class A but it has a similar profile. Other members in this group (B1) contain profiles which show a more pronounced red tail than MWC 922 (see Fig. 8). These variations parallel those in class A. Class B2 is represented by HD 44179 in Fig. 7. Their profile is clearly less red-shaded compared to class B1 (and class A). Note that the profile of HD 44179 shows substructure: one can distinguish a blue shoulder. As can be seen from Fig. 8, the first ’component’ occurs at the peak position of class A. This is the only source where substructure is revealed so clearly. In contrast to the previous classes (B1 and A), no variations occur in the relative strength of the red tail within this group. Class B3 (exemplified by IRAS 17347 in Fig. 7) clearly lacks emission before 6.23 and has a somewhat higher peak-to-red-tail ratio than B2 sources. This subdivision of group B is somewhat arbitrary. Examining Fig. 7, there seems to be a gradual progression of the peak position to the red from bottom to top.
Third, IRAS 13416 shows a different profile peaking at 6.29 m. We classify objects with this last profile as belonging to class C. Although the emission band in this source is very weak and noisy, it is clear that the profile is more symmetric than in other classes and its FWHM is the smallest found in our sample. The ’6.2 ’ band in CRL 2688 peaks at 6.29 and exhibits the same profile as IRAS 13416. Hence, this source is classified as a member of class C (see Fig. 9).
| Source | 6.2 feature | 7.7 complex | 8.6 feature | I7.6/I7.8c | I7.6/I6.2c | Re | |||||
|---|---|---|---|---|---|---|---|---|---|---|---|
| fam. | peak pos. | FWHM | I2a | fam. | peak pos. | fam. | peak pos.b | ||||
| [] | [10-2 ] | % | [] | [] | |||||||
| NGC 253‡ | A | 6.2120.010 | 13.40.5 | 4112 | A′ | 7.6110.013 | A′′ | 8.59 | 1.020.14 | 0.890.13 | 0.58 |
| W 3A† | A | 6.2230.017 | 11.10.3 | 364 | A′ | 7.6260.005 | A′′ | 8.60 | 1.840.37 | 1.500.21 | 0.34 |
| IRAS 02575†,♯ | A | 6.2270.008 | 13.32.2 | 392 | A′ | 7.6960.108 | A′′ | 8.60 | 0.850.12 | 0.960.14 | 0.34 |
| IRAS 03260 | A | 6.2160.010 | 13.20.2 | 342 | A′ | 7.6220.027 | A′′ | 8.60 | 1.560.22 | 0.980.14 | 0.78 |
| Orion PK1†,♯ | A | 6.2070.006 | 12.50.5 | 412 | A′ | 7.6370.015 | A′′ | 8.60 | 1.430.20 | 1.150.16 | 0.37 |
| Orion PK2♯ | A | 6.2150.006 | 12.40.6 | 362 | A′ | 7.6320.006 | A′′ | 8.60 | 1.350.20 | 1.100.16 | 0.33 |
| Or.Bar D8 | A | 6.2060.017 | 15.20.2 | 412 | A′ | 7.6270.010 | A′′ | 8.61 | 1.320.42 | 0.930.20 | 0.56 |
| Or.Bar BRGA | A | 6.2220.016 | 12.20.3 | 393 | A′ | 7.6350.007 | A′′ | 8.62 | 1.320.19 | 0.930.13 | 0.67 |
| Or.Bar D5 | A | 6.2250.006 | 12.40.2 | 442 | A′ | 7.6340.007 | A′′ | 8.61 | 1.350.38 | 0.930.18 | 0.80 |
| Or.Bar H2S1 | A | 6.2120.011 | 12.20.1 | 412 | A′ | 7.6270.010 | A′′ | 8.61 | 1.470.29 | 0.940.13 | 0.70 |
| Or.Bar D2 | A | 6.2170.016 | 11.71.6 | 4410 | A′ | 7.6190.027 | A′′ | 8.62 | 1.150.34 | 0.730.14 | 0.52 |
| NGC 2023 | A | 6.2140.010 | 11.01.0 | 395 | A′ | 7.6090.069 | A′′ | 8.59 | 1.560.30 | 0.830.12 | 1.14 |
| HD 44179⋆,♭ | B2 | 6.2680.007 | 17.60.4 | 597 | B′ | 7.8590.012 | B′′ | 8.67 | 0.420.10 | 0.440.10 | 0.28 |
| IRAS 07027 | B2/3 | 6.2680.006 | 16.01.4 | 663 | B′ | 7.9210.041 | B′′ | 8.67 | 0.300.13 | 0.360.15 | 0.30 |
| M 82†?,‡ | A | 6.2100.001 | 13.30.7 | 442 | A′ | 7.6260.008 | A′′ | 8.61 | 1.080.15 | 0.900.13 | 0.74 |
| HR 4049∘,♭ | B2 | 6.2600.009 | 15.20.6 | 613 | B′ | 7.8690.037 | B′′ | 8.67 | 0.170.05 | 0.220.07 | 0.11 |
| IRAS 10589†? | A | 6.2230.010 | 9.40.3 | 338 | A′ | 7.6300.008 | A′′ | 8.62 | 1.300.18 | 1.200.17 | 0.60 |
| HD 97048 | A | 6.2210.010 | 13.80.3 | 3414 | AB′ | A′′ | 8.62 | 0.750.11 | 0.750.11 | 0.32 | |
| HD 100546 | B | 6.2510.022 | 13.11.0 | 493 | B′ | 7.9030.136 | B′′ | 8.66 | 0.360.10 | 0.410.11 | 0.27 |
| IRAS 12063† | A | 6.2170.011 | 11.50.1 | 422 | A′ | 7.6260.024 | A′′ | 8.59 | 1.200.17 | 1.220.17 | 0.43 |
| IRAS 12073 | A | 6.2050.005 | 10.71.6 | 303 | A′ | 7.6260.040 | d | - | 1.560.26 | 1.770.25 | 0.07 |
| IRAS 13416∘ | C | 6.2990.015 | 8.71.3 | 100 | C′ | 8.1990.059 | C′′ | - | - | - | 0.21 |
| circinus†,‡ | A | 6.2100.014 | 10.02.5 | 3310 | A′ | 7.6160.014 | A′′ | 8.60 | 0.880.12 | 1.030.15 | 0.22 |
| HE 2-113 | B2 | 6.2550.007 | 16.70.4 | 649 | B′ | 7.9130.043 | B′′ | 8.63 | 0.350.13 | 0.310.12 | 0.29 |
| IRAS 15384† | A | 6.2220.005 | 13.60.1 | 413 | A′ | 7.6180.015 | A′′ | 8.61 | 1.400.22 | 1.210.17 | 0.71 |
| G 327† | A/B1 | 6.2280.025 | 14.61.0 | 414 | A′ | 7.6190.028 | A′′ | 8.59 | 1.310.19 | 1.140.16 | 0.70 |
| IRAS 15502† | A | 6.2110.008 | 10.20.8 | 392 | A′ | 7.5890.027 | d | - | 1.500.22 | 1.140.16 | 0.54 |
| IRAS 16279 | A | 6.2190.017 | 19.00.3 | 432 | A′ | 7.6330.031 | A′′ | 8.60 | 0.850.13 | 0.770.11 | 0.33 |
| IRAS 16594 | A | 6.2270.029 | 14.32.2 | 399 | A′ | 7.6210.035 | A′′ | 8.59 | 1.320.20 | 0.650.09 | 0.26 |
| CD -42 11721(off)†? | A | 6.2240.008 | 12.50.4 | 396 | A′ | 7.6120.020 | A′′ | 8.60 | 1.510.21 | 0.930.13 | 0.84 |
| CD -42 11721†? | A | 6.2120.014 | 13.00.2 | 362 | A′ | 7.6090.016 | A′′ | 8.60 | 1.630.23 | 1.120.16 | 0.26 |
| IRAS 17047⋆,♭ | B1 | 6.2460.012 | 17.10.8 | 543 | B′ | 7.8300.026 | B′′ | 8.64 | 0.520.10 | 0.420.08 | 0.16 |
| IRAS 17279† | A | 6.2150.005 | 12.20.4 | 302 | A′ | 7.6220.023 | A′′ | 8.60 | 1.120.16 | 0.890.13 | 0.89 |
| IRAS 17347 | B3 | 6.2590.011 | 11.04.7 | 648 | B′ | 7.9720.033 | B′′ | 8.70 | 0.160.08 | 0.250.12 | 0.45 |
| XX-OPH∘ | B3 | 6.2700.027 | 14.54.7 | 623 | B′ | 7.8480.052 | B′′ | 8.66 | 0.270.07 | 0.230.06 | 0.11 |
| Hb 5◁ | A | 6.2230.029 | 13.02.7 | 342 | - | - | A′′ | 8.61 | 0.900.13 | 0.620.09 | 0.39 |
| IRAS 18032† | A | 6.2090.016 | 11.80.2 | 343 | A′ | 7.6130.016 | A′′ | 8.60 | 1.190.17 | 1.250.18 | 0.82 |
| IRAS 18116†? | A | 6.2270.007 | 11.31.4 | 414 | A′ | 7.6300.009 | A′′ | 8.60 | 1.170.17 | 0.880.12 | 0.73 |
| GGD-27 ILL†,♯ | A | 6.2050.009 | 13.10.8 | 386 | A′ | 7.6030.010 | A′′ | 8.60 | 1.150.16 | 1.510.21 | 0.57 |
| MWC 922♭ | B1 | 6.2430.006 | 13.30.2 | 448 | A′ | 7.6650.030 | ♮ | 8.62 | 0.730.10 | 0.670.09 | 0.17 |
| IRAS 18317† | A | 6.2240.006 | 13.30.6 | 412 | A′ | 7.6340.007 | A′′ | 8.59 | 1.290.19 | 1.040.15 | 0.62 |
| IRAS 18434† | A | 6.2150.003 | 12.10.4 | 432 | A′ | 7.6370.010 | ♮ | - | 1.510.21 | 0.770.11 | 0.34 |
| IRAS 18502† | A | 6.2140.022 | 16.00.6 | 445 | A′ | 7.6230.020 | A′′ | 8.59 | 1.020.15 | 1.070.15 | 0.85 |
| HD 179218 | B1/2 | 6.2570.032 | 18.63.0 | 543 | B′ | 7.7860.126 | B′′ | 8.65 | 0.270.04 | 0.250.04 | 0.20 |
| IRAS 18576∘ | B1 | 6.2490.027 | 12.20.3 | 478 | A′ | 7.6530.084 | A′′ | 8.58 | 0.860.12 | 0.740.10 | 0.59 |
| BD +30 3639♭ | B1 | 6.2390.008 | 14.00.6 | 463 | B′ | 7.8420.009 | B′′ | 8.64 | 0.340.05 | 0.380.05 | 0.32 |
| IRAS 19442†,♯? | A | 6.2180.008 | 13.60.3 | 442 | A′ | 7.6140.019 | A′′ | 8.61 | 1.300.18 | 1.040.15 | 0.64 |
| BD +40 4124 | A | 6.2030.011 | 9.80.5 | 201 | A′ | 7.6030.034 | A′′ | 8.60 | 1.800.31 | 1.130.16 | 0.16 |
| S 106 (IRS4)† | A | 6.2100.014 | 13.90.3 | 414 | A′ | 7.6210.016 | A′′ | 8.61 | 1.430.20 | 1.050.15 | 0.30 |
| NGC 7023I | A | 6.2130.013 | 13.41.4 | 4110 | A′ | 7.5980.022 | A′′ | 8.60 | 1.880.35 | 0.830.12 | 1.11 |
| CRL 2688♭ | C | 6.2900.015 | 11.11.2 | 985 | C′ | 8.2020.062 | C′′ | - | - | - | 0.12 |
| NGC 7027⋆,♭ | A | 6.2130.002 | 15.60.2 | 443 | B′ | 7.8140.001 | B′′ | 8.64 | 0.640.09 | 0.420.06 | 0.33 |
| IRAS 21190 | A | 6.2100.001 | 11.61.6 | 363 | A′ | 7.6120.024 | A′′ | 8.61 | 1.560.23 | 0.770.11 | 0.41 |
| IRAS 21282 | A | 6.2130.005 | 14.60.2 | 445 | AB′ | A′′ | 8.62 | 0.640.09 | 0.610.09 | 0.41 | |
| IRAS 22308 | A | 6.2050.010 | 13.40.2 | 375 | A′ | 7.6140.023 | A′′ | 8.61 | 1.400.20 | 1.120.16 | 0.93 |
| IRAS 23030 | A | 6.2050.014 | 11.02.1 | 326 | A′ | 7.6250.054 | A′′ | 8.60 | 1.210.20 | 1.020.14 | 0.55 |
| IRAS 23133 | A | 6.2170.004 | 11.90.5 | 392 | A′ | 7.6310.011 | A′′ | 8.60 | 1.200.17 | 0.930.13 | 0.84 |
a: intensity fraction of comp. 2 (see Sect. 3.1.2);
b: peak position derived by fitting a Gaussian to the profile. The
error on the position is dominated by the error on the continuum
and is 0.015;
c: based upon the Gaussian fit to the 7.7 complex (see
Sect. 3.2);
e: PAH/cont [6-9 ] (see Sect. 5)
d: feature detected;
◁: strong [NeVI] present on top of the 7.6
feature, and hampers the determination of the position;
⋄: the peak intensity of the 7.6 and 7.8 features are
equal within the estimated error;
♮: sources with an unusual 8.6
feature (see Sect. 3.3);
⋆ and ♭: sources suffering from memory effects at
resp. 6 and 7-9 ;
♯: water ice absorption (6 ) present;
†: silicate absorption (9.7 ) present;
∘: freedom in cont. determination at 6 ;
‡: redshifted corrected. Redshifts are taken from the NASA/IPAC
Extragalactic Database.
We did not detect in our sample the 6.35 band reported by Verstraete et al. (1996) in the HII region of M17-SW. In fact, a closer inspection of this data suggests that the 6.35 feature is the result of a cosmic ray hit on the SWS detectors. Therefore, we do not include the 6.35 band in our analysis.
3.1.2 Decomposing the 6.2 feature
Because the peak position seems to gradually and smoothly increase, we hypothesise that all profiles of class B consist of a combination of two components with extreme peak position; one profile of class A and one profile with the other extreme peak position at 6.29 m, class C. For this two component analysis, we have adopted IRAS 18434 as component 1 and IRAS 13416 as component 2. In order to fit a combination of these two components, we interpolated all spectra on the same wavelength grid of resolution 500. All profiles of class B are in general well fit by this procedure (see Fig. 10). However, we note that for B2/3 spectra, the fit starts slightly short-wards of the observed profile. The only exceptions are MWC 922 and IRAS 17347 which show some subtle differences (see Fig. 7). Longwards of 6.3 , MWC 922 is fit well by component 1 and component 2 seems to be absent. However, the peak of MWC 922 is shifted towards the red with respect to component 1. IRAS 17347 exhibits a similar profile as component 2 with slightly more emission on the blue wing. However, the profile of IRAS 17347 is shifted to the blue compared to component 2.
In fact, the component 1 profile we defined above (IRAS 18434) may already include some contribution of component 2 (IRAS 13416). To investigate this case, we have subtracted a scaled component 2 from the profile of IRAS 18434 (the adopted component 1); a symmetrical profile remains peaking at 6.21 and with a FWHM of 0.09 (see Fig. 11). Applying this method to all sources, the same symmetrical profile remains for all sources. Hence, it is possible that the two intrinsic profiles are this derived symmetric component and the intrinsically symmetric profile of component 2. The fraction of component 2 varies from source to source (see Table 2) covering the full range from 20 to 100 %. The systematic uncertainty due to the imperfect template spectra can be estimated by degrading the resolution of the template and the fitted sources from 500 to 100 and is found to be 5%. Based upon independent analysis of the up and down scans, we have also estimate the uncertainty in the fitting procedure associated with statistical noise. In Table 2 we quote the statistical uncertainty, unless it is less than this estimated systematic uncertainty. Obviously, a strong correlation is present between the fraction of component 2 and the peak position of the profile (see Fig. 12). The two sources whose detailed profile deviates the most in this procedure (MWC 922 and IRAS 17347), still agree well with the observed trend. It is noteworthy that no source in our sample shows this ”derived” symmetric profile. One source, which we excluded because of its strong ice and silicate absorption features, does exhibit a 6.22 profile which closely resembles this derived symmetric profile. It will be discussed in a forthcoming paper (Peeters et al. 2002, in prep.). Furthermore, BD+40 4124 does exhibit a symmetric profile but slightly redshifted with respect to the profile derived through the present decomposition procedure.
3.2 The 7.7 band
Although the profile of the 7.7 complex seems similar for most sources, as with the 6.2 band, significant differences become apparent when this complex is examined in detail. Typically, this band shows major subfeatures at 7.6 and 7.8 m (cf. Figs. 3 and 13) with possible minor subfeatures near 7.3 to 7.4, 8.0 and 8.2 . A definite range in relative strength of the 7.6 versus 7.8 component is present in our sample, going from a dominant 7.6 component toward a dominant component peaking longwards of 7.7. Furthermore, the 7.7 complex shifts as a whole. In particular, when the 7.6 component is not dominant, the peak position of the whole complex varies from 7.79 to 7.97 . Whether the peak position of the minor 7.6 component also varies in the latter case, cannot be determined from the present dataset since it is then situated in the wing of the dominant component. In this paper, we will make a distinction between those 7.7 complexes with peak position shortwards of 7.7 , referred to as dominated by the so-called 7.6 component and those 7.7 complexes with peak position longwards of 7.7 referred to as dominated by the so-called 7.8 feature. This does not necessarily imply that the apparent shift in peak position is due to a shift of the component itself but can also be due to a different relative strengths of the various components giving rise to the total 7.7 complex. The derived peak positions of the 7.7 complex are given in Table 2.
Perusing the derived profiles, we recognise four main spectral classes, which we will designate by A′, B′, AB′ and C′. This classification is based upon the relative strength of the 7.6 and 7.8 features. Sources where the 7.6 feature is dominant, group in class A′; class B′ contains sources which show a stronger 7.8 feature; class AB′ groups those sources where the 7.6 and 7.8 have equal strength. Two sources do not show a 7.7 complex and hence form class C′.
When looking in detail at the normalised profiles of class A′, it is clear that almost all sources have the same profile. Fig. 13 shows the possible variations within this class. Orion Peak1, Orion Peak2, NGC 7023 and NGC 2023 show extra emission between 7.2 and 7.4 . NGC 2023 has also a more pronounced Ip 7.6/Ip 7.8 ratio. IRAS 16279 shows extra emission on the red wing compared to the typical profile of class A′, indicating a contributor near 8.0 . MWC 922 is slightly redshifted as well. The latter two sources also show a less pronounced ratio of the peak intensities of the 7.6 and 7.8 features.
Two sources, HD 97048 and IRAS 21282, have an equally strong 7.6 and 7.8 feature (see Fig. 14) and form class AB′. IRAS 21282 is also redshifted compared to the typical profile of class A′, while HD 97048 has extra emission at the red wing near 8.0 compared to class A′.
Class B′ contains a collection of many different profiles (see Fig. 15). All of them are redshifted by different amounts compared to the typical profile of class A′. The so-called 7.8 feature moves from 7.72 towards 7.97 . The strength of the 7.6 feature shows large variations (cf. NGC 7027 versus IRAS 17347). Whether the 7.6 feature behaves in a similar way as the so-called 7.8 feature concerning peak position, is difficult to say since it is situated in the wing of the 7.8 feature.
Two sources, CRL 2688 and IRAS 13416, show no 7.7 complex and
no 8.6 feature (see § 3.3) but instead exhibit a
similar broad emission feature peaking at 8.22 (see Fig.
17). These two form group C′.
A detailed fit to the profile can be obtained by fitting the total region with, for example, several Lorentzian profiles (Verstraete et al. 2001). Here we want to obtain an estimate of the relative flux contributions of the 2 main components rather than to fit the profile. In order to quantify these variations in the relative strength of the 7.6 and the so-called 7.8 features, two Gaussians are fit to the 7.6 and the 7.8 features respectively. In a first attempt, the position and the width of these Gaussians are fixed to (7.6) = 7.58 , FWHM(7.6) = 0.28 and (7.8) = 7.82 , FWHM(7.8) = 0.32 . For most sources, this works quite well (see Fig. 16). The peak intensity of the 7.6 band for class A′ and the sharpness of the top of the 7.7 complex is however not well reproduced in all cases (see top panel of Fig. 16). With this method, the extra emission present in four sources (Orion Peak 1, Orion Peak 2, NGC 2023 and NGC 7023) on the blue side of the 7.7 complex is ignored (see middle panel of Fig. 16). In the cases of a few shifted 7.7 complexes, no good fit is obtained (i.e. for HD 100546, HD 44179, He 2-113, BD +30, IRAS 17047, IRAS 07027, IRAS 17347). For these sources, a new fit is made in which the position of the 7.8 Gaussian is treated as a free parameter. The FWHM of the two Gaussians is kept fixed although - for a single source - it might give a better fit if the FWHM were a free parameter. However, to make a consistent comparison between sources, we kept the bandwidths constant. The relative strength of the 7.6 versus 7.8 feature as well as the intensity ratio of the 7.6 to the 6.2 feature are summarised in Table 2. Class C′ is excluded since it has no 7.7 complex. Based upon independent analysis of the up and down scans, we estimate the uncertainty in the fitting procedure associated with statistical noise to be generally less then 10%. An estimate of the systematic uncertainty on the integrated fluxes can be obtained by applying a different fit procedure and comparing to our present 2-component decomposition. For that reason, we fitted the 7.7 complex with 4 Gaussians peaking at 7.5, 7.6, 7.8 and 8.0 (Van Kerckhoven et al. 2002, in prep.). The strength of the combined 7.5 and 7.6 Gaussians in this method can be compared to that of the 7.6 component applied here. Likewise, the combined 7.8 and 8.0 Gaussians in this method can be compared to the 7.8 component applied here. This 4-component method provide better fits to the spectra with obvious 7.5 components (cf. Fig. 16, middle panel). However, in general, the differences between the two methods are small. Hence, these intensity ratios are affected by systematic and statistical uncertainties. In Table 2, we quote the larger of these two.
Sources dominated by the 7.6 feature, always exhibit a 7.8 feature. In contrast, sources with a dominant 7.8 feature, do not always have a clear and distinctive 7.6 component. Especially, for sources where the 7.8 feature peaks at the longer wavelength end, the 7.6 feature is extremely weak - if present (e.g. IRAS 17347). Sources exhibiting the broad emission feature at 8.22 do not show a 7.7 complex at all (see Fig. 17).
3.3 The 8.6 feature
The 8.6 profile derived with the chosen continuum is clearly symmetric for all sources (see Fig. 17) and all of them have the same FWHM. Analogous to the 6.2 and 7.7 , a definite range in peak positions is present in our sample (see Fig. 17). Perusing the derived profiles, we define 3 main spectral classes A′′, B′′ and C′′. Sources with peak position ranging from 8.58 to 8.62 group in class A′′, sources with peak position longwards of 8.62 group in class B′′. CRL 2688 does not exhibit a 8.6 feature and forms group C′′. IRAS 13416 shows a weak feature near 8.6 (see Fig. 17). Careful examination of the independently reduced up and down scans show that this feature is only present in one of the two scans. Hence, we classify this source in group C′′. Table 2 gives the class and the peak position derived by fitting a Gaussian to the profile. This classification relies heavily on the adopted continuum. When taking the general continuum (see Fig. 4, dashed line) instead of the local continuum (see Fig. 4, full line) to derive the profiles, the peak position of the 8.6 feature shifts for all sources slightly toward the blue. As a result, the definition of the three classes changes slightly. Two sources previously classified in class B′′ now belong to class A′′ (i.e. NGC 7027, HD 100546). However, most sources remain in their distinct classes. Since the presence of a silicate absorption feature has no major influence on the 8.6 profile (see Fig. 5 and Sect. 2.5.2), the results discussed here are valid for all sources.
MWC 922 shows an exceptionally strong 8.6 feature. One HII region, IRAS 18434, has a similarly strong 8.6 feature. The latter source has a strong silicate absorption band but correction for the silicate absorption will make this band even stronger (see Fig. 5). A detailed study of these sources will be presented in Hony et al. (2002, in prep.) and Peeters et al. (2002, in prep.) respectively.
4 The classes
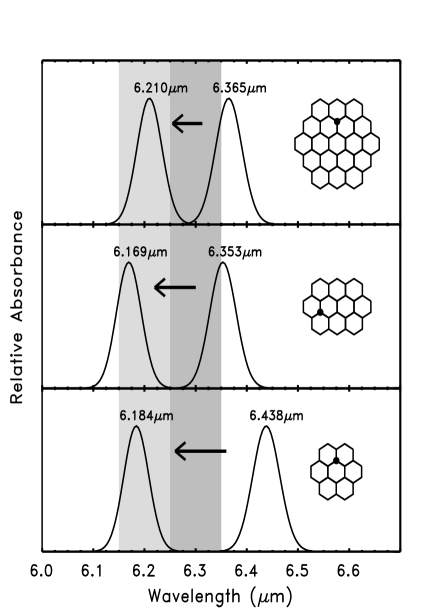
In the previous sections, an independent study of the 6.2, 7.7 and 8.6 features was made for our sample. For each of the features, different classes were determined. Comparing those classes, an interesting finding is made. The class classification of the different bands correlate. This is illustrated in Fig. 17. Sources with a 6.2 feature belonging to class A, have a 7.7 complex peaking at 7.6 (class A′) together with a class A′′ 8.6 feature and are referred to as class sources; while for those with a class B 6.2 feature, the 7.7 complex is dominated by the so-called 7.8 component (class B′) and their 8.6 feature is shifted toward the red (class B′′). The latter sources are referred to as class sources. The two sources showing a single 6.3 feature (class C) exhibit neither a 7.7 complex nor an 8.6 feature (class ). Instead, both sources show a broad emission feature at 8.22 m. The two sources with an equally strong 7.6 and 7.8 subfeature (i.e. class AB′), IRAS 21282 and HD 97048, exhibit a class A 6.2 feature and a class A′′ 8.6 feature. Note, however, that their 8.6 feature peaks at the extreme end of class A′′. Possibly, these two sources form an intermediate state between the spectrum corresponding to class and the spectrum corresponding to class . Another example of this type is NGC 7027. Its 7.8 subfeature is slightly stronger in peak strength than its 7.6 subfeature, although by a small amount. However, this source belongs to class A when considering the 6.2 feature and class B′′ concerning the 8.6 feature. Possibly, this is another intermediate state. IRAS 18576 and MWC 922 exhibit a B1 6.2 profile while their 7.7 and 8.6 features both belong to classes A′ and A′′, respectively. Fig. 17 provides an overview of the PAH spectrum for each of the three main categories. Although the classification of the 7.7 complex was based on the dominant subfeature, i.e. the 7.6 or 7.8 subfeature, it is clear from Fig. 17 that the whole spectrum corresponding with class is shifted compared to that corresponding to class .
The two sources with the 6.3 feature (IRAS 13416 and CRL 2688; class C), show a similar spectrum composed of a rather weak 6.3 feature, a 8.22 feature, an extremely weak 11.2 feature and a 3.3 band (see Hony et al. 2002, in prep.). The profiles of the 8.22 emission feature are identical, as are the 6.3 profiles. The intensity ratio I6.3/I8.22 is however not the same. Hence, the 6.3 and 8.22 features occur in similar conditions (object type, T, G0, ne, etc.). But, based on these two sources, it seems that no tight correlation, in terms of intensities, exist between them. The 8.22 feature in CRL 2688 and IRAS 13416 is remarkably similar in peak position and width to the plateau underneath the 7.7 and 8.6 features subtracted from the observed spectra (see Fig.4 and Sect. 2.5.1). This similarity is of course hard to prove. Here we do note that spatial studies have shown that this plateau is an independent emission component (cf. Bregman 1989; Cohen et al. 1989). Two sources which are not in our sample, IRAS 22272+5435 and IRAS 07134+1004, both show a very broad feature at 8 , somewhat shortwards of the 8.22 feature. This 8 profile is much broader then the 8.22 feature and may be the result of fortuitous convolution of a 7.7 complex peaking at 7.6 and the 8.22 feature.
| Class | Characteristics | type of object | range in G0 | Sp. types | |||||
|---|---|---|---|---|---|---|---|---|---|
| 6.2 m band | 7.7 m band | 8.6 m band | |||||||
| comp. | |||||||||
| A | 6.22 | A′ | 7.6 | A′′ | 8.6 | HII, RN, galaxies, non-isolated | 3E2 to 7E6 | O,B | |
| Herbig Ae Be stars, PN : Hb5, | |||||||||
| 2 Post-AGB stars : IRAS 16279, | |||||||||
| IRAS 16594 | |||||||||
| AB′ | equal | IRAS 21282, HD97048 | 1.7E4 &1E5 | O9 &A0 | |||||
| B | 6.24–6.28 | B′ | ”7.8” | B′′ | 8.62 | isolated Herbig Ae Be stars, PNe, | 6E4 to 2E7 | B,A, | |
| 2 Post-AGB stars : HR4049, HD44179 | WC9-10 | ||||||||
| C | 6.3 | C′ | 8.22 | C′′ | none | 2 Post-AGB stars : IRAS 13416, | 5E3 | F5 | |
| CRL 2688 | |||||||||
Considering the classification from an astronomical point of view, this analysis shows that the PAH spectrum in the 6 to 9 region, correlates with the type of source considered. All HII regions, reflection nebulae and all the extragalactic sources in this sample have a class A 6.2 feature, a 7.7 complex peaking at 7.6 (class A′) and a class A′′ 8.6 feature. All Herbig AeBe stars that are still embedded in their molecular cloud and have an HII region associated with them behave like the ISM sources. The isolated Herbig AeBe stars, HD 179218 and HD 100546, belongs to class . These two sources also show crystalline silicates indicating that disk chemistry may well influence the PAH population. The evolved stars are spread over the different classes. Since their outflow is/was the place of birth of the dust, they likely show the evolution of the PAH population in the early phases of life. However, they do not reflect - at first sight - a clear link between the PAH spectrum and the source evolutionary state. The two Post-AGB stars IRAS 13416 and CRL 2688, exhibit the 6.3 and 8.22 features (class ). The two extremely metal-poor sources HD 44179 and HR 4049 both exhibit a class spectrum while the Post-AGB stars IRAS 16279 and IRAS 16594 display a class spectrum. IRAS 21282 is similar to the latter two sources except that it has an equally strong 7.6 and 7.8 subfeature. The PNe show similar variability in their spectra. Hb 5 is the only PN in our sample showing a class spectrum. IRAS 07027, He 2-113, IRAS 17047, IRAS 17347 and BD +30 3639 all show a class spectrum. In this class, sources with mixed PAH classes are also present : IRAS 18576 and NGC 7027.
The PAH spectrum in the 6 to 9 region apparently reflects local physical conditions (object type, T, G0, ne, etc.) or the accumulated effect of processing from the formation sites in the AGB or post-AGB phases to the ISM or the influence of disk chemistry.
A detailed study on the variations in the PAH spectrum of Herbig AeBe stars and the link with the local physical conditions will be given in Van Kerckhoven et al. (2002, in prep.). Hony et al. (2002, in prep.) concentrates on the PAH spectra of evolved stars and thus on the evolution of the PAH population in the early phases while Peeters et al. (2002, in prep.) focuses on the HII regions.
5 Correlation studies
Given the close relation between the main features in the 6 to 9 region, it is of interest to investigate whether the strength of these features can shed more light on the origin of the observed relations and variations. Since the absolute intensities are influenced by the intrinsic luminosity and distance of the source, we study the variations in the relative strength of the PAH bands. The intensity of the 7.6 and 7.8 features used here are integrated intensities of the Gaussian fits, while the intensities of the other PAH features are integrated intensities of the profile. The observed intensity ratios can be influenced by extinction (see § 2.5.2). Since extinction strongly influences the intensity of the 8.6 feature, we do not consider this feature here.
When checking for connections between intensity ratios and object type, we do detect a relation but there are always some exceptions present. Nevertheless, when plotted against object class (classes and ), these exceptions disappear and clear segregations between the two classes become apparent.
For each class, the average fraction of the total PAH flux, emitted in each feature, its standard deviation and the total range present in our sample are shown in Fig. 19. For the total PAH flux, we only considered the 3.3, 6.2, 7.7 and 11.2 features. The fraction of the total PAH flux emitted in the 7.6 and the so-called 7.8 features clearly depends on the class of the source (see Fig. 18, left panel and Fig. 19). In contrast, the fraction of the total PAH flux emitted in the 7.7 complex does not differ significantly for the two classes. Furthermore, the fraction of the total PAH flux emitted in the 6.2 and 11.2 feature differ for the classes and while a similar fraction is emitted in the 3.3 feature for both classes (see Fig. 18, right panel and Fig. 19). Therefore, it seems that the increase in I6.2/IΣPAH for class compared to class is opposite to the behaviour of the 11.2 feature. However, there is no indication of this when plotting I6.2/IΣPAH versus I11.2/IΣPAH. In addition, the fraction of flux emitted in the 3.3 or 11.2 feature does not correlate with the fraction emitted in the 6.2 feature. So, this difference in I6.2/IΣPAH for the two classes cannot be directly linked to only one band (the 3.3, 7.7 or 11.2 feature). Furthermore, sources with an increased emission in the 6.2 feature (class ) also have an increased emission in the 7.8 feature and hence a decreased emission in the 7.6 component compared to class (see Fig. 18, right panel).
In Fig. 20, the intensity ratio of the 7.6 to 7.8 subfeatures, i.e. I7.6/I7.8, is plotted versus the peak position of the 6.2 feature and of the 7.8 component respectively. The peak position of the 7.8 component is determined from the position of this subpeak in the 7.7 complex itself and not from the applied Gaussian fits. The error in this position is given in Table 2 for entrees in which the 7.7 complex peaks longwards of 7.7 . For sources with a dominant 7.6 component, we estimate the error to be less then 0.05 . It is clear that the sources reflect a gradual variation. In contrast, no clear correlation between the I7.6/I7.8 intensity ratio and the FWHM of the 6.2 band is present.
We also checked for correlations between band strength ratios and the local radiation field G0, however we do not detect any correlations. Furthermore, the local radiation field of the sample sources do not show differences between the two classes. In addition, we checked for correlations between band strength ratios and the integrated band-to-continuum ratio, PAH/cont, in the 6–9 region. This ratio traces excitation conditions and/or abundance variations. The error on this ratio is dominated by the continuum determination and is less then 10%. We took the continuum described in Sect. 4; hence, the plateau contributes to the continuum. This ratio is given in Table 2. Here also, we do not detect any correlation. But, sources with the intensity ratio I7.6/I 1 do not have a high PAH/cont ratio ( 0.45) whereas sources where I7.6/I 1 span a range in PAH/cont from 0 to 1.2.
6 The Infrared Emission Features and PAHs
The IR emission features at 3.3, 6.2, 7.7, 8.6, and 11.3 are now generally thought to arise from vibrationally excited PAHs due to their similarity with the spectra of PAHs taken under conditions which match the salient characteristics of the interstellar environment. One of the early pivotal results of the laboratory and theoretical studies on PAHs reported over the last decade is the remarkable effect ionisation has on the infrared spectra (Szczepanski & Vala 1993; Langhoff 1996; Kim et al. 2001; Hudgins & Allamandola 1999a, and ref. therein). While PAH characteristic frequencies are only modestly affected by ionisation, the influence on intensity is striking - particularly in the 5 to 10 region (Fig. 21). The bands grow from the smallest features in neutral PAH spectra to become the dominant bands in ionised PAH spectra. The CC stretching vibrations grow in intensity because, upon ionisation, the charge distribution changes significantly with the CC skeletal vibration, creating a strong oscillating dipole whereas the oscillating dipole for the CH motions and their corresponding bands are reduced. Fig. 21 illustrates this effect, which has been found for all PAHs measured in the laboratory to date. However, this is mostly limited to PAHs with less than 48 C-atoms. Larger PAHs are only now being studied in the laboratory. Preliminary laboratory results for PAHs containing up to 60 C-atoms also show this behaviour upon ionisation. Theoretical studies of large species support this enhancement to much larger sized PAHs. For example, Bauschlicher (2002) has shown that this holds for C96H24. Astronomically, the observation that the 6.2 and 7.7 features, the focus of this paper, are the most intense of the interstellar emission band class, is a clear indication that ionisation is an intrinsic characteristic of interstellar PAHs. The 3.3 feature on the other hand is characteristic for neutral PAHs. Hence, both ionised and neutral PAHs contribute to the interstellar IR emission spectrum.
There have been many comparisons between PAH spectra and the interstellar spectra over the years. As the observational tools have become more sensitive and the laboratory techniques more appropriate to the interstellar case, the fits have become more revealing about the different PAH populations in different regions and this, in turn, has yielded further insight into conditions in the emitting regions. Fig. 22 shows a fit to the emission from IRAS 23133 measured with ISO by spectra now available in the Ames PAH IR spectral database (http://web99.arc.nasa.gov/~astrochem/pahdata/index.html). Although the fit is striking, thanks to the quality of the new ISO spectra, important differences become apparent which shed further light on the interstellar PAH population. The following differences can be seen in going from shorter to longer wavelengths. The laboratory band near 6.2 falls slightly to the red of the interstellar feature, laboratory components centred near 7.7 do not precisely match the interstellar profile at this position, the 8.6 laboratory band is weaker with respect to the other features in the spectrum than is the case for IRAS 23133, and the laboratory component near 11.2 lies to the red of the interstellar feature. The differences in the 8.6 and the 11.2 regions are discussed elsewhere (Hony et al. 2001, Janssen, Janssens and Swansen 2002, in prep.). Here we focus on the interstellar features near 6.2 and 7.7 .
Feature assignments in the 5 to 10 region
The 5 to 10 region encompasses frequencies which originate from a
variety of PAH molecular vibrations. Pure CC stretching motions
generally fall between about 6.1 and 6.5 , vibrations involving
combinations of CC stretching and CH in-plane bending modes lie
slightly longward, between roughly 6.5 and 8.5 , and CH in-plane
wagging vibrations give rise to bands in the 8.3 to 8.9 range.
While the well-known interstellar features at 6.2, 7.7, and 8.6
dominate this range, there are at least four weak interstellar bands
in this region as well, centred near 5.2, 5.6, 6.0 and 6.8 .
Their correlation with the major features indicates that they too
originate from the interstellar PAH family. The 5.2 and 5.6
features most likely correspond to combinations and overtones
involving the CH out-of-plane fundamental vibrations which fall
between 11 and 13 ; the 6.0 feature likely indicates a carbonyl
(C=O) stretch of an oxygenated PAH (a quinone); and the 6.8 band
probably corresponds to a weak aromatic CC stretching - CH in-plane
bending combination mode of PAHs as for example in the fluoranthenes, or the
aliphatic -CH2- or -CH3 deformation in a methyl or ethyl side-group
attached to a PAH.
There are also other plausible interstellar PAH-related species that are likely to be important in the emission zones and which should be considered. Some examples include PAH clusters and PAH complexes with metals such as iron (metallocenes). Furthermore, one can question whether PAHs remains planar as they grow. And, if not, how does the 3-dimensional shape influence the IR spectrum? It is noteworthy in this regard that simple fullerenes do not have IR characteristics which coincide with any prominent structure in the interstellar emission spectra discussed here (Moutou et al. 1999b). Further, and in spite of much effort, there has not been any report of IR active transitions in carbon nanotubes, very large curled aromatic networks. If such curled aromatic networks (very, very large PAHs) do possess infrared activity, it appears to be very weak. Thus here we focus on the PAH molecules measured in the laboratory or theoretically calculated.
The shifts in the profiles shown by the observations presented above (see Table 2) are much larger than the binsize corresponding to the obtained resolution of the data. Hence, they are chemical in nature, arise from local excitation conditions and are not due to doppler broadening and shifting. Therefore, these shifts and profile variations provide important new insight into the variations of the interstellar PAH populations in the different environments. Interpretation of these new spectral aspects require probing deeper into the details of PAH spectroscopic properties in this region than heretofore. Here we consider this new information as it affects first the 6.2 region and then the 7.7 region.
6.1 The position of the PAH CC stretching band near 6.2 : experiment and theory
There are several properties which determine the precise peak positions of the infrared active bands which correspond to pure CC stretching vibrations in any given PAH. These include molecular size, molecular symmetry, and molecular heterogeneity. The roles each of these play in determining the position are discussed below. The charge of the PAH molecules also shifts the band position; but this trend is not systematic (Bakes et al. 2001, Bakes E., private communication). In addition, dehydrogenation influences the band position (Pauzat et al. 1997). However, based upon the CH out-of-plane bending modes, Hony et al. (2001) conclude that dehydrogenation has little influence on the observed interstellar PAH spectrum.
Molecular size
At the small end of the PAH size distribution (C10 to C30), the peak wavelength of the dominant CC stretching feature decreases steadily with molecular size (Hudgins and Allamandola, 1999). The data shown in Fig. 23, which has been updated to include more PAHs than available in the original study, shows this trend.
However, Fig. 23 shows that the trend does not continue ad-infinitum but seems to die out for molecules with more than about 30 to 40 carbon atoms, falling slightly longwards of 6.3 . This behaviour is consistent with the limit of graphite which shows an emission mode at 6.3 (Draine 1984). Thus, as the size grows, the influence of boundary conditions on these pure CC stretching vibrations within the PAH carbon skeleton vanishes when the peak wavelength of this mode in graphite is reached. Indeed, it is a general chemical rule that within any molecule, the further a given bond or chemical subgroup is from the site of a modification, the smaller the effect exerted by that change on the properties of the specific bond or subgroup. This goes for a molecule’s fundamental vibrational frequencies as well as its chemical properties. For the smallest PAHs, addition of even a single ring constitutes a significant modification to the carbon skeleton and strongly influences its pure CC stretching vibrational frequencies. However, as PAH size increases, an ever-increasing fraction of the molecule’s carbon skeleton lies ”far” from the site of any particular modification and is thus increasingly insensitive to that modification. As a result, the corresponding fundamental CC stretching modes that arise within that skeleton are progressively less perturbed resulting in a levelling off of their frequencies above a certain size (30 C atoms as estimated from Fig. 23).
Importantly from the astrophysical perspective, Fig. 23 shows that the maximum wavenumber falls some 20 cm-1 short of 6.2 , the peak position of the Type A interstellar bands discussed in Sect. 3.1. This mismatch between PAH band position and the interstellar feature is only worsened by the approximately 10 cm-1 red shift which occurs for emission from a vibrationally excited PAH (Cherchneff & Barker 1989; Flickinger & Wdowiak 1990; Brenner & Barker 1992; Colangeli et al. 1992; Joblin et al. 1995; Cook & Saykally 1998). Thus, while the correlation between molecular size with band position is confirmed by new experimental and theoretical data, for the highly symmetric pure PAHs considered here, the strongest, infrared active, pure CC stretching mode cannot reproduce the position of the 6.2 interstellar feature and other factors which can slightly shift this frequency must be considered.
Molecular symmetry
Another property which can influence IR activity is molecular symmetry. In large, symmetric molecules there are many vibrations which correspond to very weak or infrared forbidden transitions. These vibrations are weak or IR inactive in highly symmetric species because the oscillating dipoles arising from atomic motions at one position in the molecule are cancelled by identical, but oppositely oriented dipoles arising from identical, oppositely phased motions occurring elsewhere in the molecule. Reducing molecular symmetry eliminates some of this oscillating dipole cancellation and once IR forbidden modes can become IR active. This behaviour is expected independent of the means by which symmetry is broken. For large, highly symmetric molecules such as circumcoronene (C54H, symmetry = D6h) and circum-circumcoronene (C96H, symmetry = D6h) included in Fig. 23, the calculations indicate that there are several infrared inactive CC stretching vibrations that fall between about 6.15 and 6.25 , (1626 and 1600 cm-1) positions which overlap the interstellar position. Since there is no reason to expect that interstellar PAHs would be so highly symmetric, we have explored the influence of symmetry breaking on the IR spectrum to assess the possibility that asymmetric PAHs would show strong IR activity at shorter wavelengths, closing the gap between the PAH spectra and the 6.2 interstellar feature. Several different cases were tested and all show only marginal effects (Bauschlicher, Hudgins, and Allamandola 2002, in prep.). For example, by reducing the symmetry of the circumcoronene cation by removing first one and then two of the peripheral rings, the peak position of the strongest pure CC vibration does not shift much if at all. It falls at 6.36 (1572 cm-1) in both circumcoronene and circumcircumcoronene with one ring removed and only slightly shifts to 6.33 (1580 cm-1) in circumcoronene with two rings removed. Thus, we conclude that symmetry breaking alone cannot account for the difference between the interstellar feature and the PAH spectra considered to now.
Molecular heterogeneity
Another means by which IR activity can be induced in otherwise weak or forbidden transitions is by the introduction of a hetero atom into the symmetric molecular structure. This alters the molecule in two ways: it lowers the symmetry and modifies the electronic distribution. To investigate this influence on PAH spectroscopy, Bauschlicher, Hudgins, and Allamandola (2002, in prep.) have studied the effects of introducing different hetero-atoms into different positions within the carbon network of several PAHs. This affects, in particular, the position of the 6.2 band. A few examples are presented in Fig. 24. Here the positions of the strongest band in this region are shown for the cations of the pure PAHs coronene, ovalene, and circumcoronene and their counterparts which have one of the carbon atoms replaced by a nitrogen. In all cases nitrogen substitution shifts the strongest CC stretching vibration to the 6.2 interstellar band position. Further within a given PAH, the shift depends somewhat on the ”depth” of the substitution in the carbon skeleton. For example, when nitrogen is substituted for a carbon atom on the outermost ring of the circumcoronene cation, the strongest band in the CC stretching region falls at 6.16 ; when this substitution is made on the next innermost ring (shown in Fig. 24), it falls at 6.21 ; and when on the innermost ring it falls at 6.19 . Bandshift behaviour when more than one nitrogen is substituted is still to be determined. For singly substituted PAHs, this peak shift has two causes. First, the insertion of nitrogen decreases molecular symmetry, increasing IR activity in modes which are normally weak because of the higher symmetry as described above. Second, the strongly electro negative nitrogen atom modifies the fixed charge distribution on the carbon network and induces stronger IR activity for these vibrations since the magnitude of the oscillating dipole increases. This behaviour can be expected independent of the means by which the charge distribution is fixed.
Bauschlicher, Hudgins, and Allamandola (2002, in prep.) have also considered oxygen and silicon atom substitution. Nevertheless, while these too show a similar induction of IR activity close to 6.2 , when taking chemical considerations into account, nitrogen substitution is still the most attractive candidate. First, nitrogen can be incorporated anywhere within the ring structure without compromising the aromatic stability of the electron network. Second, oxygen substitution does not have this advantage. Oxygen or O+ cannot form four bonds and so oxygen is not found in the middle rings. Hence, oxygen would be most stable only at the edge positions, positions which would be more reactive and subject to chemical attack. Third, although silicon can form four bonds, the C-Si bond length is larger then the C-C bond length and hence the aromatic rings will be disturbed by silicon substitution. Moreover, silicon has a much lower cosmic abundance then does nitrogen. Thus, at this stage in our understanding, large PAHs containing some nitrogen seem most plausible to account for the 6.2 band position. As mentioned before, there are other plausible interstellar PAH-related species in which one might induce activity at this position and these must be investigated before a firm conclusion can be drawn. Some examples include large PAHs with uneven and irregular structure, PAH clusters and PAH complexes with metals such as iron (metallocenes).
6.2 The position of the PAH CC stretching/CH in-plane bending feature near 7.7 : experiment and theory
The CC stretching/CH in-plane bending vibrations of most singly ionised PAHs possess at least one very strong feature between about 7.2 and 8.2 . Fig. 25 shows a graph of the frequencies for the strongest of these modes plotted versus the carbon number for the same molecules considered in Fig. 23. In this case (Fig. 25) there is no clear relationship between frequency and size in contrast to the behaviour for the pure CC stretch (Fig. 23). While a few of the smallest molecules do have vibrations which fall at the lowest frequencies measured for these modes - suggesting such a correlation - similarly sized molecules possess some of the highest vibrational frequencies. Furthermore, one of the largest PAHs in the laboratory database, hexabenzocoronene (C42H24), has the lowest frequency determined to date. Here peak positions for small and large PAHs are intermingled.
In addition, Fig. 25 reveals that there is also a gap between about 7.6 and 7.8 (1316 and 1282 cm-1), with a clustering of the data between 1320 and 1355 cm-1 (7.4 and 7.6 ). The data in Fig. 25 suggests that the mean PAH CC stretching/CH in-plane bending frequency lies near 1335 cm-1 (7.5 ). This behaviour is important in view of the results presented in Sect. 3.2 which show that two components dominate the interstellar emission in this region, one peaking near 7.6 (class A′) , the other longwards of 7.8 (class B′). When one takes the roughly 10 cm-1 red shift into account for emission, it is apparent that this family of PAHs can readily reproduce the 7.6 component, but not the dominant 7.8 component.
As discussed above for the pure CC stretching features near 6.25 , we have theoretically considered how molecular symmetry and heterogeneity influence the peak position of the 7.7 complex in order to understand what molecular properties might be responsible for the interstellar position. Breaking the high symmetry of PAH molecules, either by removing rings or by substituting a nitrogen atom at several different positions within the carbon network again produces IR activity in modes which were weak or completely forbidden (Bauschlicher, Hudgins, and Allamandola 2002, in prep.). In this case however, while a few examples are found in which intense bands fall in this gap, these results seem random and no clear structural relationship has yet emerged. Thus, this sort of molecular modification does not account for the interstellar 7.8 component.
Furthermore, as with the 6.2 feature, dehydrogenation and the charge of the PAH molecules do not play a major role in determining the peak position (see Sect. 6.1).
In summary, the 7.6 (class A′) interstellar band is consistent with a mixture of large and small, pure and hetero-atomic PAHs. These PAHs also contribute emission at 7.8 as illustrated in Fig. 22. However, the PAHs so far considered reveal a dearth of strong spectral features longwards of 7.7 and thus have difficulty reproducing the class B′ 7.7 band. There are only a few PAHs in the database which have their strongest band at 7.8 and the data is insufficient to make any generalisations concerning the properties which cause strong IR activity at this position. As above, there are several other PAH related species that are likely to be important in the emission zones and which should be considered.
7 Astronomical implications
From the wealth of IR spectra, it is clear that the UIR bands at 3.3, 6.2, ”7.7”, 8.6 and 11.2 represent a single class of spectral features that come and go together. The ISO observations presented here in Sect. 3.1, 3.2 and 3.3, show that the peak positions and profiles of the 6.2, ”7.7” and 8.6 features vary significantly from source to source. Moreover, as discussed in § 4, these variations in the different bands are correlated with each other and with the type of object considered (i.e. HII region, YSO, Post-AGB star and so on). These variations stand in marked contrast to the behaviour of 3.3 and 11.2 bands. While the latter modes show some variation in profile, their peak position is relatively invariant with both bands wandering by only 0.2% (Tokunaga et al. 1991; Hony et al. 2001, Peeters et al. 2002, in prep.; van Diedenhoven et al. 2002, in prep.). Furthermore, while the 3.3 and 11.2 band intensities are correlated with each other (Hony et al. 2001), their strengths do not correlate well with that of the 6.2 and 7.7 features.
7.1 The observed trends
It is shown that class and have distinctly different profiles, peak position and relative intensities of the features in the 6–9 region. We attribute these differences between the two classes to variation in the PAH families present around the sources; i.e. different molecular mixtures are found around the sources of the two classes whose combined IR spectral fingerprints change the overall PAH spectrum in the 6–9 region significantly.
Class corresponds to regions where G 104. For such high G0, very small grains (VSG) emit in the 6-9 region (Cesarsky et al. 2000). Since the range in G0 present in class is also present in class , these VSG are not responsible for the observed differences. Furthermore, these differences in the observed emission features and hence in the PAH families is not directly related with G0.
Hony et al. (2001) derived the molecular structure of the PAHs based upon the 10-15 spectra and concluded that the PNe contain large, compact PAHs with long straight edges while HII regions contain smaller or more irregular PAHs. Clearly, the HII regions and non-isolated Herbig Ae Be stars all belong to class and have a weak I11.2/I12.7 ratio. But, for the PNe considered in Hony et al. (2001), no link is found between the I11.2/I12.7 intensity ratio and the profile classes. This supports the above mentioned observations that the CH modes seems to behave independently of the CC modes.
7.2 The feature assignments and carriers
In general, the peak position of the PAH vibrations may be affected by charge (anion, cation, and neutral states), size, symmetry and molecular structure and heterogeneity. It is therefore important to understand the precise transitions involved in producing these interstellar features if we are to fully interpret what these transitions tell us about the nature of the carriers, their history and the local physical environment.
7.2.1 The 6.2 feature
The observations presented here (Figs. 6 through 11) show that the peak position of the interstellar PAH CC stretching band varies between 6.2 and 6.3 . The interstellar feature seems more red-shaded (i.e. asymmetric with a red wing) when it peaks at 6.2 (Class A emitters, Table 2) then when it peaks near 6.25 (Class B emitters, Table 2). For Class A emitters, the observed half-widths (0.11 , 28 cm-1) are close to the expected intrinsic line width of an emitting PAH molecule or cluster (roughly 30 cm-1), for Class B emitters the observed widths (0.15 , 38 cm-1) are slightly larger and Class C emitters have the smallest widths (0.099 , 25 cm-1).
The variation in the observed peak positions and profiles are interwoven and may reflect the effects of a class of PAHs, each with its individual peak position, or the effects of anharmonicity inherent to the emission process in higher vibrationally excited PAHs, or both.
Emission by a PAH family
As discussed in Sect. 6.1 and illustrated in Fig. 23, pure PAHs (i.e. those containing only carbon and hydrogen) composed of 20-30 C atoms can reproduce the position of the interstellar 6.3 component but cannot account for the 6.2 component. Based on the currently-available experimental and theoretical data, the most probable carriers of the 6.2 component are hetero-atom (e.g. N, O, Si) substituted PAHs, PAH clusters and/or PAH complexes with a metal atom such as iron (i.e. metallocenes). Interactions in such species may alter a PAH molecule in two ways : they may lower the molecule’s symmetry and they may alter the electron distribution within the molecule. Both of these effects may shift the dominant CC stretching modes toward shorter wavelengths.
In summary, the observed profiles of the 6.2 band complex can be a ”blend” of emission bands by different carriers with slightly shifted peak position for the main CC mode. Pure PAHs represent the 6.3 component and substituted PAHs or PAH-like species emits the 6.2 component. The profile of the 6.2 band complex reflects then the relative abundance of the different species in the PAH population and so different sources contain different amounts of each type of species. Typically, the PAH population in Post-AGB objects, PNe and isolated Herbig AeBe stars is skewed toward pure-C PAHs, while HII regions, RNe, non-isolated Herbig AeBe stars and galaxies have a dominant contribution from substituted complexed PAHs. However, the PAH family in some PNe also contains an important substituted PAH population. NGC 7027 is a case in point. This interpretation raises interesting questions on the origin and evolution of circumstellar and interstellar PAHs which will be addressed in Sect. 7.3. In principle, the family could consist of two (distinct) species only. However, we consider that unlikely.
Anharmonicity
It is also possible to interpret the observed (red shaded) profiles in terms of emission from a single PAH (or a collection of PAHs with very similar peak position) which is (are) highly vibrationally excited. If a molecule is sufficiently highly vibrationally excited, emission from levels above the first excited state become important. Due to the anharmonic nature of the potential well, these band spacings become smaller and smaller the higher up the vibrational ladder one samples and emission between these levels falls slightly and progressively to the red producing a long wavelength wing reminiscent of the observed wing (Barker et al. 1987). In addition, anharmonic coupling of the emitting mode with other modes also shifts the peak position of the emitting band to lower energies. Integrating over the energy cascade as the emitting species cools down will then in a natural way give rise to a red shaded profile (Barker et al. 1987; Pech et al. 2001; Verstraete et al. 2001).
Pech et al. (2001) and Verstraete et al. (2001) have modelled the IR emission spectrum of PAHs based upon extensive laboratory studies of the shift in peak position as a function of temperature of the emitter which is a direct measure of the anharmonicity (Joblin et al. 1995). They obtained excellent fits to the red shaded appearance of the observed profiles of the 3.3, 6.2 and 11.2 bands. However, for the 6.2 band no good fit to the peak position is obtained for sources with class spectra, because the laboratory and theoretical studies have been limited to pure-C PAHs. Nevertheless, the principle remains the same and small, highly vibrationally excited, N-substituted PAHs are also expected to have red shaded emission profiles.
Within this interpretation, the class profiles which are highly
asymmetric are due to a relatively limited number of small highly
excited N-substituted complexed PAHs. The class profiles, which
peak at 6.3 and are fairly symmetric (cf. Fig. 9),
are carried by much less highly excited pure-C PAHs. The ”low”
excitation of these pure-C PAHs may reflect either the cool nature of
the illuminating source in these two Post-AGB objects (CRL 2688 and
IRAS 13416) or it may reflect an on-average larger size of the
emitting species, or both. Class B profiles show a less pronounced
blue rise and a less pronounced red wing. We note that class
sources typically have a higher I11.2/I12.7 intensity ratio
than class sources (Hony et al. 2001). A high
I11.2/I12.7 intensity ratio indicates the dominance of
rather large ( 150 C-atoms) PAHs (Hony et al. 2001) and
anharmonicity effects are expected to be smaller for such large PAHs
(Pech et al. 2001). The YSO, BD+40 4124, which belongs to class
, shows a Gaussian profile, possibly indicating that the
photochemical survival of the fittest (i.e. most robust) members of
the PAH family has been of great importance in this source (Van
Kerckhoven et al. 2002, in prep.).
The 6.2 band of many of these sources have very similar profiles, irrespective of the harshness of the illuminating radiation field - as measured by its strength or effective temperature. As exemplified by the model study of Verstraete et al. (2001), this indicates that the typical size of the emitting PAH is larger in regions which are illuminated by hotter stars. This coupling between size and the ”colour” of the illuminating radiation field may be a natural consequence of emission from a family of PAH species; that is, the smallest size of PAHs which can survive in a radiation field will depend on the average photon energy in the illuminating FUV field. To phrase it differently, both the minimum size and the profile of the 6.2 band may be a measure of the average excitation of the emitting PAH (Verstraete et al. 2001). The more symmetric profiles of class may then reflect that the PAHs in these cool Post-AGB objects have not yet been exposed to harsh radiation fields and their composition still reflects the condition during their formation at high temperatures. As a corollary, this implies that there are no small PAHs ( 25 C atoms) with peak positions longwards of 6.3 . The coolness of the radiation field and symmetric profiles imply then that the PAHs in these sources are only moderately excited.
7.2.2 The 7.7 complex
As discussed in the spectroscopy section (Sect. 6.2), the observed 7.7 profiles of class A′ can be remarkably well reproduced by either pure-C or N substituted PAHs. The dominance of the 7.8 band in class B′ profiles, however, remains an enigma.
When investigating other possible carriers for the 7.8 component, one should bear in mind the following observational facts. First, the 7.7 complex is always observed together with the other UIR bands. Second, the position of the 7.8 component correlates with the observed intensity ratio I7.6/I7.8. Third, the strength of the 7.8 component is correlated with the strength of the 6.2 feature. In addition, the different classes of the 6.2 and 7.7 features are directly linked with each other. Hence, the carrier of the 7.7 complex and in particular of the 7.8 component should be related to the carrier of the other UIR bands.
Other carriers have been proposed to explain the UIR bands. Proposed solid state carriers are QCC (Sakata et al. 1984), soot (Allamandola et al. 1985), coal (Papoular et al. 1989), HAC (Colangeli et al. 1995; Scott et al. 1997) and nano-sized carbon grains (Herlin et al. 1998; Schnaiter et al. 1999). Laboratory measured spectra of the solid state materials all resemble the global appearance of the observed UIR spectrum. Looking in detail, however, they do not match the observed peak positions, the observed widths and the observed profiles. In addition, these grains would be generally too cool to emit efficiently in the mid-IR. In summary, to date the molecular carrier of the so-called 7.8 component remains unidentified albeit that it likely has a highly aromatic character.
7.2.3 The 8.2 feature
Two Post-AGB stars (CRL 2688 and IRAS 13416) in our sample show a peculiar IR spectrum. Instead of a 7.7 and 8.6 feature, they exhibit a broad 8.2 feature. The other UIR bands are also slightly different. The 3.3 feature has a similar peak position as HD 44179 (type 2 in Tokunaga et al. 1991). But, it is broader than in HD 44179 or in HII regions. In addition, these objects emit a symmetric 6.3 feature. Unfortunately, the 11.2 feature is too weak to define its profile and peak position. Both sources show a 3.4 band.
There are several ways to interpret these spectra. First, the observed spectra could be a combination of emission by PAHs, giving rise to a (slightly modified) UIR spectrum, and by an unknown carrier which produce exclusively the 8.2 feature. In this interpretation, the 7.7 and 8.6 bands would be hidden in the strong 8.2 feature. Second, the carriers of the features in these sources might have similar CH modes as PAHs but their CC modes are different. Since dust is formed in the outflows of Post-AGB objects, the spectra of these sources might then reflect that of freshly synthesised PAHs, dust and intermediate compounds.
This broad 8.2 band may well be present in some other sources as an underlying plateau (Sect. 4). Studies of the spatial distribution of this plateau have shown that it is carried by a component which is independent of that of the 6.2 and 7.7 bands (Bregman 1989; Cohen et al. 1989). Energetic arguments suggests that the carrier of this plateau contains 400 C-atoms and, hence, the carrier may be in the form of PAH clusters (Bregman 1989).
In these two Post-AGB objects, the carrier of the 8.2 band may also be in the form of larger grains. The dust (and gas) in these two Post-AGB objects is very close to the central star and hence dust particles might attain high enough temperature to emit strongly around 8 . The large width of the 8.2 band lends some credence to a grain-like carrier for this band. Various carbonaceous materials show an emission near 8 , including HAC, QCC, coal, and partially hydrogenated C60 (Mortera & Low 1983; Sakata et al. 1984; Colangeli et al. 1995; Guillois et al. 1996; Scott et al. 1997; Schnaiter et al. 1999; Stoldt et al. 2001). However, the profiles in these solid state materials peak close to 8 and are much broader then the 8.2 component. These materials do provide reasonable fits to the 8 feature as observed toward IRAS 22272+5435 (Buss et al. 1993; Guillois et al. 1996; Kwok et al. 2001) but cannot be the carriers of the 8.2 feature.
7.3 Formation/Evolution
It was recognised some time ago that there are two main classes of contributors to the 7.7 band, one peaking near 7.6 which is associated with HII regions, and one peaking near 7.8 , associated with planetary nebulae (Bregman 1989; Cohen et al. 1989). In this paper, we reported three main classes. These classes are indeed related with the type of object (see Sect. 4). In general, HII regions, RNe, non-isolated Herbig AeBe stars and the extragalactic sources form one class () with dominant bands at 6.22 , 7.6 and 8.6 . The local radiation field G0 in the latter sources ranges from 3E2 to 7E6. Isolated Herbig AeBe stars, PNe, HD44179, HR4049 - with a local radiation field G0 between 6E4 and 2E7 - form a second class () with dominant bands in the range of 6.24-6.28 , longwards of 7.7 and longwards of 8.62 . Two peculiar Post-AGB stars form a third class () with a 6.3 and a 8.22 feature; with a local radiation field G0 of 5E3 in one of these two stars. Two Post-AGB stars and one PN belong as well to class . As discussed in the previous section, class is probably built up by nitrogen substituted or complexed PAHs while class seems to be dominated by pure PAHs in their dust collection. The PAH spectrum in the 6 to 9 region apparently reflects local physical conditions and the accumulated effect of processing from the formation sites in the AGB or post-AGB phases to the ISM.
The two main PAH classes identified through the peak position of their CC modes - classes and - imply two distinct histories. Because these two PAH classes are connected to classes of astronomical objects, these histories are likely locally determined. Hence, we interpret class as the PAHs formed in the stellar ejecta presumably through chemical processes similar to terrestrial soot formation. Extensive laboratory studies and theoretical calculations have shown that in that case highly condensed, ”pure” carbon PAHs are the favoured molecular intermediaries in the dust condensation route (Frenklach 1990; Frenklach & Feigelson 1989; Cherchneff et al. 1992). The PAHs in class , on the other hand, likely represent a modification of those in class in the harsh environment of the interstellar medium (Allamandola et al. 1999). Interstellar PAHs could be substantially chemically processed in the warm gas of strong shock waves. Alternatively, energetic processing through UV and/or cosmic rays may lead to some modification of the PAH structure (Strazulla et al. 1995; Bernstein et al. 1999; Ricca et al. 2002a, b).
Hony et al. (2001) concluded from their study of the CH out-of-plane bending modes that evolution is an integral aspect of the life of interstellar PAHs. Specifically, the spectra of PNe point towards the presence of large ( 150 C-atoms) compact PAH with regular molecular edge structures. In contrast, HII regions are dominated by highly irregular molecular edge structures. In their view, these molecular differences are driven by energetic processing in the harsh condition of the ISM of PAHs initially formed in stellar outflows. Our study of the CC modes complements this view. The spectral variation in the CC modes in these very different environments similar attest to the chemical evolution of the family of PAHs.
8 Summary
The most striking aspect of the features in the 6–9 region is their variability. All features shift in peak position from source to source, show different profiles and each seems to be composed of several subfeatures. Moreover, the variations in the 6.2 and 7.7 bands seem to be correlated with each other. In addition, these variations depend on the type of source considered and apparently reflect local physical conditions or the accumulated effect of processing from the formation sites in the AGB or post-AGB phases to the ISM. In particular, the sources with a profile 6.2 feature have a ”7.7” feature peaking at 7.6 , while for those with a component 6.2 feature, the ”7.7” feature peaks longwards of 7.7 m. The class objects, with a 6.2 feature peaking at 6.3 do not show a ”7.7” feature but instead show a broad emission band at 8.2 m. These variations stand in marked contrast to the behaviour of 3.3 and 11.2 bands whose profiles and peak positions are quite invariable (Hony et al. 2001, Peeters et al. 2002, in prep.; van Diedenhoven et al. 2002, in prep.).
We have summarised laboratory data and quantum chemical calculations for the 6–9 region. We attribute the observed 6.2 profile and peak position to the combined effect of a PAH family and anharmonicity with pure PAHs representing the 6.3 component and substituted/complexed PAHs the 6.2 component. The 7.6 component is well reproduced by both pure and substituted/complexed PAHs but the 7.8 component remains an enigma. In addition, the exact identification of the 8.22 feature remains unknown.
The observed spectral variations in the CC modes are coupled to the astronomical characteristics of the sources (object type). We find this strong support for the presence of a family of PAHs whose composition and/or emission characteristics are sensitive to the local physical conditions. An analysis of the CH out-of-plane bending modes in a similar sample has drawn essentially the same conclusion. Apparently, the interstellar PAH family is readily processed in space environments.
The past decade has witnessed great experimental and theoretical progress in understanding the spectroscopic properties of PAHs under interstellar conditions. However, the new observational data presented here poses significant new questions concerning the nature of the band carriers, questions whose answers will yield insight into the nature of the emitters and history of the emission zones.
Acknowledgements.
We would like to thank the referee Dr. L. Verstraete whose comments have helped to improve the paper. EP and SH acknowledges the support from an NWO program subsidy (grant number 783-70-000 and 616-78-333 respectively). CVK is a Research Assistant of the Fund for Scientific Research, Flanders. The laboratory work was supported by NASA’s Laboratory Astrophysics Program (grant number 344-02-04-02). IA3 is a joint development of the SWS consortium. Contributing institutes are SRON, MPE, KUL and the ESA Astrophysics Division. This work was supported by the Dutch ISO Data Analysis Center (DIDAC). The DIDAC is sponsored by SRON, ECAB, ASTRON and the universities of Amsterdam, Groningen, Leiden and Leuven. This research has made use of the SIMBAD database, operated at CDS, Strasbourg, France and the NASA/IPAC Extragalactic Database (NED), operated by JPL, CalTech and NASA.References
- Allamandola et al. (1999) Allamandola, L. J., Hudgins, D. M., & Sandford, S. A. 1999, ApJ Lett., 511, L115
- Allamandola et al. (1985) Allamandola, L. J., Tielens, A. G. G. M., & Barker, J. R. 1985, ApJ Lett., 290, L25
- Allamandola et al. (1989) —. 1989, ApJS, 71, 733
- Bakes et al. (2001) Bakes, E. L. O., Tielens, A. G. G. M., & Bauschlicher, C. W. 2001, ApJ, 556, 501
- Barker et al. (1987) Barker, J. R., Allamandola, L. J., & Tielens, A. G. G. M. 1987, ApJ Lett., 315, L61
- Bauschlicher (2002) Bauschlicher, C. W. 2002, ApJ, 564, 782
- Beintema et al. (1996) Beintema, D. A., van den Ancker, M. E., Molster, F. J., et al. 1996, A&A, 315, L369
- Benedettini et al. (1998) Benedettini, M., Nisini, B., Giannini, T., et al. 1998, A&A, 339, 159
- Bernstein et al. (1999) Bernstein, M. P., Sandford, S. A., Allamandola, L. J., et al. 1999, Science, 283, 1135
- Boulanger et al. (1998) Boulanger, F., Boisssel, P., Cesarsky, D., & Ryter, C. 1998, A&A, 339, 194
- Bregman (1989) Bregman, J. 1989, in IAU Symp. 135: Interstellar Dust, Vol. 135, 109
- Brenner & Barker (1992) Brenner, J. & Barker, J. R. 1992, ApJ Lett., 388, L39
- Buss et al. (1993) Buss, R. H., Tielens, A. G. G. M., Cohen, M., et al. 1993, ApJ, 415, 250
- Cesarsky et al. (2000) Cesarsky, D., Jones, A. P., Lequeux, J., & Verstraete, L. 2000, A&A, 358, 708
- Cherchneff & Barker (1989) Cherchneff, I. & Barker, J. R. 1989, ApJ Lett., 341, L21
- Cherchneff et al. (1992) Cherchneff, I., Barker, J. R., & Tielens, A. G. G. M. 1992, ApJ, 401, 269
- Cidale et al. (2001) Cidale, L., Zorec, J., & Tringaniello, L. 2001, A&A, 368, 160
- Cohen et al. (1986) Cohen, M., Allamandola, L., Tielens, A. G. G. M., et al. 1986, ApJ, 302, 737
- Cohen et al. (1999) Cohen, M., Barlow, M. J., Sylvester, R. J., et al. 1999, ApJ Lett., 513, L135
- Cohen et al. (1989) Cohen, M., Tielens, A. G. G. M., Bregman, J., et al. 1989, ApJ, 341, 246
- Colangeli et al. (1992) Colangeli, L., Mennella, V., & Bussoletti, E. 1992, ApJ, 385, 577
- Colangeli et al. (1995) Colangeli, L., Mennella, V., Palumbo, P., Rotundi, A., & Bussoletti, E. 1995, A&AS, 113, 561
- Cook & Saykally (1998) Cook, D. J. & Saykally, R. J. 1998, ApJ, 493, 793
- de Graauw et al. (1996) de Graauw, T., Haser, L. N., Beintema, D. A., et al. 1996, A&A, 315, L49
- Draine (1984) Draine, B. T. 1984, ApJ Lett., 277, L71
- Draine (1985) —. 1985, ApJS, 57, 587
- Ehrenfreund et al. (1997) Ehrenfreund, P., van Dishoeck, E. F., Burgdorf, M., et al. 1997, Ap&SS, 255, 83
- Everett et al. (1995) Everett, M. E., Depoy, D. L., & Pogge, R. W. 1995, AJ, 110, 1295
- Flickinger & Wdowiak (1990) Flickinger, G. C. & Wdowiak, T. J. 1990, ApJ Lett., 362, L71
- Frenklach (1990) Frenklach, M. 1990, in Carbon in the Galaxy: Studies from Earth and Space, 259–273
- Frenklach & Feigelson (1989) Frenklach, M. & Feigelson, E. D. 1989, ApJ, 341, 372
- García-Lario et al. (1999) García-Lario, P., Manchado, A., Ulla, A., & Manteiga, M. 1999, ApJ, 513, 941
- Geballe et al. (1985) Geballe, T. R., Lacy, J. H., Persson, S. E., McGregor, P. J., & Soifer, B. T. 1985, ApJ, 292, 500
- Genzel & Cesarsky (2000) Genzel, R. & Cesarsky, C. J. 2000, ARA&A, 38, 761
- Genzel et al. (1998) Genzel, R., Lutz, D., Sturm, E., et al. 1998, ApJ, 498, 579
- Gesicki & Zijlstra (2000) Gesicki, K. & Zijlstra, A. A. 2000, A&A, 358, 1058
- Gillett et al. (1973) Gillett, F. C., Forrest, W. J., & Merrill, K. M. 1973, ApJ, 183, 87
- Goto et al. (2002) Goto, M., Kobayashi, N., & Terada, H. 2002, ApJ, 000, 000
- Guillois et al. (1996) Guillois, O., Nenner, I., Papoular, R., & Reynaud, C. 1996, ApJ, 464, 810
- Habing (1968) Habing, H. J. 1968, Bull. Astr. Inst. Netherlands, 19, 421
- Helou (1999) Helou, G. 1999, in ESA SP-427: The Universe as Seen by ISO, Vol. 427, 797
- Helou et al. (2000) Helou, G., Lu, N. Y., Werner, M. W., Malhotra, S., & Silbermann, N. 2000, ApJ Lett., 532, L21
- Herlin et al. (1998) Herlin, N., Bohn, I., Reynaud, C., et al. 1998, A&A, 330, 1127
- Hony et al. (2001) Hony, S., Van Kerckhoven, C., Peeters, E., et al. 2001, A&A, 370, 1030
- Hrivnak et al. (2000) Hrivnak, B. J., Volk, K., & Kwok, S. 2000, ApJ, 535, 275
- Hudgins & Allamandola (1999a) Hudgins, D. M. & Allamandola, L. J. 1999a, ApJ Lett., 516, L41
- Hudgins & Allamandola (1999b) —. 1999b, ApJ, 513, L69
- Hudgins et al. (2001) Hudgins, D. M., Bauschlicher, C. W. J., & Allamandola, L. J. 2001, Spectrochimica Acta Part A, 57, 907
- Joblin et al. (2000) Joblin, C., Abergel, A., Bregman, J., et al. 2000, ISO beyond the peaks: The 2nd ISO workshop on analytical spectroscopy. Eds. A. Salama, M.F.Kessler, K. Leech & B. Schulz. ESA-SP 456., 456, 49
- Joblin et al. (1995) Joblin, C., Boissel, P., Leger, A., D’Hendecourt, L., & Defourneau, D. 1995, A&A, 299, 835
- Joblin et al. (1996) Joblin, C., Tielens, A. G. G. M., Allamandola, L. J., & Geballe, T. R. 1996, ApJ, 458, 610
- Kaper et al. (2002a) Kaper, L., Bik, A., Hanson, M., & Comeron, F. 2002a, in Hot Star Workshop III: The Earliest Phases of Massive Star Birt, ed. P. Crowther, Vol. 000, 000
- Kaper et al. (2002b) Kaper, L., Bik, A., Hanson, M., & Comeron, F. 2002b, in The Origins of Stars and Planets: The VLT View, ed. J. Alves & M. McCaughrean, Vol. 000, 000
- Kessler et al. (1996) Kessler, M. F., Steinz, J. A., Anderegg, M. E., et al. 1996, A&A, 315, L27
- Kim et al. (2001) Kim, H. S., Wagner, D. R., & Saykally, R. J. 2001, Phys. Rev. Lett., 86, 5691
- Kwok et al. (2001) Kwok, S., Volk, K., & Bernath, P. 2001, ApJ Lett., 554, L87
- Langhoff (1996) Langhoff, S. R. 1996, J. Phys. Chem. A, 100, 2819
- Latter et al. (2000) Latter, W. B., Dayal, A., Bieging, J. H., et al. 2000, ApJ, 539, 783
- Léger & Puget (1984) Léger, A. & Puget, J. L. 1984, A&A, 137, L5
- Lutz et al. (1998) Lutz, D., Spoon, H. W. W., Rigopoulou, D., Moorwood, A. F. M., & Genzel, R. 1998, ApJ Lett., 505, L103
- Martin & Whittet (1990) Martin, P. G. & Whittet, D. C. B. 1990, ApJ, 357, 113
- Martín-Hernández et al. (2002a) Martín-Hernández, N. L., Peeters, E., Morisset, C., et al. 2002a, A&A, 381, 606
- Martín-Hernández et al. (2002b) Martín-Hernández, N. L., Tielens, A. G. G. M., & van der Hulst, J. M. 2002b, A&A, 000, 000
- Mathis (1990) Mathis, J. S. 1990, ARA&A, 28, 37
- Meeus et al. (2001) Meeus, G., Waters, L. B. F. M., Bouwman, J., et al. 2001, A&A, 365, 476
- Meixner et al. (1999) Meixner, M., Ueta, T., Dayal, A., et al. 1999, ApJS, 122, 221
- Miroshnichenko et al. (1999) Miroshnichenko, A. S., Mulliss, C. L., Bjorkman, K. S., et al. 1999, MNRAS, 302, 612
- Molster et al. (1996) Molster, F. J., van den Ancker, M. E., Tielens, A. G. G. M., et al. 1996, A&A, 315, L373
- Moorwood et al. (1996) Moorwood, A. F. M., Lutz, D., Oliva, E., et al. 1996, A&A, 315, L109
- Mortera & Low (1983) Mortera, C. & Low, M. J. D. 1983, Carbon, 21, 283
- Moutou et al. (1999a) Moutou, C., Sellgren, K., Léger, A., Verstraete, L., & Le Coupanec, P. 1999a, in Solid Interstellar Matter : The ISO Revolution, ed. L. d’Hendecourt, C. Joblin, & A. Jones, EDP Sciences
- Moutou et al. (1999b) Moutou, C., Sellgren, K., Verstraete, L., & Léger, A. 1999b, A&A, 347, 949
- Moutou et al. (1999c) Moutou, C., Verstraete, L., Sellgren, K., & Léger, A. 1999c, in ESA SP-427: The Universe as Seen by ISO, Vol. 427, 727
- Papoular et al. (1989) Papoular, R., Conrad, J., Giuliano, M., Kister, J., & Mille, G. 1989, A&A, 217, 204
- Pauzat et al. (1997) Pauzat, F., Talbi, D., & Ellinger, Y. 1997, A&A, 319, 318
- Pech et al. (2001) Pech, C., Joblin, C., & Boissel, P. 2001, A&A, 000, 000
- Peeters et al. (2002) Peeters, E., Martín-Hernández, N. L., Damour, F., et al. 2002, A&A, 381, 571
- Peeters et al. (1999) Peeters, E., Tielens, A. G. G. M., Roelfsema, P. R., & Cox, P. 1999, ESA SP-427: The Universe as Seen by ISO, 427, 739
- Puget & Léger (1989) Puget, J. L. & Léger, A. 1989, ARA&A, 27, 161
- Ricca et al. (2002a) Ricca, A., Bauschlicher, C. W., & Bakes, E. L. O. 2002a, Icarus, 000, 000
- Ricca et al. (2002b) Ricca, A., Bauschlicher, C. W., & Rosi, M. 2002b, Chem. Phys. Lett., 000, 000
- Roelfsema et al. (1996) Roelfsema, P. R., Cox, P., Tielens, A. G. G. M., et al. 1996, A&A, 315, L289
- Rosenthal et al. (1999) Rosenthal, D., Bertoldi, F., Drapatz, S., & Timmermann, R. 1999, in ESA SP-427: The Universe as Seen by ISO, Vol. 427, 561
- Sakata et al. (1984) Sakata, A., Wada, S., Tanabe, T., & Onaka, T. 1984, ApJ Lett., 287, L51
- Schnaiter et al. (1999) Schnaiter, M., Henning, T., Mutschke, H., et al. 1999, ApJ, 519, 687
- Scott et al. (1997) Scott, A. D., Duley, W. W., & Jahani, H. R. 1997, ApJ Lett., 490, L175
- Serabyn (1999) Serabyn, E. 1999, http://www.ngst.nasa.gov/doclist/bytitle.html/, 0
- Spoon et al. (2002) Spoon, H., Keane, J., Tielens, A. G. G. M., Moorwood, A. F. M., & Lutz, D. 2002, A&A, 000, 000
- Stoldt et al. (2001) Stoldt, C. R., Maboudian, R., & Carraro, C. 2001, ApJ Lett., 548, L225
- Strazulla et al. (1995) Strazulla, G., Arena, M., Baratta, G. A., et al. 1995, Adv. Space Res., 16, 61
- Sturm et al. (2000) Sturm, E., Lutz, D., Tran, D., et al. 2000, A&A, 358, 481
- Su et al. (2001) Su, K. Y. L., Hrivnak, B. J., & Kwok, S. 2001, AJ, 122, 1525
- Szczepanski & Vala (1993) Szczepanski, J. & Vala, M. 1993, ApJ, 414, 646
- Szczerba et al. (2001) Szczerba, R., Górny, S. K., Stasińska, G., Siódmiak, N., & Tylenda, R. 2001, Ap&SS, 275, 113
- Tielens et al. (1999) Tielens, A. G. G. M., Hony, S., van Kerckhoven, C., & Peeters, E. 1999, in ESA SP-427: The Universe as Seen by ISO, Vol. 427, 579
- Tielens et al. (1993) Tielens, A. G. G. M., Meixner, M. M., van der Werf, P. P., et al. 1993, Sci, 262, 86
- Tokunaga et al. (1991) Tokunaga, A. T., Sellgren, K., Smith, R. G., et al. 1991, ApJ, 380, 452
- Uchida et al. (2000) Uchida, K. I., Sellgren, K., Werner, M. W., & Houdashelt, M. L. 2000, ApJ, 530, 817
- Ueta et al. (2001) Ueta, T., Meixner, M., Dayal, A., et al. 2001, ApJ, 548, 1020
- van den Ancker (1999) van den Ancker, M. 1999, Ph.D. Thesis
- van den Ancker et al. (2000) van den Ancker, M. E., Tielens, A. G. G. M., & Wesselius, P. R. 2000, A&A, 358, 1035
- Van Kerckhoven et al. (2000) Van Kerckhoven, C., Hony, S., Peeters, E., et al. 2000, A&A, 357, 1013
- Van Kerckhoven et al. (1999) Van Kerckhoven, C., Tielens, A. G. G. M., & Waelkens, C. 1999, in ESA SP-427: The Universe as Seen by ISO, Vol. 427, 421
- Vermeij et al. (2002) Vermeij, R., Peeters, E., Tielens, A. G. G. M., & van der Hulst, J. M. 2002, A&A, 382, 1042
- Verstraete et al. (2001) Verstraete, L., Pech, C., Moutou, C., et al. 2001, A&A, 372, 981
- Verstraete et al. (1996) Verstraete, L., Puget, J. L., Falgarone, E., et al. 1996, A&A, 315, L337
- Waelkens et al. (1996) Waelkens, C., Waters, L. B. F. M., de Graauw, M. S., et al. 1996, A&A, 315, L245
- Waters et al. (1998) Waters, L. B. F. M., Beintema, D. A., Zijlstra, A. A., et al. 1998, A&A, 331, L61
- Wesselius et al. (1996) Wesselius, P. R., van den Ancker, M. E., Young, E. T., et al. 1996, A&A, 315, L197