11email: isaviane@eso.org 22institutetext: Osservatorio Astronomico di Padova, vicolo dell’Osservatorio 5, I-35122 Padova, Italy
22email: (rizzi, held)@pd.astro.it 33institutetext: Dipartimento di Astronomia, Università di Padova, vicolo dell’Osservatorio 2, I-35122 Padova, Italy
33email: momany@pd.astro.it 44institutetext: Institute for Astronomy, University of Hawaii, 2680 Woodlawn Drive, Honolulu, HI 96822
44email: bresolin@ifa.hawaii.edu
New abundance measurements in UKS 1927–177, a very metal-poor galaxy in the Local Group ††thanks: Based on data collected at the European Southern Observatory, La Silla, Chile, prop. No. 63.N-0726B
We present new results from optical spectroscopy of the brightest Hii region in the dwarf irregular galaxy UKS 1927–177 in Sagittarius (SagDIG). From high signal-to-noise spectra, reddening-corrected line flux ratios have been measured with typical uncertainties of a few percent, from which the oxygen abundance is rediscussed, and new abundance estimates are derived for N and Ne. The O abundance in SagDIG, estimated with the empirical abundance indicator and other methods, is in the range to . The fact that SagDIG is times closer than I Zw 18 makes it an ideal target to test the hypothesis of the existence of young galaxies in the present-day universe. Indeed, stellar photometry suggests that this galaxy may harbor a stellar population older than a few Gyr, and possibly an old stellar component as well. The case of SagDIG therefore supports the view that very low chemical abundances can be maintained throughout the life of a dwarf stellar system, even in the presence of multiple star formation episodes.
Key Words.:
galaxies: individual (SagDIG) – galaxies: abundances – galaxies: dwarf – galaxies: ISM – galaxies: irregular – Local Group1 Introduction
The quest for very metal-poor galaxies started soon after the Searle and Sargent (ssargent72 (1972)) discovery that the interstellar medium (ISM) of I Zw 18, a blue compact dwarf galaxy, has an oxygen abundance that is of the solar one. As Searle & Sargent (ssargent72 (1972)) pointed out, this is compatible with two scenarios: either the galaxy is now experiencing its first star-formation (SF) episode, or, if it contains old stars, then its SF proceeds in strong bursts separated by quiescent phases. The first hypothesis (that of a primordial galaxy) is relevant in the context of cosmological models that assume hierarchical formation of structures in a cold dark matter dominated Universe. In that scenario, dwarf dark matter halos () would be the first objects to condense out of the Hubble flow, so it is important to understand whether they already contained stars before merging into larger galaxies. As a first step, we can start by answering a simple question: is there any galaxy with a very metal-poor young population and, at the same time, a old generation of stars? Such a finding would lead to the conclusion that very low metal abundances do not necessarily imply a very young age.
Although a red population was eventually revealed in I Zw 18 by Aloisi et al. (aloisi_etal99 (1999)), their data only allow for a look-back time of Gyr, due to the large distance of the galaxy. Izotov et al. (izotov_etal00 (2001)) argue that is a more realistic limit. As a consequence, active searches are carried out to find closer and comparably metal-poor galaxies, in order to have better chances to detect a cosmologically old population. In particular, low luminosity dwarf irregulars are promising candidates. It is still debated whether a definite luminosity-metallicity relation exists for dIrrs (Hidalgo-Gamez & Olofsson h-go98 (1998); Hunter & Hoffman hh99 (1999)), but it is nevertheless reasonable to expect that chemical abundances will be lower in low-luminosity galaxies.
Indeed, some new metal-poor, low-luminosity objects turned up in the past as a result of similar efforts. The situation has been conveniently summarized by Kniazev et al. (kniazev00 (2000)), who list two galaxies (besides I Zw 18) at . A few months later van Zee (vanZee00 (2000)) added UGCA 292 to the list of metal-poor galaxies, quoting , and pointed out that Leo A should be added to the list as well.
Stimulated by all these promising results, we turned our attention to UKS 1927–177 (SagDIG), since (a) its low luminosity is in the range of other metal-poor galaxies, (b) there was some indication that the oxygen abundance obtained by Skillman et al. (1989b , hereafter STM89), , could be revised downwards (see below), and (c) the other metal-poor galaxies (with the exception of Leo A) are more distant than . SagDIG is more than two magnitudes closer in distance modulus (thus its HB is within reach of HST observations in reasonable observing time).
The galaxy was discovered in 1977 by Cesarsky et al. (cesarsky_etal77 (1977)), and a shallow CMD was presented in Cook (cook87 (1987)). A CCD survey of its Hii regions was carried out by Strobel et al. (strobelEtal91 (1991); SHK91), using the telescope at Kitt Peak. Three objects were detected in a field of view of , with H fluxes of , , and . Optical spectrophotometry of the brightest object (object #3 in Table 8 of SHK91) was obtained by STM89, and an oxygen abundance of the solar value111In this paper we adopt the classical value from Anders & Grevesse (ande+grev89 (1989)). However, the solar oxygen abundance is currently debated, and a lower value might be appropriate (Holweger holweger01 (2001); Allende Prieto et al. alle+01 (2001)). could be determined, i.e. . Radio maps of the galaxy exist as well. Young & Lo (youngLo97 (1997)) presented deep VLA observations of the Hi in SagDIG. An amount of solar masses of H+He were detected, forming a circular ring which extends times farther than the optical extent of the star-forming regions.
The compactness of the galaxy, its low Galactic latitude, and the high foreground contamination had discouraged further broadband photometry until recently. In the last two years, imaging of this galaxy was presented by Karachentsev et al. (kara_etal99 (1999)) and Lee & Kim (lee_kim00 (2000)), who established the distance modulus at , and the RGB stellar metallicity at extremely low values ([Fe/H]). From surface photometry, Karachentsev et al. (kara_etal99 (1999)) found an integrated magnitude of , and with a synthetic CMD analysis, they concluded that the galaxy is currently experiencing a burst of star formation, the star formation rate (SFR) being times larger now than the life average.
A new imaging study of SagDIG is presented in a companion paper (Momany et al. yaz_sagdig (2001)). The most important results of our photometry is represented by an upward revision of the stellar metallicity of the galaxy and our analysis of the spatial distribution of different stellar populations as a function of age. Assuming a low reddening for old RGB stars, we derived [Fe/H] for the red giant branch stars.
In this paper we present our new determination of the oxygen, nitrogen, and neon abundances in the interstellar medium of UKS 1927–177, and discuss it in the context of the existence of primordial galaxies.
2 Observations and data reduction

Spectroscopic observations of SagDIG were carried out on 1999 August 10, at the ESO observatory in La Silla, Chile. The imaging spectrograph efosc2 attached to the ESO 3.6m telescope was used to secure low-resolution spectroscopy of SagDIG. The camera was equipped with a Loral/Lesser thinned, AR coated, UV flooded, pixel CCD (ESO CCD ). The pixels cover on the sky, with a resulting field of view of . Two grisms were employed to cover the wavelength ranges Å (grism #7) and Å (grism #9), respectively. The CCD was used in binning mode to increase the ratio, the resulting dispersion being Å/pixel for both grisms.
We observed the same Hii region studied by STM89, whose coordinates are ::, :: (J2000.0). The night was stable and photometric, with a fairly constant seeing of (FWHM) at H. Spectroscopic data comprise exposures of s with grism #7 and s using grism #9. In both cases, a slit width of was used. Spectrophotometric standards were observed during the night, selected from the catalogs of Oke (oke90 (1990)) and Hamuy et al. (hamuy92 (1992), hamuy94 (1994)).
Data reduction was performed using standard techniques in iraf222 IRAF is distributed by the National Optical Astronomy Observatories, which are operated by the Association of Universities for Research in Astronomy, Inc., under cooperative agreement with the National Science Foundation.. The raw two-dimensional images were bias subtracted and trimmed. Pixel-to-pixel variations were accounted for through division by a quartz lamp spectrum, after fitting a low-order polynomial along the dispersion. The splitting of the total exposure time in s exposures allowed us to remove the contamination from cosmic rays. Wavelength calibration was obtained from He-Ar exposures taken immediately before and after the object observations. Absolute flux calibration was achieved using standard stars, obtaining a final accuracy better than . One-dimensional spectra were extracted from the two-dimensional images by summing up all the pixels enclosed in the large profiles of H and H; the background and sky lines were subtracted by averaging a small region on either side of the extraction window.
| (Å) | Ident. | Grism #7 | Grism #9 | Redd. corrected |
|---|---|---|---|---|
| 3727 | [Oii] | 1.020.20 | – | 1.310.21 |
| 3835 | H9 | 0.080.15b | – | 0.100.16 |
| 3868 | [Neiii] | 0.130.05 | – | 0.160.08 |
| 3889 | H8 | 0.120.15b | – | 0.150.16 |
| 3970 | Ha | 0.170.15b | – | 0.210.16 |
| 4101 | H | 0.190.07 | – | 0.230.08 |
| 4340 | H | 0.360.11 | – | 0.410.11 |
| 4861 | H | 1.000.04 | 1.000.03 | 1.000.01 |
| 4959 | [Oiii] | 0.480.06 | 0.460.04 | 0.460.01 |
| 5007 | [Oiii] | 1.350.10 | 1.340.02 | 1.300.01 |
| 6563 | H | – | 3.580.03 | 2.850.05 |
| 6584 | [Nii] | – | 0.150.06 | 0.120.07 |
-
a
possible blend with 3968 [Oiii].
-
b
estimated maximum error (0.15) (see text).
Figure 1 shows the combined spectra used for measurements. The final resolution, measured either on sky lines or comparison lamp lines, is Å for grism and Å for grism . Table 1 presents the final results. From left to right, the columns report the line wavelength and identification, the H-normalized fluxes for grisms #7 and #9, and the reddening corrected fluxes (see below). Three emission lines ([Oiii] and H) are in common between the two grisms, showing no significant flux offset. In the worst case, that of the [Oiii] line, the agreement is better than . A deblending procedure was applied to the case of the [Nii] line to disentangle the contribution of the strong H. The error budget was estimated from the r.m.s. of line ratios measured on the different individual exposures. A maximum error of 15% on the flux ratio was attached to our estimate when the line is not detected in the single-exposure spectra.
The measured line ratios were corrected for the effects of reddening, measured by comparing the observed and the expected hydrogen line ratios. The theoretical H line ratios of Hummer & Storey (hummer (1987)) were used, assuming an electron temperature K. We set , and so that . The reddening constant was then computed using the Cardelli et al. (cardelli (1989)) extinction law, where , and we assumed . We obtained from the H/H ratio, and from the H/H ratio. As an alternate route, one can plot vs. and then find with a linear regression on the data. A weighted least-square fit on the first three H lines yields . Thus the value of the reddening constant is essentially fixed by the more accurate H/H ratio, and will be adopted in the rest of this paper. The reddening corrected flux ratios are listed in Table 1. When the same line is present in both the red and blue spectra, a weighted mean is computed before the correction is applied. In order to compute the final errors, the error contribution from the reddening correction was added in quadrature to the error on the flux.
3 Results
Chemical abundances were derived from these measurements using the iraf nebular package (Shaw & Dufour sd95 (1995)). The abundances were calculated assuming a constant electron temperature and density throughout the nebula. For optical spectra covering the observed wavelength range, the electron temperature should be obtained through -sensitive line ratios, e.g. from the ratio of [Oiii] lines (see Eq. 2.3 in Seaton seaton75 (1975)). However, the line was not detected even in our co-added spectra, so we had to use the so-called empirical method, which gives the total (O/H) abundance in terms of the parameter (Pagel et al. pagel_etal79 (1979); Edmunds & Pagel edm_pagel84 (1984)).
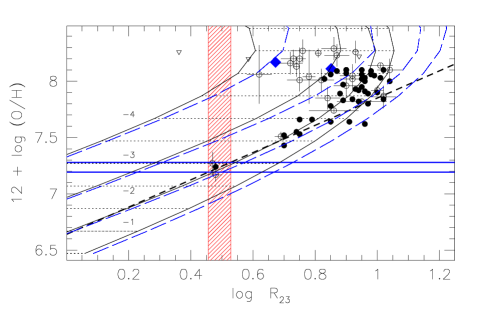
Oxygen abundances are plotted against in Figure 2, using literature samples of Hii regions spanning a wide range of abundances (Oey & Shields oey00 (2000); Díaz & Pérez-Montero dpm00 (2000); Kennicutt et al. kennicuttEtal00 (2000); McGaugh mcga91 (1991)). In the same diagram, we show a set of cloudy (Ferland et al. ferlandEtal98 (1998)) simulations, obtained assuming that the ionizing source is a single star with a Mihalas (mihalas72 (1972)) continuum, for choices of the ionization parameter ( and ) and varying the metallicity from to (solar composition). The effects of a change in the temperature of the ionizing star were checked by running the simulations for both and .
This figure, an updated version of Fig. 2 of Skillman (skillman89 (1989); hereafter S89) and Fig. 12 of McGaugh (mcga91 (1991)), shows that, for abundances , depends both on the metallicity and the ionization parameter of the nebula. The S89 relation corresponds to the lower branch of the models and to the most metal-poor objects in the data samples, irrespective of the effective temperature of the ionizing source.
Several authors have attempted to include both the effects of metallicity and ionization parameter in their empirical calibration methods. According to McGaugh (mcga91 (1991)), the parameter is useful to constrain . More recently, Pilyugin (pilyugin00 (2000), 2001a , 2001b ) has provided useful formulae to implement McGaugh corrections into the empirical method. Pilyugin (2001b ; hereafter P01) transformed the relation into a relation, where ). In this case he gives the equation of the surface, which is:
These revised methods may have problems at low values of the abundance and the ionization parameter. For example, the dwarf galaxies ESO 380-27 and GR 8 have similar , but for the former, and for the latter. The low excitation parameter then implies that GR 8 should have a lower , implying a higher oxygen abundance. Indeed, we find for the first, and for the second galaxy. The corrected empirical method would then predict that GR 8 should have an oxygen abundance higher than ESO 380-27, but in reality the measured abundance from the temperature determinations is lower in GR 8 than in ESO 380-27 (see Kunth & Sargent kunthSargent83 (1983); Skillman et al. skillmanEtal88 (1988)).

Given all these uncertainties, we used both the original implementation of the empirical method (as in STM89) and more recent methods to provide a range of [O/H] for SagDIG. High spectra taken at 10-m class telescopes will be needed to place better constraints on the SagDIG abundance, by allowing the measurement of the [Oiii] line.
Therefore, we firstly used the relative O fluxes listed in Table 1 to obtain (i.e. ). The calibration of S89 gives , where the range in variation has been obtained by propagating the error on . An application of the empirical calibration therefore indicates a very low oxygen abundance for the Sagittarius dwarf irregular galaxy. This value can be directly compared to the abundance obtained by STM89 using the same calibration. The new abundance estimate is lower by dex, and the difference is real and traced to the new flux measurements. Since our measurements from the red and blue efosc2 spectra are perfectly consistent, whereas the measurements of STM89 presented a internal scatter, we are confident in our revised fluxes (indeed, using only the STM89 red spectrum for the fluxes, we would obtain a value , in perfect agreement with ours).
Secondly, the revisions of the empirical method were taken into account by plotting in Fig. 3 the [Oiii]/[Oii] ratio against the for a subsample of very metal-poor dwarfs (see Fig. 10 in McGaugh mcga91 (1991)). The data are overplotted onto a model grid derived from the same cloudy models as in Fig. 2. In the case of SagDIG, we have , which implies . The position of SagDIG with respect to the lines of constant O abundance indicates a metallicity intermediate between those of I Zw 18 and GR 8, and close to that of HS0822+3542, for which Kniazev et al. (kniazev00 (2000)) give . Thus, taking into account in a differential way the information provided by the ionization indicator [Oiii]/[Oii], we find .
Finally, we evaluated the O abundance by using cloudy to optimize the fit to the observed line ratios. The best-fit is obtained for a value , i.e. 1/29 solar, with an electron temperature K and . Not surprisingly, this result is consistent with that inferred from Fig. 3.
To proceed further to estimate the N and Ne abundances in SagDIG, we need making some considerations (and assumptions) on the electron temperature and density in the nebula. A loose upper limit on the electron temperature is set by non-detection of the [Oiii] line. Experiments simulating faint emission lines yield a upper limit of on the flux of the line relative to H, which implies K according to the Seaton’s (seaton75 (1975)) relation. A temperature is needed in the nebular calculations to obtain an (O/H) value compatible with the results from the empirical method (assuming ). In fact, using these values we obtain and , yielding , (i.e. ). This choice of physical parameters predicts , implying that the line flux ratio should be , definitely lower than the minimum normalized flux that we have been able to measure.
Yet, the low surface brightness of the nebula seems to suggest a lower electron temperature and ionization parameter, in accord with the above cloudy model calculations. In view of these uncertainties, we adopt for electron temperature, implying for the O abundance in SagDIG, in accord with the different empirical approaches discussed above. For the nitrogen and neon ionic abundances in UKS 1927–177, and are derived. The total abundances can be computed following Peimbert & Costero (peimbertCostero69 (1969)) (see also van Zee vzee98 (1998)), obtaining and . This also implies and . The quoted uncertainties for the N and Ne abundances reflect the measurements errors and are larger than those related to the temperature range. Notwithstanding the above uncertainties, this represents the first measurement of N and Ne abundances in UKS 1927–177.
4 Discussion
Our results confirm that SagDIG is indeed one of the most metal poor galaxies, having abundances just higher than I Zw 18. In the Local Group, only Leo A has a comparably low metallicity. The nitrogen abundance of SagDIG is consistent with that of I Zw 18 (Izotov & Thuan izotov98 (1998)). For Leo A, van Zee et al. (vzee+99 (1999)) report a nitrogen abundance , similar to other low-metallicity galaxies.
Answering the question about whether SagDIG and Leo A are young galaxies rests on the results of resolved photometry. For SagDIG, ground based observations indicate the presence of an intermediate-age stellar population in addition to the young stars (Karachentsev et al. kara_etal99 (1999); Momany et al. yaz_sagdig (2001)), but the presence of a really old component is still unproven. As is the case of Leo I, where wide-field observations have revealed an old HB (Held et al. held_etal00 (2000), held_etal01 (2001)), deep hst observations of SagDIG may eventually answer the original question of how old this metal-poor galaxy is.
In Leo A, Tolstoy et al. (tolstoy_etal (1998)) could not rule out the presence of such a population in their hst photometry, although it must be a minor component. Recently, Dolphin et al. (dolp+02 (2002)) have detected a few candidate RR Lyrae variable stars, indicating the presence of an old (globular cluster like) stellar population accounting for at least 0.1% of the galaxy’s luminosity.
Finally, it is important to check that the low metal content of SagDIG is the result of normal chemical evolution, and not, for example, of gas stripping by a massive neighbor. Indeed, its position at the margins of the Local Group seems to ensure self-regulated evolution, an idea that we reinforce by the following simple considerations of chemical evolution.
In the closed-box model, the expected ISM oxygen abundance is given by (Searle & Sargent ssargent72 (1972)). A “standard” value for the yield of oxygen, , is of the solar abundance, i.e. (e.g. Pagel pagel97 (1997)); and is the ratio of the gas mass over total mass ( is the mass in stars).
The gas mass given by Young & Lo (youngLo97 (1997)) is , and the mass in stars and remnants, computed by integrating the SFR given by Karachentsev et al. (kara_etal99 (1999)) in three age intervals, is . We thus obtain , a value that in the closed-box model implies , higher than the measured one. We would need to reproduce our observation. The observed lower O abundance could be explained if part of the enriched gas is lost into the intergalactic medium. With some algebra, we find that the mass lost should be . According to Karachentsev et al. (kara_etal99 (1999)), the SFR during the last was times higher than in the past, with a further enhancement during the last . If we assume that the mass loss occurred during the last million years, then we obtain a mass outflow of , while if the mass outflow occurred during the last million years. These are not unreasonable values, since for example outflows of the order of are observed in the case of NGC 1705 (Meurer et al. meurer_etal98 (1998)), another isolated dwarf galaxy.
Using the higher value of the gas fraction, we find an average metallicity for the stellar component which is in agreement with the values derived from broadband photometry. Using Eq. (8.7) of Pagel (1997), an average oxygen abundance of solar is obtained for the stars. For solar-scaled metal abundances, this would mean a metallicity , which agrees with the stellar metallicity measured by Momany et al. (yaz_sagdig (2001)), [Fe/H].
Our conclusion that a very metal-poor ISM is present in SagDIG goes in the direction of the accumulating evidence that very low oxygen abundances can be maintained throughout the life of a dwarf galaxy, even if it is not experiencing its first star formation episode, and without invoking special environmental conditions. It is fairly common that galaxies once believed to contain only a young population actually reveal an old halo when modern data are obtained (see Kunth & Östlin kunthOstlin00 (2000) for a review; also Saviane et al. saviane_etal01 (2001)).
Acknowledgements.
We thank Michael Sterzik for his precious help with the observations, and Stefano Ciroi for sharing with us his expertise in cloudy. We also thank the referee, Dr. C. Leitherer, for helpful comments.References
- (1) Allende Prieto, C., Lambert, D. L., & Asplund, M. 2001, ApJ, 556, L63
- (2) Aloisi, A., Tosi, M., & Greggio, L. 1999, AJ, 118, 302
- (3) Anders, E., & Grevesse, N. 1989, Geochim. Cosmochim. Acta, 53, 197
- (4) Cardelli, J. A., Clayton, G. C., & Mathis, J. S. 1989, ApJ, 345, 245
- (5) Cesarsky, D. A., Lequeux, J., Laustsen, S., Schuster, H.-E., & West, R. M. 1977, A&A, 61, L31
- (6) Cook K.H., 1987, Ph.D. Thesis, University of Arizona
- (7) Díaz, A. I., & Pérez-Montero, E. 2000, MNRAS, 312, 130
- (8) Dolphin, A. E., Saha, A., Claver, et al. 2002, AJ in press [astro-ph/0202381]
- (9) Edmunds, M. G., & Pagel, B. E. J. 1984, MNRAS, 211, 507
- (10) Ferland, G. J., Korista, K. T., Verner, D. A., Ferguson, J. W., Kingdon, J. B., & Verner, E. M. 1998, PASP, 110, 761
- (11) Hamuy, M., Walker, A. R., Suntzeff, N. B., Gigoux, P., Heathcote, S. R., & Phillips, M. M. 1992, PASP, 104, 533
- (12) Hamuy, M., Suntzeff, N. B., Heathcote, S. R., Walker, A. R., Gigoux, P., & Phillips, M. M. 1994, PASP, 106, 566
- (13) Held, E. V., Saviane, I., Momany, Y., & Carraro, G. 2000, ApJ, 530, L85
- (14) Held, E. V., Clementini, G., Rizzi, L., Momany, Y., Saviane, I., & Di Fabrizio, L. 2001, ApJ, 562, L39
- (15) Hidalgo-Gamez, A. M., & Olofsson, K. 1998, A&A, 334, 45
- (16) Holweger, H. 2001, in Proceedings of the Joint SOHO/ACE workshop Solar and Galactic Composition, ed. R. F. Wimmer-Schweingruber, AIP Conf. Proc. 598, p.23
- (17) Hummer, D. G., & Storey, P. J. 1987, MNRAS, 224, 801
- (18) Hunter, D. A., & Hoffman, L. 1999, AJ, 117, 2789
- (19) Izotov, Y. I. & Thuan, T. X. 1998, ApJ, 497, 227
- (20) Izotov, Y. I., Chaffee, F. H., Foltz, C. B., et al. 2001, ApJ, 560, 222
- (21) Karachentsev, I., Aparicio, A., & Makarova, L. 1999, A&A, 352, 363
- (22) Kennicutt, R. C., Bresolin, F., French, H., & Martin, P. 2000, ApJ, 537, 589
- (23) Kniazev, A. Y., Pustilnik, S. A., Masegosa, J., et al. 2000, A&A, 357, 101
- (24) Kunth, D., & Östlin, G. 2000, A&A Rev., 10, 1
- (25) Kunth, D., & Sargent, W. L. W. 1983, ApJ, 273, 81
- (26) Lee, M. G., & Kim, S. C. 2000, AJ, 119, 777
- (27) Mc Gaugh, S. 1991, ApJ, 380, 140
- (28) Meurer, G. R., Staveley-Smith, L., & Killeen, N. E. B. 1998, MNRAS, 300, 705
- (29) Mihalas, D. 1972, Non-LTE Model Atmospheres for B & O Stars, NCAR-TN/STR-76
- (30) Momany, Y., Held, E. V., Saviane, I., & Rizzi, L. 2001, A&A, 384, 393
- (31) Oey, M. S., & Shields, J. C. 2000, ApJ, 539, 687
- (32) Oke, J. B. 1990, AJ, 99, 1621
- (33) Osterbrock, D. E. 1989, Astrophysics of Gaseous Nebulae and Active Galactic Nuclei (Mill Valley: Univ. Sci.)
- (34) Pagel, B. E. J. 1997, Nucleosynthesis and Chemical Evolution of Galaxies (Cambridge: Cambridge University Press)
- (35) Pagel, B. E. J., Edmunds, M. G., Blackwell, D. E., Chun, M. S., & Smith, G. 1979, MNRAS, 189, 95
- (36) Peimbert, M., & Costero, R. 1969, Bol. Obs. Tonantzintla y Tacubaya, 5, 3
- (37) Pilyugin, L. S. 2000, A&A, 362, 325
- (38) Pilyugin, L. S. 2001a, A&A, 369, 594
- (39) Pilyugin, L. S. 2001b, A&A, 374, 412
- (40) Saviane, I., Held, E. V., Momany Y., & Rizzi, L. 2001, in Proceedings of the 44th National Congress of the Italian Astron. Society, eds. L. A. Antonelli, G. Bono, G. Giobbi, & N. Menci, Mem.S.A.It. 72, n.4, 773
- (41) Searle, L., & Sargent, W. L. W. 1972, ApJ, 173, 25
- (42) Seaton, M. J. 1975, MNRAS, 170, 475
- (43) Shaw, R. A., & Dufour, R. J. 1995, PASP, 107, 896
- (44) Skillman, E. D. 1989, ApJ, 347, 883 (S89)
- (45) Skillman, E. D., Kennicutt, R. C., & Hodge, P. W. 1989, ApJ, 347, 875
- (46) Skillman, E. D., Terlevich, R., & Melnick, J. 1989, MNRAS, 240, 563 (STM89)
- (47) Skillman, E. D., Melnick, J., Terlevich, R., Moles, M. 1988, MNRAS, 230, 563
- (48) Strobel, N. V., Hodge, P., & Kennicutt, R. C. 1991, ApJ, 383, 148 (SHK91)
- (49) Tolstoy, E., Gallagher, J. S., Cole, A. A., et al. 1998, AJ, 116, 1244
- (50) van Zee, L. 2000, ApJ, 543, L31
- (51) van Zee, L., Salzer, J. J., Haynes, M. P., O’Donoghue, A. A., & Balonek, T. J. 1998, AJ, 116, 2805
- (52) van Zee, L., Skillman, E. D., Haynes, M. P. 1999, AAS, 194, #05.04
- (53) Young, L. M., & Lo, K. Y. 1997, ApJ, 490, 710