The complex iron line in NGC 7469 observed by BeppoSAX
Abstract
In this letter we present analysis of BeppoSAX data from a long look at the Seyfert 1 galaxy NGC 7469. The presence of a soft excess below 0.8 keV is confirmed by our analysis and no warm absorber component is required to fit the spectrum. A complex iron emission line and the Compton reflection hump are clearly detected. The profile of the line is too broad to associate this feature with distant matter. In addition, the observed soft excess and the energy of the iron line EFe=6.8 keV strongly support a scenario in which the hard X-rays are reprocessed by a photoionized accretion disc. This hypothesis was tested fitting the BeppoSAX spectrum with the ionized disc reflection model of Ross & Fabian. A second narrow line component, in addition to that produced in the disc, is also required to fit the observed iron line profile. A high energy cut-off around 150 keV is clearly detected in the spectrum.
keywords:
Galaxies: individual: NGC 7469 – Galaxies: Seyfert – X-rays: galaxies1 Introduction
A narrow iron line component is clearly detected in recent Chandra (Kaspi et al. 2001, Yaqoob et al. 2001) and XMM observations (Reeves et al. 2001, Pounds et al. 2001) of some Seyfert 1 galaxies. These observations suggest that part of the Fe line is produced very far from the accretion disc. A strong broad iron line component is found in the X-ray spectra of many Seyfert galaxies (Fabian et al. 2000) by ASCA (Nandra et al. 1997, Tanaka et al. 1995, Yaqoob et al. 2002), XMM (Wilms et al. 2001) and BeppoSAX (Guainazzi et al. 1999, De Rosa et al. 2002).
The near (z0.017) Seyfert 1 NGC 7469 shows a very complex X-ray spectrum. EXOSAT observed a soft excess in this source (Barr 1986) which was confirmed by Einstein (Turner et al. 1991). Two ROSAT observations in 1991 (Turner et al. 1993) and 1992 (Brandt et al. 1993) did not resolve the origin of the soft spectral component (e.g. a soft excess, a warm absorber or a combination of the two). No evidence of a warm absorber was found in the 1993 ASCA spectrum (Guainazzi et al. 1994). An iron emission line and a flattening of the spectrum above 10 keV were detected by Ginga (Piro et al. 1990). When the spectrum above 10 keV was reproduced with a cold Compton reflection component (George & Fabian 1991; Matt, Perola & Piro 1991), the intrinsic photon index was = 1.99 (Nandra 1991), while a partial covering model yielded = 1.92 0.03 (Piro et al. 1990). The line profile was found to be narrow ( 150 eV) in the ASCA spectrum (Guainazzi et al. 1994), suggesting that the reprocessing material has to be far from the central source (several hundreds of Schwarzschild radii). Nevertheless Nandra et al. (1997) found marginal evidence of a broad component of the iron line in analysing the ASCA spectrum.
The broad band of BeppoSAX (Boella et al. 1997) is particularly suited to the deconvolution of such complex spectra. In this letter we present the analysis of a BeppoSAX week-long observation of NGC 7469 in 1999. This spectrum was already analysed by Perola et al. (2002) within a sample of nine sources observed with BeppoSAX. Their analysis showed evidence of soft excess component and a not resolved iron line was also detected, indicating a component from the centre of the accretion flow.
2 Observation
BeppoSAX observed NGC 7469 from 1999 November 23 to 1999 November 29. The net exposure time in the MECS was 249180 s. The observed mean flux was Ferg cm-2 s-1 for our best fit model (see Table 1). Spectra were extracted within a circular region centered on the source with radii of 4’ and 6’ for MECS and LECS respectively. The background was extracted from event files of source-free regions (“blank fields”). The PDS spectrum was filtered with fixed rise time. The BeppoSAX data were then fitted using the XSPEC 11.1 package. All quoted uncertainties correspond to 90 per cent confidence intervals for one interesting parameter (=2.71). Each model we tested was multiplied by a normalization constant in order to take into account possible miscalibrations between the different instruments. We allowed the PDS/MECS normalization to vary between 0.77 and 0.95, while the LECS/MECS normalization ratio was running between 0.7 and 1 (Fiore, Guainazzi & Grandi 1999).
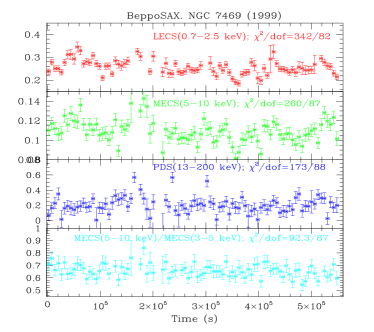
In Figure 1 we show the LECS (0.7-2.5 keV), MECS (5-10 keV) and PDS (13-200 keV) lightcurves, the hardness ratio MECS (5-10 keV) / MECS (3-10 keV) is also plotted in the last panel. In each plot we reported the dof for a constant hypothesis. Even if the source showed flux variability in the soft, medium and hard energy range (P 10-3 for LECS, MECS and PDS lightcurves), the MECS hardness ratio (which is in the energy range of interest to investigate the Fe line behaviour) is in good agreement with a constant value (P= 0.33). A detailed discussion about the complex spectral variability in NGC 7469 (Nandra & Papadakis 2001 and references therein), is beyond the focus of this letter.


| Model | kTBB | R | Ecut-off | EL | or Rout | EW | ||
|---|---|---|---|---|---|---|---|---|
| (eV) | (keV) | (keV) | (keV) or (∙RG) | (eV) | ||||
| Single gaussian | 80 | 2.07 | 1.490.40 | 245 | 6.42 | 0.39 | 17580 | 151.3/136 |
| Diskline♭ | 849 | 2.060.02 | 1.4 | 260 | 6.60 | 52 | 18070 | 155.5/136 |
| Diskline♭ + Narrow gaussian⋆ | 84 | 2.060.02 | 1.8 | 140 | 6.82 0.15 | 15 | 121 100 | 142.9/134 |
| 75 40 |
| Model | log | R | †rin | rout | EL | |||
|---|---|---|---|---|---|---|---|---|
| (∘) | (RG) | (RG) | (keV) | |||||
| Ionized disc | 2.01 0.02 | 1.08 | 0.95 | 20.6 | 6 | ‡107 | - | 169/139 |
| Ionized disc + gaussian | 2.02 0.02 | 1.210.02 | 0.87 | 37.8 | 6 | 51 | 6.30 0.05 | 151.9/137 |
| ASCA | ||||||||
| Ionized disc + gaussian | 2.02 0.03 | 1 (frozen) | 40 | 6 | ‡107 | 6.360.06 | 399.3/378 |
3 Results
We fitted the LECS (0.2-3 keV), MECS (1.5-10 keV) and PDS (13-200 keV) data simultaneously. In Figure 2 we show the data and data/model ratio when the whole BeppoSAX spectrum is fitted by an absorbed ( the Galactic value from Elvis et al. 1989) power law. This model is clearly inadequate, with several features emerging from the spectra: an excess at energy less than 1 keV, an iron line component with the Compton reflection hump, and a deficit of counts above 70 keV.
The baseline model we employed to fit the data consisted of an absorbed cut-off power law, a cold reflection component (PEXRAV in XSPEC Magdziarz & Zdziarski 1995) and a black body to reproduce the excess at low energy. The probability to exceeding F with the addition of the high energy cut off in the baseline model is P 96.5 per cent. In Figure 3 the MECS data/model ratio is shown when the baseline model is applied to the whole BeppoSAX band, but excluding 4-7.5 keV energy range where a relativistic iron line is expected to be present. The ratio in Figure 3 shows clearly the presence of a complex iron line. We tried several models to fit the line profile and all the best fit parameters are shown in Table 1. A single gaussian is clearly inadequate (=151.3/136). The second step was to substitute an unphysical broad gaussian component with a physical model for a relativistic profile of the line (DISKLINE in XSPEC, Fabian et al. 1989). The model is still inadequate to reproduce the line residuals (/dof=155.5/136). The addition of a second narrow gaussian component at the energy of the neutral iron yields a significant decrease of (=13 with the addition of 2 free parameters. PF=99.70 per cent). The EW was 121 100 eV and 75 40 eV for the broad and narrow components respectively. The centroid of the relativistic line EL=6.82 0.15 keV, indicates He-like iron.
Two gaussian narrow lines give a fair (/dof=142/135). The second line (EW=5736 eV) lies to the energy of highly ionized iron E=6.94 keV, i.e. H-like iron. This component has to be produced in a gas characterized by an ionization parameter 2000 erg cm s-1 (Matt et al. 1996). Assuming a temperature T=106 K, the total recombination rate to all states for FeXXVI is cm3 s-1 (Seaton 1959), and the line emissivity is , with and the iron aboundance and the iron effective fluorescent yield respectively. In the case of a simple spherical geometry if we assume a ionizing luminosity 1043 erg s-1, and with the observed H-like iron line luminosity 1041 erg s-1, we can estimate a lower limit to the electron number density cm-3 (assuming of Morrison & McCammon 1983 and by Matt et al. 1993b for a temperature of 106 K) and then an upper limit for the distance of the gas from the ionizing central source, R cm. This means that such gas must lie within few hundred Schwarzschild radii (Rs=2GM/c2) of the central black hole (assuming a mass for it of 107 M⊙, Wandel et al. 1999).
The fit with two gaussian emission lines (one narrow) is still perfectly acceptable (/dof=133/134), nevertheless the extremely large value of the intrinsic width of the broad component (=1.8 keV) indicates a poor description of the continuum at the energy of the line. Thus we are lead to believe that a diskline + gaussian component is a more suitable and physically consistent model to reproduce the Fe emission line observed in NGC 7469.
The presence of an ionized iron line and of a soft emission component, together with an unusual value of the relative reflection, significant greater than 1 (R=1.8, see Table 1), strongly suggests the hypothesis that all these features could be the result of hard X-ray reprocessing in a hot ionized accretion disc (Matt et al. 1993a, 1996, Ross, Fabian & Young 1999, Nayakshin et al. 2000, Ballantyne et al. 2001). We tested an ionized reflection model which takes into account the reflected spectrum of the disc in the whole BeppoSAX energy range. The model we employed was that of Ross & Fabian (1993). The most important quantity in determining the shape of the reflected continuum is the ionization parameter , where FX is the X-ray flux (between 0.1-100 keV) illuminating a slab of gas with solar abundances and constant hydrogen number density nH=1015 cm-3. The incident flux is assumed be a power law with spectral photon index and a high energy cut-off at 100 keV. The computed reflected spectrum is multiplied for a factor R (“reflected fraction”) and added to the primary continuum. This model includes the Fe K emission line and the spectral features at low energy (emission lines and recombination continuum). Larger values of indicates a more ionized disc which will affect the strength and width of the iron line (Matt et al. 1993a, 1996), and the absorption edges. The soft emission from the accretion disc is not take into account to determine the reprocessing features. During the fit we applied to the spectrum a relativistic blurring appropriate for a Schwarzschild geometry assuming a disc emissivity law (Fabian et al. 1989).
Fitting the spectrum with an ionized disc model (see Table 2) with solar Fe abundance does not give a satisfactory result (=169/139). Clear residuals can be observed at the energy of the iron line (see Figure 4). To increase the Fe emissivity to reproduce the observed strength of the line we tried to fit the data with an ionized reflection model with 2 and 5 times solar Fe abundances. Nevertheless these models are inadequate to fit the soft part of the spectrum, and the result of the fit is poor (=187/139, =205/139). A better model to reproduce the iron line residuals is to add a narrow line component. The ionized disc model with an additional gaussian component finally give us a good fit (=17 for the sum of two interesting parameters. PF=99.97 per cent) and no large residuals can be found at the energy of the iron line (see Figure 5). The best fit parameters for the several ionized reflection models we employed are shown in Table 2. In Figure 6 we plot the confidence contours (68, 95 and 99 per cent) Reflection fraction and photon index for the ionized disc plus gaussian line model.
No additional (cold or ionized) iron edge is required to fit the spectrum. If we add an absorption edge with the energy fixed to the value for cold iron Eedge=7.1 keV, the fit worsens and we find a very low upper limit for the optical depth 0.01.
The soft excess at low energy can not be accounted for by a warm absorber component. If we substitute the black body in the last model in Table 1, with two absorption edges at the energy of the OVII (0.74 keV) and OVIII (0.87 keV), the fit is worse (=150/134). The same result is obtained using a more detailed description of the warm absorber with ABSORI model in XSPEC. A warm absorber component is not required to fit the low energy data of NGC 7469 (PF=34 per cent).
Piro et al. (1990) showed that the GINGA spectrum of NGC 7469 observed in 1988 could be reproduced by a “partial covering” model (Holt et al. 1980). In this scenario an absorbing medium is supposed to cover only a fraction of the central source with a column density NHcov. The direct X-ray would be blocked at low energy, but would penetrate through the absorbing gas above 5 keV imprinting the curvature in the observed spectrum. Nevertheless Leighly et al. (1996) showed that this model was not able to explain the observed flux and spectral variability in NGC 7469.
When we model the BeppoSAX spectrum of NGC 7469 with partial covering the fit is fair (=142.7/136), with N cm-2 and = (0.32 0.04), and the EW of the iron line EW=69 20 eV. Nevertheless the expected value of the equivalent width for an optically thin medium illuminated by an isotropic continuum, with a Fe solar abundance and the NHcov and obtained by BeppoSAX observation, is in the range 100-200 eV, i.e. larger than that observed in the spectrum. This evidence together with the complex profile of the Fe line and the soft X-ray excess, make the reflection from a (possibly ionized) accretion disc the most appealing scenario.
4 Discussions and conclusions
The BeppoSAX long look at NGC 7469 shows a very complex X-ray spectrum. Both a soft excess component and reprocessing features are detected. The continuum emission can be reproduced either with a cold reflection model and a black body component (with temperature kT 84 eV fully consistent with that measured by ASCA, Guainazzi et al. 1994) or with an ionized disc reflection model that takes into account the disc emissivity below 0.8 keV. Whichever model we employ to fit the spectrum, the observed iron line requires a complex profile which is hard to associate with a distant reflector. In addition the energy of the relativistic line E=6.8 keV corresponds to high ionized iron that can not be reconciled with the cold disc scenario.
An ionized iron line component was already observed by XMM in Mkn 509 (Pounds et al. 2001), Mkn 205 (Reeves et al. 2001) and NGC 5506 (Matt et al. 2001). In this last source a solution in term of a blend of He- and H- like narrow iron line is preferable to that of a relativistic ionized disc, but in Mkn 509 and Mkn 205 this feature was explained in terms of an ionized accretion disc. In the case of NGC 7469 the predicted iron line component from the ionized disc model does not fit the whole observed profile. A narrow line component has to be included in the model. The origin of this second component is still a matter of debate. It has been detected in many Seyfert 1s observed so far by Chandra (Kaspi et al. 2001, Yaqoob et al. 2001) and XMM (Pounds et al. 2001, Reeves et al. 2001). It is associated with a region distant from the central source and probably coincident either with a Compton thick gas, e.g. the “torus” obscuring the Seyfert 2s (Antonucci 1993, Ghisellini et al. 1994) or with the Compton thin BLR. At least in the cases of NGC 4051 (Guainazzi et al. 1998) and NGC 5506 (Matt et al. 2001) the narrow core of the iron line was associated to a Compton thick gas. Nevertheless the bulk of the Compton reflection in NGC 7469 can be completely associated with the ionized disc (see Figure 6) iron component. In fact with the combination of a cold and an ionized Compton reflection we obtained a very poor fit (=156.4/135).
Even if a partial covering model can reproduce the observed BeppoSAX spectrum, the value of the equivalent width of the iron line predicted in this model is significantly larger than that measured. This could require that the covering medium has a small solid angle at the source.
A warm absorber component is not required to fit the BeppoSAX low energy spectrum, this allowed us to detect the redward extent of the iron line, and thus constrain the inner radius of the disc.
A double iron line component also can reproduce the observed profile. We cannot rule out the possibility that the second H-like iron component is created in a warm (T K) gas within a few 100s Rs of the central source.
Finally to check our results we fitted the the ASCA spectrum above 1 keV (SIS0 and GIS2, sequence number 71028030, from the Tartarus database) with an ionized disc reflection model. The fit was good (=399.3/378) and the ionization parameter was consistent with that observed in the BeppoSAX spectrum, log . A narrow line component also is really marginally required (PF=92 per cent) to fit the Fe line. The flux of this component was the same in the two observations, while the flux in 2-10 keV was higher by 30 per cent during the SAX long look. Nevertheless the uncertainty on the line intensity rends any result about variability inconclusive.

Acknowledgments
We thank David Ballantyne for computing the grid of ionized disc models. A.D.R acknowledges the European Association for Research in Astronomy (EARA) Marie Curie for financial support. The BeppoSAX satellite is a joint Italian-Dutch program.
References
- [Antonucci 1993] Antonucci R., 1993, ARA&A, 31, 473
- [Ballantyne et al. 2001] Ballantyne D., Ross R.R., Fabian A.C., 2001, MNRAS, 327, 10
- [Barr 1986] Barr P., 1986, MNRAS, 223, 29p
- [Boella et al. 1997] Boella G., Butler R.C., Perola G.C, Piro L., Scarsi L., Bleeker J., 1997, A&A 122, 299
- [Brandt et al. 993] Brandt W.N., Fabian A.C. Nandra K., Tsuruta S., 1993, MNRAS, 265, 996
- [De Rosa et al. 2002] De Rosa A., Piro L., Fiore F., Grandi P., Maraschi L., Matt G., Nicastro F., Petrucci P.O., 2002, A&A, 38, 838
- [Elvis et al. 1989] Elvis M., Lockman F.J., Wilkes B. 1989, AJ, 97, 777
- [Fabian et al. 1989] Fabian A.C., Rees M.J., Stella L., White N.E., 1989, MNRAS, 238, 729
- [Fabian et al. 2000] Fabian, A.C., Iwasawa K., Reynolds C.S., Young, A.J., 2000, PASP, 112, 1145
- [Fiore, Guainazzi & Grandi 1999] Fiore F., Guainazzi G., Grandi P. 1999, Cookbook for BeppoSAX NFI Spectral analysis. SDC report. (Available from http://asdc.asi.it/bepposax/software/index.html)
- [George & Fabian 1991] George I.M. & fabian A.C., 1991, MNRAS, 249, 352
- [Ghisellini et al. 1994] Ghisellini F., Haardt F., Matt G., 1994, MNRAS, 267, 743
- [Guainazzi et al. 1994] Guainazzi M, Matsuoka M., Piro L., Mihara T., Yamauchi M., 1994, ApJ, 436, L35
- [Guainazzi et al. 1998] Guainazzi M., Nicastro F., Fiore F., Matt G., McHardy I., Orr A., Barr P., Fruscione A., Papadakis I., Parmar A.N., Uttley P., Perola G.C., Piro L., 1998, MNRAS, 301, L1
- [Guainazzi et al. 1999] Guainazzi M., Matt G., Molendi S., Orr A., Fiore, F., Grandi P., Matteuzzi, A., Mineo, T., Perola G.C., Parmar A.N., Piro L., 1999 A&A, 341, L27
- [Holt et al. 1980] Holt S.S., Mushotzky R.F., Boldt E.A., Serlemitsos P.J., Becker R.H., Szymkowiak A.E., White N.E., 1980, ApJ, 241, L13
- [Kaspi et al. 2001] Kaspi S., Brandt W.N., Netzer H., George I., Chartas G., Behar E., Sambruna R., Garmire G. and Nousek J. 2001, ApJ, 554, 216
- [Leighly et al. 1996] Leighly K., Kunieda H., Awaki H., Tsuruta S., 1996 ApJ, 463, 158
- [Magdziarz & Zdziarski 1995] Magdziarz P. & Zdziarski A.A. 1995, MNRAS, 273, 837
- [Matt, Perola & Piro 1991] Matt G., Perola G.C., Piro L. 1991, A&A, 247, 25
- [Matt et al. 1993a] Matt G., Fabian A.C., Ross R.R., 1993a, MNRAS, 262, 179
- [Matt et al. 1993b] Matt G., Brandt W.N. and Fabian A.C., 1993b, MNRAS, 280, 823
- [Matt et al. 1996] Matt G., Fabian A.C., Ross R.R., 1996, MNRAS, 278, 1111
- [Matt et al. 2001] Matt G., Guainazzi M., Perola G. C.,Fiore F., Nicastro F.,Cappi M., Piro L., 2001b, A&A, 377, L31
- [Morrison & McCammon 1983] Morrison R. & McCammon D., 1983, ApJ, 270, 119
- [Nandra 1991] Nandra K., 1991, PhD thesis, Leicester University
- [Nandra et al. 1997] Nandra, K., George I.M., Mushotzky R.F., Turner T.J., Yaqoob, T., 1997, ApJ, 477, 602
- [Nandra & Papadakis 2001] Nandra K. & Papadakis I.E., 2001, ApJ, 554, 710
- [Nayakshin et al. 2000] Nayakshin S., Kazanas D., Kallmann T., 2000, ApJ, 537, 833
- [Perola et al. 2001] Perola G.C., Matt G., Cappi M., Fiore F., Guainazzi M., Maraschi L., Petrucci P.O., L. Piro, 2002, A&A, accepted, astro-ph/0205045
- [Piro et al. 1990] Piro L, Yamauchi M. & Matsuoka M., 1990, ApJ, 360, L35
- [Pounds et al. 2001] Pounds K., Reeves J., O’Brien P., Page K., Turner M., Nayakshin S., 2001, ApJ, 559, 181
- [Reeves et al. 2001] Reeves J.N., Turner M., Pounds K., O’Brien P., Boller Th., Ferrando P., Kendziorra E., Vercellone S., 2001, ApJ, 365L, 134
- [Ross, Fabian & Young 1999] Ross R.R., Fabian A.C., Young A.J., 1999, MNRAS, 306, 461
- [Rees & Fabian 1993] Ross R.R. & Fabian A.C., 1993 MNRAS, 261, 74
- [Seaton 1959] Seaton M.J., 1959, MNRAS, 119, 81.
- [Tanaka et al. 1995] Tanaka Y, Nandra K., Fabian A.C., Inoue H., Otani C., Dotani T., Hayashida K., Iwasawa K., Kii T., Kunieda H., Makino F., Matsuoka M., 1995, Nature, 375, 659
- [Turner et al. 1991] Turner T.J., Weaver K.A., Mushotzky R.F., Holt S.S., Madejeski G.M., 1991, ApJ, 381, 85
- [Turner et al. 1993] Turner T.J., George I.M., Mushotzky R.F., 1993, ApJ, 412, 72
- [Yaqoob et al. 2001] Yaqoob, T., George I.M., Nandra K., Turner T.J., Serlemitsos P.J., Mushotzky R.F., 2001, ApJ, 546, 759
- [Yaqoob et al. 2002] Yaqoob T., Padmanabhan U, Dotani T, Nandra K., ApJ, accepted. astro-ph/0112318
- [Wandel et al. 1999] Wandel A., Peterson B.M. and Malkan M.A., 1999, ApJ, 526, 579.
- [Wilms et al. 2001] Wilms J., reynolds C.S., begelman M.C., Reeves J., MOlendi S., Staubert R., Kendziorra E., 2001, MNRAS, 328, L27