The nature of the X-ray transient SAX J1711.6-3808
SAX J1711.6-3808 is an X-ray transient in the Galactic bulge that was active from January through May of 2001 and whose maximum 1-200 keV luminosity was measured to be erg cm-2s-1 which is less than 25% of the Eddington limit, if placed at a distance equal to that of the galactic center. We study the X-ray data that were taken of this moderately bright transient with instruments on BeppoSAX and RXTE. The spectrum shows two interesting features on top of a Comptonized continuum commonly observed in low-state X-ray binaries: a broad emission feature peaking at 7 keV and extending from 4 to 9 keV, and a soft excess with a color temperature below 1 keV which reveals itself only during one week of data. High time-resolution analysis of 412 ksec worth of data fails to show bursts, coherent or high-frequency quasi-periodic oscillations. Given the dynamic range of the flux measurements, this would be unusual if a neutron star were present. SAX J1711.6-3808 appears likely to contain a black hole. No quiescent optical counterpart could be identified in archival data within the 5″-radius XMM error circle, but the limits are not very constraining because of heavy extinction ().
Key Words.:
accretion, accretion disks – binaries: close – X-rays: stars: individual (SAX J1711.6-3808)1 Introduction
Dedicated monitoring programs with the BeppoSAX Wide Field Cameras (WFCs; e.g. In ’t Zand 2001) and the RXTE Proportional Counter Array (PCA; Swank & Markwardt 2001) have revealed in recent years tens of faint X-ray binary transients in a field around the galactic center. About three quarters of these exhibit type-I X-ray bursts, diagnosing the compact component as a neutron star. Others involve optically confirmed black hole systems (e.g., SAX J1819.3-2525=XTE J1819-253 [Orosz et al. 2001]) and microquasar-type suspected black hole systems (e.g. XTE J1748-288 [Naik et al. 2000; Revnivtsev et al. 2000]).
A recent addition to the group of faint transients is SAX J1711.6-3808 which was discovered in an observation with the BeppoSAX Wide Field Cameras during Feb. 8.8-11.5, 2001 when the average flux was 55 mCrab in the 2 to 9 keV bandpass (In ’t Zand, Kaptein & Heise 2001). Its galactic coordinates are . This source was followed up with sensitive X-ray devices on BeppoSAX, RXTE, and XMM-Newton. Wijnands & Miller (2002) reported on an analysis carried out on part of the RXTE-PCA data and found that the soft/hard state behavior is decoupled from the X-ray luminosity and possibly the mass accretion rate. They find that these data, including a detected quasi-periodic oscillation, are inconclusive as to the nature of the compact object.
In the present paper we discuss all the X-ray data obtained with BeppoSAX and RXTE, and the position as determined with XMM-Newton. We start in Sect. 2 with an overview of all observations and the technical details of the analysis. This is necessarily a long overview because most observations are complicated due to source confusion. We continue with discussions of the 1-200 keV spectrum (Sect. 3), the 3-20 keV spectral variability (Sect. 4), the light curve (Sect. 5), the 3-20 keV rapid variability (Sect. 6), and the archival search for an optical counterpart (Sect. 7). In Sect. 8 we discuss the implications of the measurements for our understanding of this object. Finally, we summarize our conclusions in Sect. 9.
| Day in 2001† (UT) | Instrument‡ | ObsID |
|---|---|---|
| 36.557– 39.658 | WFC | OP10695,10696,10697 |
| 39.685– 42.000 | WFC | OP10703,10704 |
| 45.634– 47.518 | WFC | OP10733,10734 |
| 45.704– 45.713 | PCA (3) | 50138-01-01 |
| 47.68 – 48.57 | NFI | 21286001 |
| 47.729– 47.769 | PCA (3) | 50138-01-02 |
| 50.845– 50.884 | PCA (2) | 50138-01-03 |
| 56.836– 56.856 | PCA (4) | 50138-01-04 |
| 61.93 – 62.09 | XMM¶ | 0135520401 |
| 62.460– 62.497 | PCA (3) | 50138-01-05 |
| 68.836– 68.862 | PCA (3) | 50138-01-06 |
| 75.759– 76.637 | WFC | OP10898 |
| 77.247– 77.264 | PCA (4) | 60407-01-01 |
| 80.196– 80.876 | WFC | OP10927 |
| 86.007– 86.023 | PCA (2) | 60407-01-02 |
| 92.770– 92.798 | PCA (2) | 60407-01-03 |
| 93.482– 94.438 | WFC | OP11033 |
| 99.651– 99.719 | PCA (3 and 2) | 60407-01-04 |
| 107.673–107.712 | PCA (3) | 60407-01-05 |
| 112.797–113.586 | WFC∗ | OP11170 |
| 114.049–114.079 | PCA (3) | 60407-01-06 |
| 121.745–121.770 | PCA (2) | 60407-01-07 |
| 126.974–127.002 | PCA (2) | 60407-01-08 |
| 133.923–133.950 | PCA (2) | 60407-01-09 |
| 149.635–149.665 | PCA (3) | 60407-01-10 |
| 168.441–168.482 | PCA (2)∗ | 60407-01-11 |
| 184.759–184.773 | PCA (3)∗ | 60407-01-12 |
| 313.573–313.592 | PCA (2)∗ | 60407-01-13 |
† Jan 1, 2001, is MJD 51910.
‡ For the PCA, the number of active PCUs outside PCU0 is given between
parentheses (for day 99 this number changed within the observation).
¶ The spectral XMM-Newton data will be dealt with in a separate paper, the XMM-determined position is discussed in Sect. 7.
∗ SAX J1711.6-3808 was not detected in this observation.
2 Observations and data analysis issues
Table 1 presents a log of all X-ray observations carried out on SAX J1711.6-3808 between 2001 Feb 5 and 2001 Nov 9. Each of the four data sets has a unique diagnostic value: the BeppoSAX-WFC data provide coverage of the early parts of the outburst, the BeppoSAX-NFI data provide simultaneous wide spectral coverage, and the RXTE-PCA data provide coverage of the decay of the outburst combined with high time resolution analysis capabilities. We note that in addition to the data specified in Table 1, there are daily data after Jan 22 from the All-Sky Monitor (ASM) on RXTE.
2.1 BeppoSAX-WFC
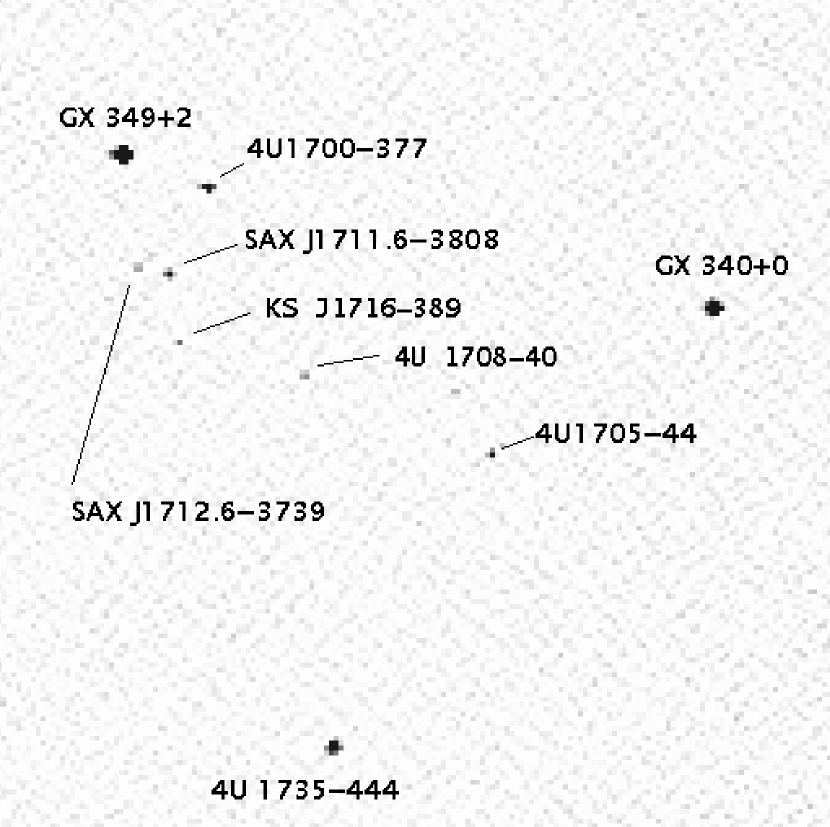
WFC unit 1 (Jager et al. 1997) on BeppoSAX (Boella et al. 1997a) observed the position of SAX J1711.6-3808 seven times, at various off-axis angles and, therefore, sensitivities in the 2-28 keV bandpass. The first observation started on Feb. 5 (day 36 of 2001) and the last ended on April 23 (day 113). All observations except the last yielded detections. The discovery was made from the second observation (In ’t Zand et al. 2001). The total exposure time was 320 ksec. The statistical quality of the WFC data is limited; the highest signal-to-noise ratio is 54 and applies to the third observation. In all other cases this ratio is at least a factor of 2 lower. This kind of quality only allows rough spectral constraints. Figure 1 shows the wide-field WFC image taken on day 75 of 2001. It shows another active source at only 33′ from SAX J1711.6-3808. This is SAX J1712.6-3739, a bursting low-mass X-ray binary transient that was discovered with the WFC in 1999 (In ’t Zand et al. 1999, Cocchi et al. 1999). On day 75 it had an average flux of 33 mCrab (2-28 keV), which is similar to the peak flux in 1999. During the other WFC observations of SAX J1711.6-3808 in 2001, SAX J1712.6-3739 was not detected with upper limits between 6 and 30 mCrab. However, archival WFC data show SAX J1712.6-3739 sometimes slightly popping up above the WFC detection threshold (Cocchi et al, in prep.).


2.2 RXTE-ASM
ASM archival data was processed to generate a light curve of SAX J1711.6-3808 since the start of mission operations in January 1996, see Fig. 2. Only one clear outburst was detected from SAX J1711.6-3808, in 2001. During the outburst, up to 33 ASM dwells of 90 sec each were carried out per day, with a total number of dwells of 1194 and a total exposure time of 107 ksec. The typical sensitivity in one dwell on a non source-confused region is 0.03 Crab units. The number of sources solved for per dwell is between 7 and 37. Fig. 3 shows the ASM light curve of SAX J1712.6-3739. The highest point here corresponds to the August 1999 outburst when the source was discovered with WFC (In ’t Zand et al. 1999). Further activity is visible in 1996 and, particularly, in 2001.
2.3 BeppoSAX-NFI
SAX J1711.6-3808 was observed with the Narrow-Field Instruments (NFI) on BeppoSAX between 2001 Feb 16.68 and 17.57 UT (day 47.68-48.57 of 2001). The NFI consist of two imaging devices that operate at photon energies below 10 keV: the Low-Energy (LECS; 0.1-10 keV bandpass; Parmar et al. 1997) and Medium-Energy Concentrator Spectrometer (MECS; 1.6-10 keV; Boella et al. 1997b). Two other – non-imaging – devices operate roughly above 10 keV: the High-Pressure Gas Scintillation Proportional Counter (HP-GSPC; 7-34 keV; Manzo et al. 1997) and the Phoswich Detector System (PDS; 15-220 keV; Frontera et al. 1997). The circular fields of view of the LECS, MECS and HP-GSPC are 40′, 30′ and 10 in diameter, respectively. The PDS has a hexagonal field of view with a diameter ranging between 13 and 15. The energy resolutions at 6 keV are 8% for the MECS (full width at half maximum FWHM) and 11% for the HP-GSPC. The net exposure times are 9.5 (LECS), 36 (MECS), 36 (HP-GSPC) and 18 ksec (PDS). The analysis of the data sets was carried out in a standard manner: accumulation radii of 8′ and 4′ were applied for the LECS and MECS images, the normalizations of the LECS and PDS data sets with respect to the MECS data were left as free parameters (while it was checked that these numbers are within acceptable limits), and spectral bins were combined up to the point where each bin contains at least 20 photons so that the statistic applies.
The PDS consists of two pairs of detectors that each have an independent collimator which rocks on and off the source at 192 s intervals. The off source positions are 35 on opposite sides from the source. For the observation on SAX J1711.6-3808, these two positions are not on blank sky: 2S 1711-339 is 53′ off-axis in one off-source pointing, while 4U 1708-40 is 50′ in the other. On top of that, SAX J1712.6-3739 contaminates the signal in the on-source pointing. All three contaminating sources have been observed on-axis with the PDS before and the relevant data are publicly available from the BeppoSAX archive111http://www.asdc.asi.it/bepposax/archive_browser.html. 2S 1711-339 is a transient X-ray source which has a fairly high X-ray flux during ’quiescence’. It was observed during quiescence on 2000 Feb 29 (e.g., Cornelisse et al. 2002), with a 2-6 keV flux of 2.4 10-11 erg cm-2s-1, but the source was not detected above a 3 upper limit of 0.12 c s-1 in the 15-100 keV band. At other times during quiescence, the source was seen at 2-6 keV flux levels between 0.3 and 5 10-11 erg cm-2s-1 (Cornelisse et al. 2002), so one would expect a maximum PDS count rate of approximately 0.24 c s-1. 4U 1708-40 is a persistent X-ray source with a mean 2-12 keV flux of about 10-9 erg cm-2s-1, according to publicly available measurements with the ASM on RXTE. A PDS observation on August 15, 1999, did not reveal a detection above a 3 upper limit of 0.12 c s-1. Judging from the ASM data, the flux is not expected to vary by more than a factor of about 2, so also for this source we set the upper limit to 0.24 c s-1. Taking into account these upper limits and the collimator responses, we estimate that the two sources in the off-source pointings introduce systematic flux uncertainties of less than one percent in the flux of SAX J1711.6-3808 (whose intensity is 21 c s-1). We verified this by comparing the PDS spectra of both off-source pointings, for both pairs of detectors. They fall on top of each other, and the flux does not differ by more than 1%.
SAX J1712.6-3739 was observed with the PDS on August 27, 1999 (Cocchi et al., in prep.) when it had a 2-10 keV flux of 1.1 10-10 erg cm-2s-1 and a photon count rate in the PDS of 0.76 c s-1 (15-100 keV). During the NFI observation on Feb 16-17, the ASM dwelled on SAX J1712.6-3739 18 times. The combined ASM data do not show a detection above a upper limit of approximately 3.3 10-10 erg cm-2s-1 (2-10 keV). During the 2 days prior to the NFI observation of SAX J1711.6-3808, WFC observations show that the 2-10 keV flux of SAX J1712.6-3739 was at most equal to that during the 1999 NFI observation. Scaling the 1999 PDS flux to this upper limit, we conclude that the contribution of SAX J1712.6-3739 to the PDS flux of SAX J1711.6-3808 amounts to 11% at maximum (2.3 c s-1), but more likely less than 3.5% (as inferred from the WFC observations 2 days earlier). In the HP-GSPC data, the contribution is expected to be even less. We note that it is not possible to employ the PDS data in the same way as the PCA slew data (see Sect. 2.4) because the on/off slews are too fast, lasting less than 3 sec.
2.4 RXTE-PCA

RXTE observed SAX J1711.6-3808 19 times. The first 6 observations, amounting to 14.8 ksec exposure time, were carried out under an accepted AO5 TOO program (PI J. Swank), and the remainder (30.9 ksec exposure) as public TOO observations. Wijnands & Miller (2002) already reported about the first 8 public TOO observations. We here report on all PCA measurements. The PCA instrument (for a detailed description, see Jahoda et al. 1996) consists of an array of 5 co-aligned Proportional Counter Units (PCUs) that are sensitive to photons of energy 2 to 60 keV with a total collecting area of 6500 cm2. The spectral resolution is 18% FWHM at 6 keV and the field of view is nearly hexagonal with a size of 1o FWHM. During the observations the number of active PCUs varied between 1 and 5. While the first 17 observations have the same pointing (equal to the WFC-determined position of SAX J1711.6-3808), the last two observations consisted of additional pointings that are more than 1° from SAX J1712.6-3739, to determine the flux of SAX J1711.6-3808 without ambiguity at the cost of some sensitivity. During analyses, we refrain from using PCU0, because this unit is missing its top propane layer and hence has higher background and a different spectral response. Furthermore, we only include PCU2 and 3, because of calibration differences with PCU1 and 4.
SAX J1712.6-3739 is potentially an important source of contamination in the PCA data. At an angle of 33′ to the pointing axis, the collimator response to SAX J1712.6-3739 is 44% with the exception of the last two observations. To determine the contamination by SAX J1712.6-3739 with far better accuracy than provided by the ASM data, we investigated data taken at times when the PCA is slewing to or from SAX J1711.6-3808, immediately before and after each observation. The profile of the photon count rate during these slews can be decomposed into the contributions from both sources if the slew direction has a sufficiently large component along the line connecting both sources, and if both sources are steady enough during the slews to not disturb the slew profiles in the rates. It turns out that half of all PCA observations have useful slew data. In Fig. 4 we present the count rates for both sources as determined from these slews. It is clear that SAX J1712.6-3739 has a significant contribution which can never be neglected: in no case is the photon rate smaller than 0.4 times that of SAX J1711.6-3808. In the final three observations it is even the sole source of photons.
We note that the second WFC observation overlaps the first PCA observation. SAX J1712.6-3739 was not detected with the WFCs and the upper limit is relatively sensitive at 6 mCrab which translates to roughly 13 c s-1PCU-1 on axis or 6 c s-1PCU-1 at 33′ off axis.
Additionally, there is contamination from the Galactic ridge. We determined the local ridge emission from a 1 ksec exposure in the one but last observation which was offset from SAX J1712.6-3739 so that no emission from SAX J1712.6-3739 nor SAX J1711.6-3808 was detected. The pointing is at 34769, +084. This position is offset by 073 in Galactic longitude from the other pointings on SAX J1711.6-3808, but only 005 in latitude (the spatial profile of the ridge is particularly dependent on latitude). The photon count rate derived for the local ridge emission is 2.8 c s-1PCU-1 (top layer, 3-20 keV; compare with the source photon rates in Fig. 4). The ridge emission also includes a narrow Fe-K emission line with flux 2.1 phot s-1cm-2.
2.5 XMM-Newton
A public TOO was carried out with XMM-Newton from March 2.93 to 3.09 U.T. On this platform, measurements are done through 3 identical telescopes (e.g., Jansen et al. 2001). For 2 of these, 50% of the X-radiation is diverted to reflection gratings. The other 50% of the two telescopes are collected by the EPIC-MOS1 and MOS2 CCD arrays (Turner et al. 2001) while 100% of the third telescope is collected by the EPIC-pn CCD array (Strüder et al. 2001). The 3 EPIC cameras enable imaging measurements at 6″ resolution in a 30′-diameter field of view. The energy resolution intrinsic to all CCDs is =20 to 50 in a 0.1 to 15 keV bandpass. The exposure times per device are 12 ksec for EPIC-MOS1 and MOS2, and 10 ksec for EPIC-pn CCD. All cameras were operated in ’full window’ data acquisition mode. A treatment of the spectral XMM-Newton CCD data, which is heavily piled up, and the (heavily absorbed) RGS data is deferred to a later paper. We will here only address the source position resulting from these data.
3 Broad band spectrum
| Model† | ||
|---|---|---|
| wa(diskbb+pexrav) | 3.703 | 116 |
| wa(diskbb+comptt) | 3.609 | 116 |
| wa(diskbb+pohighecut) | 3.453 | 116 |
| wa(pexriv) | 2.538 | 117 |
| wa(diskbb+pohighecut+bbody) | 2.012 | 114 |
| wa(diskbb+pexrav+gauss) | 1.968 | 113 |
| wa(diskbb+pexrav+laor) | 1.788 | 112 |
| wa(diskbb+pexriv+gauss) | 1.737 | 112 |
| wa(diskbb+pexriv+laor) | 1.664 | 111 |
| wa(bbody+comptt+laor) | 1.473 | 113 |
| wa(bbody+comptt+gauss) | 1.458 | 113 |
| wa(diskbb+comptt+gauss) | 1.432 | 113 |
| wa(diskbb+comptt+laor) | 1.424 | 113 |
| wa(diskbb+pohighecut+laor) | 1.386 | 112 |
| wa(diskbb+pohighecut+gauss) | 1.348 | 113 |
| wa(diskbb+pohighecut+gauss)edge | 1.308 | 111 |
| wa(diskbb+comptt+gauss)edge | 1.308 | 111 |
†wa = interstellar absorption following Morrison & McCammon (1983), comptt = Comptonized spectrum, gauss = Gauss function, edge = 1 for and 1-exp() for , po = power law, highecut = 1 for and exp() for , bbody = single-temperature black body radiation, diskbb = disk black body (Mitsuda et al. 1984); pexriv = Compton reflection against an ionized medium (Magdziarz & Zdziarski 1995); pexrav = Compton reflection off a neutral medium (Magdziarz & Zdziarski 1995).
The flux was fairly stable during the NFI observation; on a time scale of an hour the variability of the source did not exceed the 5% level. The shape of the 1 to 200 keV spectrum can be characterized by an absorbed power law, with a photon index of 1.7, which is moderately cut off above 60 keV by an exponential with an e-folding energy of 130 keV. There is no strong soft component which is typical of many bright X-ray transients. We tested the spectrum against various continuum models that are applicable to X-ray binaries, for instance a (cut-off) power law, a Comptonized spectrum, bremsstrahlung radiation, and disk black-body radiation. Data were restricted to 1-4 keV for LECS, 1.6-10.5 keV for MECS, 7-34 keV for HP-GSPC, and 15-200 keV for PDS. None of the continuum models adequately describe the data (see cases in Table 2 for which exceeds 2). The primary reason for this is a narrow-band spectral component between 4 and 9 keV which is not represented in these models. In Fig. 5, we present the residuals with respect to the best-fit model when excluding the 4-9 keV range from the fitting. A narrow-band emission feature is apparent, with a peak that is near the energy expected for the Fe-K line complex. The feature is seen in its entirety with the MECS, and is partly confirmed by HP-GSPC data. To accommodate the emission feature, we tested two models in combination with a variety of continuum models. The emission-feature models include a broad Gaussian line, optionally supplemented by an absorption edge, and an emission line that is relativistically broadened by Doppler shifts due to orbital motion of the emitting material around a compact object and to gravitational redshift. For the latter, the model as formulated by Laor (1991) for a rotating compact object was employed. In this model, we fixed the outer radius at 400 and the power-law index of the emissivity-radius dependence at –3. None of the fixed parameters are in fact constrained by the data. The continuum models consist of a disk black body (according to Mitsuda et al. 1984) plus either a (high-energy cut off) power law plus, a Comptonized thermal spectrum (Titarchuk 1994, Titarchuk & Lyubarskij 1995, Hua & Titarchuk 1995) or a power-law model reflected off cold or ionized material (following Magdziarz & Zdziarski 1995). The results for the goodness of fit are presented in Table 2. Formally, the values for are not acceptable. For the best fit, the chance probability is as small as about 1%. We attribute this to calibration uncertainties. With the introduction of a reasonable systematic flux uncertainty of 1% per channel, decreases to 1.0. In Table 3, we present the parameter values for four of the best-fit models. We chose to not consider absorption edges because the evidence for their existence is not convincing. Also we chose the disk black body model for the soft excess because single-temperature black body radiation does not fit PCA data (see Sect. 4). Although one of the four is the best fit, the other 3 are consistent at the 1 sigma level. We conclude that 1) the fitted line width is very broad, much larger than the spectral resolution of the MECS (33% versus 8% FWHM); 2) the emission line is consistent with being symmetric with a shape that can either be modeled with a broadened Gauss function or a relativistically broadened emission line with a fairly high inclination angle; 3) the absorption edge is not mandated by the data; 4) reflection models are inconsistent with the data (they particularly have a problem with explaining the high-energy cutoff); 5) both non-reflected continuum models give nearly equally as good a description of the data and 6) the data does not discriminate between single-temperature or multi-temperature black body models.
| Model | wa(pohighecut+diskbb+gauss) |
|---|---|
| cm-2 | |
| disk bb | keV |
| photon index | |
| keV | |
| keV | |
| Gauss | 6.33 keV |
| Gauss line width | 2.79 keV (FWHM) |
| Gauss line flux | phot s-1cm-2 |
| 0.999 (113 dof) | |
| Model | wa(pohighecut+diskbb+laor) |
| cm-2 | |
| disk bb | keV |
| photon index | |
| keV | |
| keV | |
| Laor | 6.34 keV |
| Laor | |
| Laor line flux | phot s-1cm-2 |
| Laor inclination | 863 |
| 0.992 (113 dof) | |
| Model | wa(diskbb+comptt+gauss) |
| cm-2 | |
| disk bb | keV |
| seed photons | keV |
| plasma | keV |
| optical depth | (disk) |
| (sphere geometry) | |
| Gauss | keV |
| Gauss line width | keV (FWHM) |
| Gauss line flux | phot s-1cm-2 |
| 1.102 (111 dof) | |
| Model | wa(diskbb+comptt+laor) |
| cm-2 | |
| disk bb | keV |
| seed photons | keV |
| plasma | keV |
| optical depth | (disk) |
| (sphere geometry) | |
| Laor | keV |
| Laor | |
| Laor line flux | phot s-1cm-2 |
| Laor inclination | 865 |
| 1.101 (113 dof) |
†

The disk black body accounts for 9% of the 1-10 keV unabsorbed flux or 3% in the 1-200 keV band. The absorbed flux in 3 to 20 keV is 1.53 erg cm-2s-1; the unabsorbed flux in the 1 to 200 keV band is 5.0 10-9 erg cm-2s-1. The equivalent width of the broad emission feature is between 0.35 and 0.50 keV, depending on the model.


4 Spectral variability
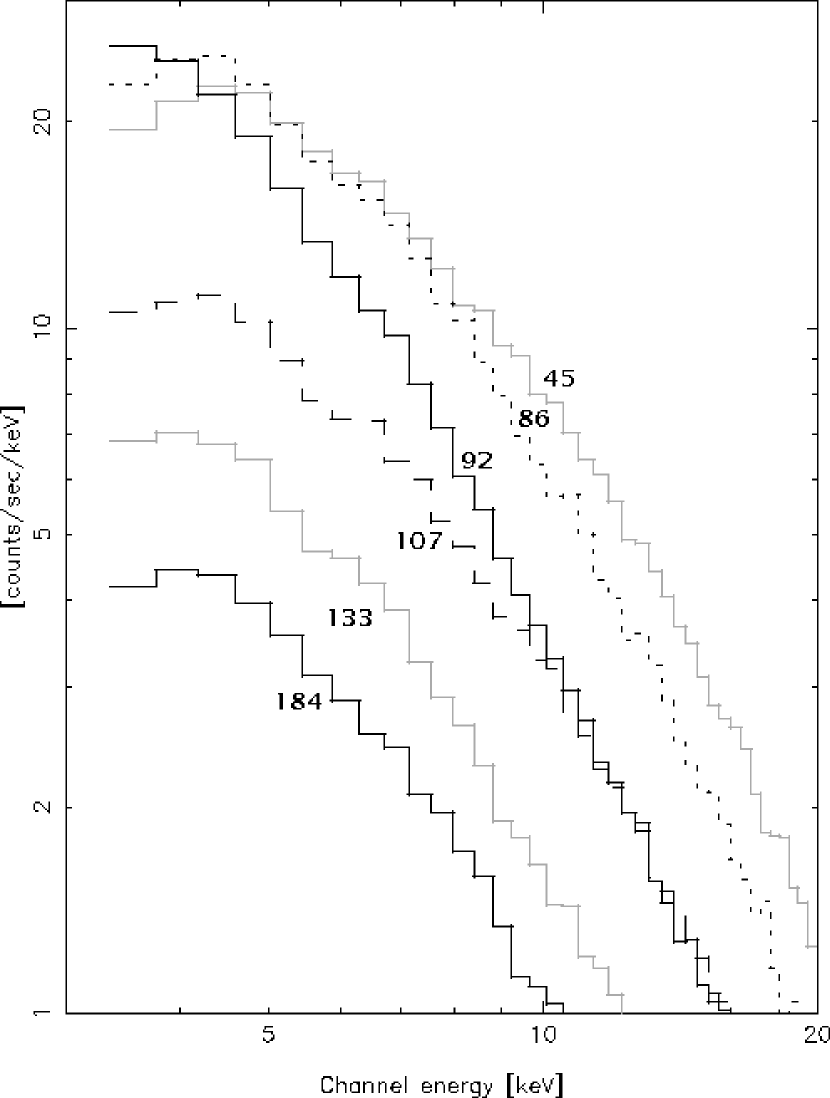
Fig. 6 shows 6 RXTE-PCA spectra between 3 and 20 keV for only PCU2 that illustrate the spectral changes over the course of the outburst. As already pointed out, there is considerable contamination by SAX J1712.6-3739. Only spectral features that can be attributed to SAX J1711.6-3808 with certainty are useful for the present discussion.This implies that it is not prudent to discuss the broad-band continuum from these data and we refrain from doing so. There are two attributable spectral features. The first is a temporary soft excess that is strongest in the PCA observations of days 92 and 99. This is about the time that the decay of the outburst sets in. The association of this feature with SAX J1711.6-3808 could be confirmed from an independent imaging measurement with the WFC on days 93-94, see Fig. 7. This spectrum shows the same soft excess, while the other 5 WFC spectra do not. The PCA-measured excess may be modeled by a disk black body (Mitsuda et al. 1984), with a temperature at the inner edge of the accretion disk of keV and keV for days 92 and 99, and inner radii of and km, respectively. A single-temperature black body is ruled out: for the observation on day 99 a disk black body yields a best-fit with while a single-temperature black body yields (101 dof). For all other PCA spectra, any black body component is much fainter and of relatively low significance. The soft excess in the one relevant WFC spectrum has a disk black-body temperature of keV.
The other spectral feature that can be attributed to SAX J1711.6-3808 is the broad emission feature at 7 keV. None of the four spectra available for SAX J1712.6-3739 show such a feature. These four spectra were obtained with the PCA on August 26, 1999, with the NFI on August 27, 1999, and with the PCA on June 17 and July 3, 2001. The last two observations were aimed at SAX J1711.6-3808, but that source was off at that time (see Fig. 4). In Fig. 8 we show the residuals of the NFI spectrum with respect to a Comptonized spectrum. The upper limit to the flux of a broad line at 6.5 keV in this spectrum is 5.2 10-4 phot s-1cm-2.
We modeled the continuum of SAX J1711.6-3808 with an absorbed power law, with fixed cm-2 and free power law index, plus a disk black body and included a fixed model for the Galactic ridge. In each spectrum, the Gaussian emission line energy and flux were left free. The width was fixed at 2.6 keV, in accordance with the NFI spectrum. All fits are acceptable, but we note that due to the contamination the disk black body very probably has a contribution from SAX J1712.6-3739, as exemplified by the measurement on day 47 which is inconsistent with that determined from the simultaneous and uncontaminated NFI measurement. Fig. 9 shows the emission feature in the PCA data for the observation with the highest soft excess. It is clearly present. In Fig. 10 we plot the line energy and flux as a function of time for all sixteen PCA observations during which SAX J1711.6-3808 was active, as well as the disk black body parameters. The weighted mean of the line energy is keV. The data are consistent with it being constant: a fit with a constant yields (). The line flux decays but not exactly in tandem with the continuum flux. The equivalent width is higher on days 85, 92 and 99, with a maximum of 0.8 keV on day 92. This increase coincides with the appearance of the soft excess which is modeled through the disk black body component.
5 Flux history

From all X-ray observations except 8 PCA observations without useful slew data, we generated a time profile of the unabsorbed 3-20 keV flux as shown in Fig. 11. We included the first PCA observation, despite the absence of useful slew data, because a simultaneous WFC observation shows SAX J1712.6-3739 to be at least 10 times as faint as SAX J1711.6-3808 (see Sect. 2.4; this data point is not shown in Fig. 4). At the time of discovery, the flux appears to be on the rise to its peak of erg cm-2s-1. However, this is difficult to assess with certainty because the onset of the outburst was missed. Data obtained with the ASM on RXTE are incomplete at the time of the onset of the outburst: there is a gap in the coverage between November 20, 2000, and January 22, 2001 (see Fig. 2). After January 22, the data show detections with fluxes that are of similar magnitude as seen with the PCA, and before November 22 there are only non-detections below a sensitivity limit of roughly erg cm-2s-1 on a weekly time scale. After reaching the peak flux at about the time of the NFI observation, the source hovered at about the same flux level for one month, Subsequently, it steadily declined by about a factor of 5 in two months. Such a decay rate is typical for bright X-ray novae (e.g., Chen et al. 1997). When investigated in higher time resolution, none of the 412 ksec worth of data show bursting activity which would have diagnosed the compact object as a neutron star. Also, none of the ASM data shows signs of bursting activity, but it should be noted that the time resolution of 90 sec diminishes the sensitivity considerably towards typical bursts with an e-folding decay time of 10 sec.
We note that the unabsorbed 3-20 keV fluxes that we find are between 25 to 48% lower than those obtained by Wijnands & Miller (2002), due to the correction for the contribution by SAX J1712.6-3739.
The 3-20 keV band is not a good tracer of the bolometric flux. As spectral analyses showed, a substantial part of the bolometric flux is contained below 3 keV and above 20 keV. For instance, during the NFI observation, 13% of the unabsorbed 0.1 to 200 keV flux is contained within 0.1-3 keV and 53% within 20-200 keV. These percentages vary considerably: during the PCA observation of day 92 of 2001, 74% of the 0.1-200 keV flux is estimated to be within 0.1-3 keV. This is due to the temporary appearance of a strong soft excess. We estimated how the time profile of the bolometric flux might look like by extrapolating the spectral fits that were done between 3 and 20 keV. We estimate that the 1 to 20 keV flux is rather constant between days 45 and 70 at a level of about erg cm-2s-1. Thereafter, it starts to decline, but revives after 10 days to an absolute peak of 4 10-9 erg cm-2s-1 whereafter the decline resumes. This 1-20 keV peak luminosity happens to be close to the 1-200 keV luminosity during the NFI measurement (5 10-9 erg cm-2s-1), when there was no strong soft excess present.
6 Rapid variability of the continuum
| Date | Obs | Total | QPO1 | QPO1 | QPO2 | QPO2 | |
|---|---|---|---|---|---|---|---|
| (day | Id. No. | rms | freq. | rms amp. | freq. | rms amp. | |
| in 2001) | (Hz) | (Hz) | (Hz) | ||||
| 45.7 | 50138-05-01 | 25% | — | — | — | — | 0.81 |
| 47.7 | 50138-05-02 | 24% | — | — | 0.81 | 5.3% | 0.83 |
| 50.8 | 50138-05-03 | 23% | 0.49 | 3.1% | 1.0 | 11.2% | 0.41 |
| 56.8 | 50138-05-04 | 23% | — | — | 0.98 | 4.8% | 0.95 |
| 62.5 | 50138-05-05 | 22% | — | — | 1.2 | 9.9% | 0.50 |
| 68.8 | 50138-05-06 | 18% | 1.1 | 4.1% | 2.0 | 6.8% | 0.66 |
| 77.2 | 60407-01-01 | 19% | 1.1 | 4.0% | 2.1 | 7.6% | 0.72 |
| 86.0 | 60407-01-02 | 19% | — | — | 2.2 | 3.1% | 1.3 |
| 92.8 | 60407-01-03 | 13% | — | — | 6.9 | 3.4% | 2.9 |
| 99.7 | 60407-01-04 | 12% | — | — | 7.3 | 1.4% | 5.1 |
We searched the RXTE PCA observations for both coherent pulsations and
other incoherent rapid variability such as quasiperiodic oscillations
(QPOs). The PCA data are taken in several different modes. For fast
timing analysis, data in the “E_125us_64M_0_1s” mode were
used. This mode provides individual X-ray tagged events with 125
s time precision and 64 bins of energy information.
Pulsations were searched for using the Fourier Transform technique. The PCA events were selected to be in the 2–60 keV range, and extracted into light curve segments of 1024 s duration, sampled at a frequency of 2048 Hz (i.e., Nyquist frequency of 1024 Hz). Fast Fourier transforms of each light curve were computed and the resulting power spectra were averaged. We searched for pulsations only from days 45–100 of year 2001, where SAX J1711.6–3808 was known to be relatively active, resulting in an exposure time of 20.9 ksec. This selection includes XTE observation IDs 50138-05-01-00 through -06-00 and 60407-01-01-00 through -04-00. Above a frequency of 10 Hz, the strongest Leahy-normalized (Leahy et al. 1983) Fourier power is 5.06 at a frequency of 88.53418 Hz. However, the 99% detection limit for trials is a power of 5.48, so no pulsations were detected at 99% confidence. The maximum power measured yields a 95% upper limit to pulsations of 1.5% fractional (r.m.s.) in the 2–60 keV band.
We also searched for broader high frequency QPOs. Oscillations in the range 300–1300 Hz have been detected from a multitude of neutron star low mass X-ray binaries, and can be as narrow in frequency as a few Hertz, or as broad as 100 Hz. Power spectra in the same energy band were rebinned in frequency and examined for excess power. We found no significant oscillations. The 95% upper limit to the fractional r.m.s. variations is 1.4% for QPOs with a full width half-max (FWHM) of 10 Hz, and 1.5% for a FWHM of 100 Hz.
Strohmayer (2001a & 2001b) has recently shown that in the black hole candidates GRS 1915+105 and GRO J1655–40, significant QPOs are present only in the X-ray band above 13 keV. We thus also divided the X-ray events into two bands, 2–8 keV and 8–60 keV, to search for energy dependent phenomena. No QPOs were detected in the soft and hard bands, with 95% upper limits of 2.1% and 2.3% fractional r.m.s. respectively, for a hypothetical QPO with FHWM of 50 Hz.
Below frequencies of 10 Hz the power spectrum is dominated by incoherent red noise (Figure 12; see also Wijnands & Miller 2002). Generally speaking the power spectrum in the 1 mHz – 128 Hz band has a flat top with power law roll-off () above about 1 Hz. However, the shape of the spectrum does not perfectly obey this prescription. First of all there are noticeable QPOs and harmonics present, especially in the observations that precede day 100. Also, the power law decline above the cut-off is not a perfect power law but often has a smooth shelf, which is mildly visible in Figure 12.
Because SAX J1712.6–3739 is also present in the field of view, it potentially contaminates the power spectrum of SAX J1711.6–3808. We have examined the power spectrum of SAX J1712.6–3739 both in the last few observations of this observing program where SAX J1711.6–3808 was known to be quiescent, and in observations from August 1999 (Observation IDs 40428-01-01-00 and -01). In those observations SAX J1712.6–3739 generally appeared to have weak variability, on the order of 8% total fractional r.m.s. fluctuations over the entire 0.001–128 Hz band. The average power spectrum of SAX J1712.6–3739 from the 1999 PCA observations is shown in the bottom portion of Figure 12. It can be seen that the variability of SAX J1712.6–3739 is weak compared to the 20%–25% variability of SAX J1711.6–3808 during the peak of its outburst, but SAX J1712.6–3739 may indeed contribute to the “shelf” seen around 10 Hz.
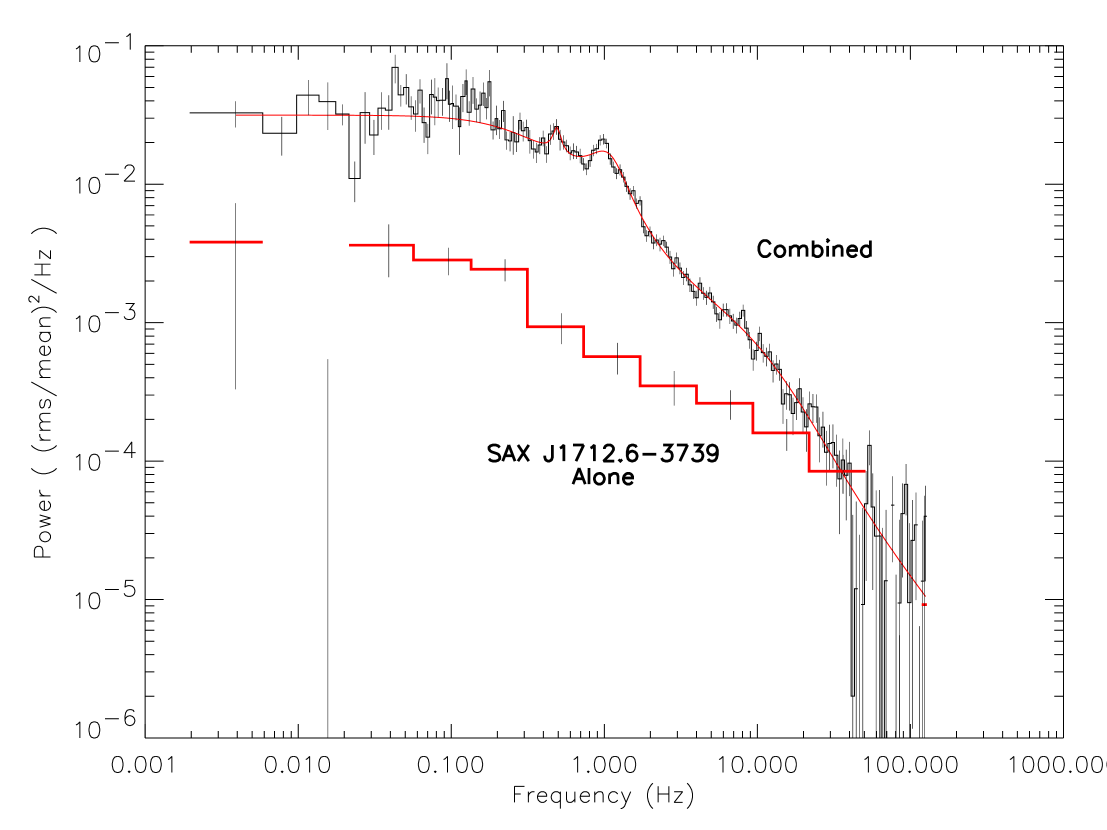
In principle the power spectrum should be dominated by the variability of SAX J1711.6–3808. Unfortunately, the flux of SAX J1712.6–3739 in the time range of interest is a factor of 2 greater than has been seen before by the PCA. Thus, we have no direct experience regarding the variability of SAX J1712.6–3739 as it existed during the peak of the outburst of SAX J1711.6–3808. As such we will avoid presenting detailed results on the noise continuum and focus on the low frequency QPO features. The continuum model employed consisted of two additive continuum components of the form where is the normalization and is the asymptotic power law index above the break frequency , plus a constant to represent the Poisson noise level. The two additive components were used in order to capture both the main break in the power spectrum and the “shelf.”
The QPOs are seen between 0.5 and 2.5 Hz, near the break in the noise continuum. When two QPOs are formally detected, they appear to have a 1:2 harmonic relationship, dominated primarily by the 2nd harmonic. Even when the first harmonic is not detected (owing in part to imperfections in the continuum model) there appears subjectively to be some excess noise at the first harmonic position. The centroid frequencies and amplitudes of the first and second harmonics are presented in Table 4 as QPO1 and QPO2 respectively. The “Total rms” column refers to the total fractional r.m.s. variability in the observation in the 0.001–128 Hz frequency band. Where a non-detection is listed in Table 4, we refrain from placing upper limits given the above discussions. The FWHM of the lower frequency QPO ranged from 0.06 to 0.36 Hz, while that for the upper peak ranged from 0.08 to 0.95 Hz. The total variability declined as the X-ray flux of SAX J1711.6–3808 declined, and during that time the frequencies of the QPOs were seen to increase slightly.
The “break” frequency of the continuum level is also indicated in Table 4. The tabulated value is , the frequency at which the continuum reaches half its maximum value, for the larger of the two continuum components. This quantity is comparable to the half-width at half-maximum value often quoted when authors fit a zero-centered Lorentzian to the low frequency continuum component of a power spectrum.
The nearby source SAX J1712.6–3739 contributes an appreciable fraction of the total flux observed by the PCA. For PCA observations pointed directly at SAX J1711.6–3808 the collimator response to SAX J1712.6–3739 is approximately 44%. For times before day 100 where it was possible to estimate the fluxes of both sources independently using the on- or off-source PCA slews, SAX J1712.6–3739 contributed between 27% and 46% of the total detected flux, with an average of 37%. Thus, if one were to consider the QPOs to come from SAX J1711.6–3808 alone, the fractional r.m.s. upper limits and values quoted above and in Table 4 are slight underestimates and should be revised upward by approximately 25%.
Wijnands & Miller (2002) also presented power spectral parameters of SAX J1711.6–3808 derived from PCA observations in the 60407 series. Where QPOs are detected both in Table 4 and in Wijnands & Miller (2002), there is a reasonably good agreement between in the two values. The values for the break in the continuum differ by a factor of 2.2, which is not unreasonable because the continuum models were quite different: Wijnands & Miller (2002) use a broken power law. However, we urge extreme caution in interpreting the later observations from the PCA, which are the most likely to be contaminated by SAX J1712.6–3739. For example, observations on days 92.8 and 99.7 have r.m.s. variabilities of 13% and 12% respectively. These are quite close to the 8% variability seen from SAX J1712.6–3739 alone. We also see a general positive trend between the QPO frequency and the break frequency.
7 Limits on the optical counterpart
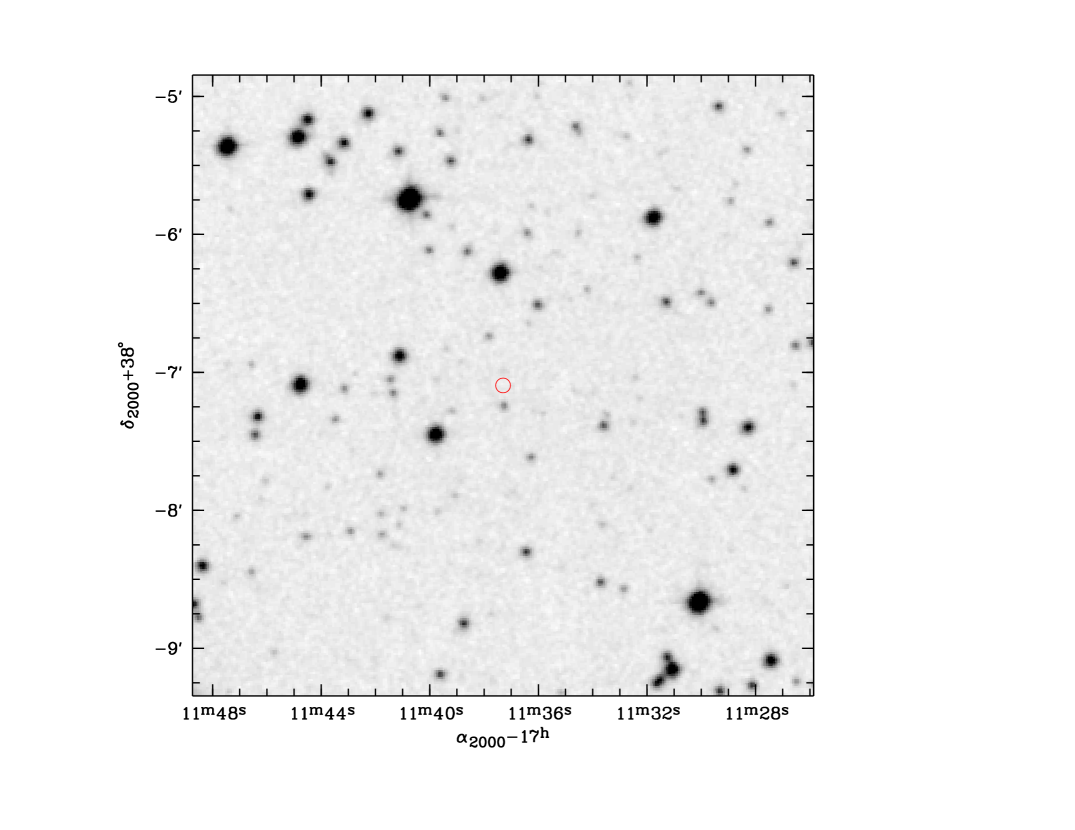
The XMM-Newton EPIC data yield the most accurate position for SAX J1711.6-3808: , with an error radius of 32 (90% confidence). This is 14 from the WFC-determined position (In ’t Zand et al. 2001). In Fig. 13 the XMM-Newton error circle is plotted on an image in from the Digitized Sky Survey (DSS, 2nd generation). No candidate optical counterpart is visible. The limiting magnitude of this image is .
For cm-2, Predehl & Schmitt (1995) predict 15.9 magnitudes of visual extinction. The extinction in the band is expected to be 11.9 magnitudes (employing ). This brings down the effective limiting magnitude to a moderate , or for a canonical 8.5 kpc distance. Thus, the lack of an optical counterpart in the DSS image is not very constraining. A B0(V)-type star with (e.g., Drilling & Landolt 2000) would have been detected if it were closer than 6.5 kpc. If such a star would have evolved off the main sequence into a giant, the limiting distance would be 20 kpc. For later stellar types the limiting distances are smaller, being roughly 1 kpc for a B8(V) star. We conclude that it is slightly more likely that the companion star is a late type star. To find an optical counterpart, it is most opportune to search in the infrared, for instance in the band. The extinction in this band is only 1.8 mag (employing following Rieke & Lebofsky 1985). A K0 star, typical for a quiescent low-mass X-ray binary (e.g., van Paradijs & McClintock 1995), would have (for , following Bessell & Brett 1988). At a distance of 8.5 kpc this would imply . We note that another argument in favor of a low-mass X-ray binary (LMXB) hypothesis is that most transients in this field are LMXBs (e.g., In ’t Zand 2001).
8 Discussion
The uncertain distance makes it difficult to assess the peak luminosity accurately, but the low galactic latitude places SAX J1711.6-3808 in the galactic disk and diminishes the likelihood of large distances through association with the Galactic halo. For a canonical distance of 8.5 kpc the 1-200 keV unabsorbed luminosity would be erg s-1. For masses in excess of 1.4 M⊙ the implied luminosity is below 25% of the Eddington limit. The source would have to be at a distance at least twice that to the Galactic center for the peak luminosity to be near Eddington. Despite the lack of coverage of the onset, the available data suggest that the true peak flux of the outburst was not much higher than observed because the source flux remained on a plateau for a month after the discovery before it started to decay.
Wijnands & Miller (2002) announce a decoupling between the 3 to 20 keV luminosity and the state transitions in the sense that the soft component appears at intermediate luminosities instead of at the peak as would be expected. They consider it unlikely that this may be explained by the evolution of the flux above 20 keV and conclude that the decoupling is a significant physical effect. However, the picture becomes different when the flux below 3 keV is also taken into account. Our analysis shows (Fig. 11) that there is an important bolometric correction from below 3 keV. In fact, the soft excess contains so much flux that its appearance marks the peak flux for the whole outburst in the 1–20 keV band. While keeping in mind that a substantial fraction of the bolometric flux may be outside the 1-20 keV band, as evidenced by the NFI data, the conclusion is justified that there is no hard evidence for a decoupling of the bolometric flux and state transitions.
The 6 keV emission feature in SAX J1711.6-3808 is characterized by 1) a centroid energy of 6.3-6.7 keV; 2) a FWHM of about 2.6 keV and an equivalent width of 0.3 to 0.8 keV; 3) little evidence for asymmetries or structure; 4) no evidence for line shape variability during the outburst when the line flux declines by one order of magnitude; and 5) temporary factor-of-2 to 3 increase in the equivalent width simultaneous with a strong increase of a disk black body component at substantially lower energies.
The broadness is exceptional though not unprecedented among neutron star low-mass X-ray binaries. Asai et al. (2000) recently analyzed Fe-K line emission properties of 20 such LMXBs as measured with ASCA with relatively high energy resolution (2% at 6 keV for SIS and 8% for GIS), and found such lines in half of all cases. The FWHM in those detections ranges up to 0.7 keV. This is a confirmation of earlier EXOSAT work compiled by Gottwald et al. (1995) who find widths of up to keV. Recently, two cases were reported of Fe-K emission lines in neutron star systems with FWHM in excess of 1 keV: Ser X-1 with a FWHM of keV (Oosterbroek et al. 2001), and GX 354-0, with a width of keV (Narita et al. 2001).
While unusual for NS systems, the line width has relatively more precedents among BH systems. There are at least 7 cases: the transient micro-quasar XTE J1748-288 (Miller et al. 2001), the transients GX 339-4 (Feng et al. 2001), XTE J1550-564 (Sobczak et al. 2000), GRO J1655-40 (Tomsick et al. 1999), 4U 1543-47 (van der Woerd et al. 1989) and XTE J2012+381 (Campana et al. 2002), and the persistently bright Cyg X-1 (Barr et al. 1985; Fabian et al. 1989; Miller et al. 2002). A recent BeppoSAX observation of Cyg X-1 (Frontera et al. 2001) in its low/hard state shows a Gaussian profile centered on 6.2 keV with a FWHM of 2.9 keV and an equivalent width of 0.35 keV. These values are similar to those for SAX J1711.6-3808. The width and prominence of the line in Cyg X-1 are less when the source is in the soft state.
A black hole nature of SAX J1711.6-3808 would also be consistent with the lack of coherent oscillations in the PCA data and the lack of type-I X-ray bursts in all X-ray data. The total exposure time on the active SAX J1711.6-3808 is about 412 ksec. For the exhibited range of luminosities (assuming a canonical distance of 8.5 kpc), this should have been ample opportunity to detect a type-I burst if the compact object would have been a neutron star (e.g., In ’t Zand 2001). Of all 24 X-ray binary transients within 20o from the Galactic center that WFC detected persistent emission from, seven failed to exhibit type-I X-ray bursts: GRO J1655-40, GRS J1737-31, GRS 1739-278 XTE J1748-288, XTE J1755-324, SAX J1819.3-2525 and SAX J1711.6-3808. Apart from the latter, these are either dynamically confirmed black hole candidates (Bailyn et al. 1995, Orosz et al. 2001) or suspected black holes on arguments different from the lack of type-I bursts (see Cui et al. 1997 for GRS J1737-31, Borozdin et al. 1998 for GRS 1739-278, e.g. Miller et al. 2001 for XTE J1748-288, and Goldoni et al. 1999 for XTE J1755-324).
It is tempting to explain the line broadness as relativistic broadening, in analogy to such features in a number of active galactic nuclei, most notably in MCG-6-30-15 by Tanaka et al. (1995) and NGC 3516 by Nandra et al. (1999; for a recent review, see Fabian 2001). The line energies in those cases are about 6.5 keV, and the equivalent widths between 0.3 and 0.6 keV. If we do this, our data suggests that we are viewing this system nearly edge on. If the inclination angle is really that high, one would have expected orbital signatures ([partial] eclipses, dips) in the light curve, but none were detected. This may have been chance coincidence, since our data coverage is not exhaustive (i.e., 4.7 days net exposure time which compares to BHC orbital periods of 0.2 to 6.5 d).
In analogy to other Galactic stellar black hole X-ray transients, the relatively low luminosity, the hard continuum spectrum in combination with a weak black body component, and the power density spectrum show that this source was primarily observed in the so-called low/hard state (e.g., Tanaka & Lewin 1995) when the inner edge of the optically thick accretion disk is thought to be much further out than the innermost stable circular orbit (6 for a non-spinning compact object). Therefore, if the broadening of the Fe-K line is relativistic in nature, either it is unrelated to the accretion disk or the low/hard state is unrelated to the radius of the inner edge of the accretion disk. Both these possibilities seem unlikely.
An alternative to the relativistic interpretation of the line broadening is Comptonization of the line photons by the keV plasma that is measured through the continuum. The expected width is . The width is consistent with the measured value if . This value is in rough agreement with the measurements. Broadening due to Comptonization seems more likely than due to relativistic orbital motion because it would naturally explain the line flux increase at the time of the soft excess increase. When a soft excess appears, the inner edge of the accretion disk is thought to move closer in (due to an increased mass accretion rate). As a result, the emission from the disk becomes harder. This may yield higher Fe-K fluxes. The lack of change in line energy and broadness (compare Figs. 5 and 9) indicates that the plasma cloud is not related to the accretion disk but located in a spherical geometry around the compact object.
Another alternative is Comptonization in approaching and receding outflows. Fender (2001) shows that low/hard state black hole X-ray binaries like 1E 1740.7-2942 and Cyg X-1 exhibit radio emission that is thought to arise from collimated outflows which is supported in some cases by spatially resolved observations. A correlation between hard X-ray and radio flux suggests that these outflows do not have large bulk Lorentz factors, unless both fluxes are beamed by the same factor. This is in line with the width of the Fe-K feature in SAX J1711.6-3808 which would imply Lorentz factors up to at most 2.
9 Summary
SAX J1711.6-3808 is a transient X-ray source which was seen active for the first time in January through May 2001. It was moderately bright, indicating sub-Eddington accretion levels throughout the outburst. The Galactic latitude, brightness and spectrum identify SAX J1711.6-3808 as a Galactic X-ray binary; optical confirmation proves difficult because of the large extinction. The lack of type-I X-ray bursts and coherent oscillations, and the exhibition of a broad Fe-K emission feature suggest that the primary in SAX J1711.6-3808 is a black hole.
Acknowledgements.
We thank Tim Oosterbroek, Takamura Tamura, Carlo Ferrigno, and Keith Jahoda for assistance in the various aspects of the data analysis, Jelle Kaastra for useful discussions, and Ron Remillard for his help in obtaining the ASM light curves. JZ and EK acknowledge financial support from the Netherlands Organization for Scientific Research (NWO).References
- (1) Asai, K., Dotani, T., Nagase, F., & Mitsuda, K. 2000, ApJS 131, 571
- (2) Bailyn, C.D., Orosz, J.A., Girard, T.M., et al. 1995, Nat 374, 701
- (3) Boella G., Butler R. C., Perola G. C., et al., 1997a, A&AS 122, 299
- (4) Boella G., Chiappetti L., Conti G., et al. 1997b, A&AS 122, 327
- (5) Borozdin, K.N., Revnivtsev, M.G., Trudolyubov, S.P., & Aleksandrovich, N.L. 1998, Astron. Lett. 24, 855 (Russian ed.)
- (6) Campana, S., Stella, L., & Belloni, T. 2002, A&A, in press
- (7) Chen, W., Shrader, C.R., & Livio, M. 1997, ApJ 491, 312
- (8) Cocchi, M., Natalucci, L., in ’t Zand, J.J.M., et al. 1999, IAUC, 7247
- (9) Cornelisse, R., Verbunt, F., in ’t Zand, J.J.M., et al. 2002, A&A, in press
- (10) Cui, W., Heindl, W.A., Swank, J.H., et al. 1997, ApJ 487, L73
- (11) Drilling, J.S., & Landolt, A.U. 2000, in Allen’s Astrophysical Quantities, 4th edition, ed. A.N. Cox, AIP, 381
- (12) Fabian, A.C., Rees, M.J., Stella, L., & White, N.E. 1989, MNRAS 238, 729
- (13) Fabian, A.C. 2001, in Proc. 20th Texas Conference on Relativistic Astrophysics (Dec. 2000, Austin, Texas), in press
- (14) Fender, R.P. 2001, MNRAS 322, 31
- (15) Feng, Y.X., Zhang, S.N., Sun, X., et al. 2001, ApJ 553, 394
- (16) Frontera F., Costa E., Dal Fiume D., et al. 1997, A&AS 122, 357
- (17) Frontera, F., Palazzi, E., Zdziarski, A., et al. 2001, ApJ 546, 1027
- (18) Goldoni, P., Vargas, M., Goldwurm, A., et al. 1999, ApJ 511, 847
- (19) Gottwald, M., Parmar, A.N., Reynolds, A.P., et al. 1995,’ A&AS 109, 9
- (20) Hua, X.-M., Titarchuk, L. 1995, ApJ 449, 188
- (21) In ’t Zand, J.J.M., Heise, J., Bazzano, A., Cocchi, M., Smith, M.J.S. 1999, IAUC 7243
- (22) In ’t Zand, J.J.M. 2001, In Proc. 4th INTEGRAL workshop (Sep. 2000, Alicante, Spain), eds. V. Reglero, 463 (astro-ph/0104299)
- (23) In ’t Zand, J.J.M., Kaptein, R.G., Heise, J. 2001, IAUC 7582
- (24) Jager R., Mels W.A., Brinkman A.C., et al., 1997, A&AS 125, 557
- (25) Jahoda, K., Swank, J.H., Stark, M.J., et al. 1996, Proc. SPIE 2808, 59
- (26) Jansen, F., Lumb, D., Altieri, B., et al. 2001, A&A 354, L1
- (27) Laor, A. 1991, ApJ 376, 90
- (28) Leahy, D.A., Darbro, W., Elsner, R., et al. 1983, ApJ, 266, 160
- (29) Magdziarz, P., & Zdziarski, A.A. 1995, MNRAS, 273, 837
- (30) Manzo G., Giarusso S., Santangelo A., et al. 1997, A&AS 122, 341
- (31) Miller, J.M., Fox, D.W., Di Matteo, T., et al. 2001, ApJ 546, 1055
- (32) Miller, J.M., Fabian, A.C., Wijnands, R., et al. 2002, ApJ, submitted (astro-ph/0202083)
- (33) Mitsuda, K., Inoue, H., Koyama, K., et al. 1984, PASJ, 36, 741
- (34) Morrison R., & McCammon D. 1983, ApJ 270, 119
- (35) Naik, S., Agrawal, P.C., Paul, B., et al. 2000, A&A 354, 938
- (36) Nandra, K., George, I.M., Mushotzky, R., Turner, T.J., & Yaqoob, T. 1999, ApJ 523, L17
- (37) Narita, T., Grindlay, J.E., & Barret, D. 2001, ApJ 547, 420
- (38) Orosz, J., Kuulkers, E., Van der Klis, M., et al. 2001, ApJ, 555, 489
- (39) Oosterbroek, T., Barret, D., Guainazzi, M., & Ford, E.C. 2001, A&A 366, 138
- (40) Parmar A.N., Martins D.D.E., Bavdaz M., et al., 1997, A&AS 122, 309
- (41) Revnivtsev, M.G., Trudolyubov, S.P., & Borozdin, K.N. 2000, MNRAS 312, 151
- (42) Rieke, G.H., & Lebofsky, M.J. 1985, ApJ 288, 618
- (43) Sobczak, G.J., McClintock, J.E., & Remillard, R.A., 2000, ApJ 544, 993
- (44) Strohmayer, T. E. 2001a, ApJ Letters, 552, L49
- (45) Strohmayer, T. E. 2001b, ApJ Letters, 554, L169
- (46) Strüder, L., Briel, U., Dennerl, K., et al. 2001, A&A 365, L18
- (47) Swank, J., & Markwardt, C. 2001, In Proc. “New Century of X-ray Astronomy”, eds. H. Kunieda & H. Inoue, PASP Conf. Ser., in press
- (48) Tanaka, Y., Nandra, K., Fabian, A.C., et al. 1995, Nat 375, 659
- (49) Titarchuk, L. 1994, ApJ 434, 313
- (50) Titarchuk, L., & Lyubarskij, Y. 1995, ApJ 450, 876
- (51) Tomsick, J.A., Kaaret, P., Kroeger, R.A., & Remillard, R.A. 1999, ApJ 512, 892
- (52) Turner, M.J.L., Abbey, A., Arnaud, M., et al. 2001, A&A 354, L27
- (53) Van Paradijs J., & McClintock J.E., 1995, in “X-ray binaries”, eds. W.H.G. Lewin, J. van Paradijs and E.P.J. van den Heuvel, CUP, 58
- (54) van der Woerd, H., White, N.E., & Kahn, S.M. 1989, ApJ 344, 320
- (55) Wijnands R., & Miller, J. 2002, ApJ 564, 974