The Clustering, Number Counts and Morphology of Extremely Red () Galaxies to
Abstract
Using and band imaging of the ELAIS N2 field, we investigate the number counts, clustering, morphology and radio/X-ray emission of extremely red objects (EROs), defined as galaxies with . This criterion will select old, passive ellipticals at . To we identify a total of 158 EROs in 81.5 . The ERO number counts are lower than predicted by pure luminosity evolution models, but higher than predicted by current CDM-based hierarchical models. The ERO counts are consistent with a non-evolving model and also with a luminosity evolution model incorporating moderate merging and a decrease with redshift in the comoving number density of passive galaxies (‘M-DE’).
We investigate the clustering of the EROs by calculating their angular correlation function, , and obtain a detection of clustering at –20 limits. The amplitude of these EROs is much higher than that of full -limited samples of galaxies, and best-fitted by models with a comoving correlation radius – Mpc. These results, which are in agreement with Daddi et al. (2000), suggest that the intrinsic clustering of at least the brighter EROs is even stronger than that of present-day giant ellipticals.
We estimate seeing-corrected angular sizes and morphological types for a subsample of EROs (31 galaxies) and find a 3:2 mixture of bulge and disk profiles. Of these EROs appear to be interacting, disturbed or otherwise irregular, and two are visible mergers. We find the angular sizes of the bulge-profile EROs are consistent with passively evolving ellipticals in the M-DE model, at the expected –2. The ERO mean radii are smaller than the non-evolving prediction, implying surface brightness evolution.
Seven of the 31 bright EROs are detected as radio sources in a VLA survey. The strongest, at 5 mJy, is also a Chandra X-ray detection, and lies at the centre of a significant overdensity of EROs – it is probably an FRI radio galaxy in a cluster. Of the other, much fainter, sources, five are point-like and may be weak AGN, while the sixth is elongated and aligned with the optical axis of an extended, low-surface brightness ERO, and hence probably a ULIRG-type starburst.
A possible interpretation is discussed in which the EROs are a mixture of (i) ‘pEROs’, strongly clustered passively evolving giant ellipticals, formed at high redshifts, the oldest EROs, and (ii) ‘dsfEROs’, dusty post-interaction galaxies, with a few active starbursts (ULIRGs), and less strongly clustered. With time, the younger dsfEROs are continually assimilated into to the ERO class, diluting the clustering and increasing the comoving number density. Both types ultimately evolve into today’s early-type galaxies.
keywords:
galaxies: evolution; galaxies: elliptical and lenticular, cD; galaxies: high-redshift; radio continuum: galaxies1 Introduction
Deep surveys at near-infra-red () wavelengths revealed that a population of very red ( or , Vega system) galaxies appears faintward of (e.g. Elston et al. 1988; Hu and Ridgeway 1994). The colours and magnitude range of these ‘extremely red objects’ (EROs) are consistent with old, passive (i.e. no longer forming new stars) galaxies, observed at or beyond. These would be the progenitors of present-day giant ellipticals, thought to have formed their stars at even higher () redshifts.
The EROs are of great cosmological interest, as they will include the earliest formed of all galaxies, and their properties will help to answer the long-standing mysteries concerning the early evolution of elliptical galaxies (e.g. Jimenez et al. 1999). One hypothesis is that the present-day ellipticals formed in single starbursts at , thereafter undergoing only passive luminosity evolution, as in pure luminosity evolution (PLE) models, another is that they formed more recently through mergers of spiral galaxies, or by some combination of the two. Initial surveys of EROs (e.g. Barger et al. 1999) found fewer than expected from PLE models, and implied that per cent of the local E/S0s could have formed in a single high-redshift starburst. However, the detection with SCUBA of many sub-mm sources, with optical magnitudes and colours consistent with dusty galaxies at , and fluxes indicative of star-formation rates (SFRs) as high as , provided strong evidence that some massive galaxies did form in intense early starbursts (e.g. Smail et al. 1999). The passive EROs could then be the intermediate stage between the SCUBA sources and local giant ellipticals.
With sufficient dust-reddening, high-redshift star-forming galaxies may also have . Spectroscopy of a few of the brightest EROs revealed that both old, passive (e.g. Dunlop et al. 1996; Spinrad et al. 1997; Stanford et al. 1997) and dusty starburst (e.g. Dey et al. 1999; Smith et al. 2001) galaxies were present, but the relative proportions remained uncertain.
The morphologies of the EROs provide further information on their nature. Moriondo, Cimatti and Daddi (2000) fitted radial profiles to WFPC2 and NICMOS images of 41 EROs (to ) and estimated that 50–80 percent were elliptical-like and 15 percent irregular or interacting. Stiavelli and Treu (2000) studied 30 EROs to , using NICMOS, and classified these into E/S0, disk, irregular and point-like morphologies in a ratio 18:6:3:3. They assumed that only the first type were the progenitors of local E/S0s, and by comparing the counts of these with a PLE model (with , ), estimated only per cent of the present-day number of E/S0s could have formed at .
Daddi et al. (2000) presented the first measurements of ERO clustering. They found the angular correlation function, , of EROs to be almost an order of magnitude higher than that of all galaxies to the same limit. As local giant ellipticals are intrinsically much more clustered than disk galaxies (e.g. Guzzo et al. 1997), this was interpreted as evidence that most EROs are ellipticals.
Manucci et al. (2001) attempted a photometric separation of passive and dusty, star-forming EROs – hereafter pEROs and dsfEROs – on a plot of against . Within a sample of 57 EROs with , they assigned equal numbers (21) to each class. Cimatti et al. (2002a) provided the first true measurement of the dsfERO/pERO ratio, identifying by spectroscopy approximately equal numbers (15 ‘dsf’, 14 ‘p’) amongst 45 EROs with . Firth et al. (2002) investigated ERO clustering to () and obtained similar results to Daddi et al. (2000).
In this paper we select a sample of EROs from new and band images, investigate their number counts, clustering and morphologies and compare these results with evolutionary models. We do not yet have spectroscopy for these galaxies, but do have deep radio and X-ray observations which may identify starbursts and AGN. Magnitudes in this paper are given in the Vega system and can be converted to the AB system using and . Quantities dependent on Hubble’s Constant are given in terms of or km .
This paper is organized as follows: Section 2 describes the dataset and its reduction and analysis, and Section 3 the selection of the EROs and their distribution on the sky. In Sections 4 and 5 we investigate, in turn, the number counts and angular correlation function, , of the EROs and other galaxies, and compare with models. In Section 6 we fit radial profiles to a subsample of brighter, , EROs to investigate their morphologies and angular sizes, and in Section 7 describe the radio properties. 8 discusses these findings and with other recent studies of EROs , and their possible interpretation.
2 Observations
2.1 Data: and Imaging
Our () and band imaging covers an area within field N2 of the European Large Area ISO Survey (ELAIS, Oliver et al. 2001), centered at R.A. Dec +41:04:30. The first part of the -band data consists of a mosaic of 16 contiguous fields observed using the UKIRT Fast-Track Imager (UFTI), on Mauna Kea, Hawaii, between 1 January and 31 May 2000. Most frames received a total of 8000 seconds exposure time. The UFTI camera contains a pixel HgTeCd array which, with a pixel size of 0.091 arcsec, covers arcmin.
The second part consists of three fields observed with the Isaac Newton Group Red Imaging Device (Ingrid) on the William Herschel Telescope (WHT), La Palma. The Ingrid fields lie on the edges of the UFTI mosaic, overlapping it slightly. Ingrid is fitted with a pixel near-IR detector with a pixel size of 0.238 arcsec, covering arcmin. Our Ingrid data are not quite as deep as the UFTI mosaic, due to a shorter exposure time (5540 sec) and lower instrumental sensitivity.
The UFTI and Ingrid observations lie within the area of an -band image obtained with the Prime focus camera on the WHT (May 1999). This instrument contains 2 mosaiced pixel EEV chips, with a pixel size of 0.238 arcsec, covering arcmin. The -band data, obtained in May 1999 as part of a study of faint Chandra X-ray sources (González-Solares et al. 2002), consists of 13 spatially dithered 600 sec exposures, combined to give an octagonal arcmin frame with detection limit . This has accurate astrometry (to arcsec) based on the positions of radio sources.
2.2 Radio/X-ray/sub-mm Data
The ELAIS N2 field has been surveyed in a number of other passbands. Radio (VLA) observations (Ivison et al. 2002) reach a detection limit of (with beam size arcsec), and detect sources. The available X-ray data consist of a 75ks Chandra observation made on 2 August 2000, covering a arcmin field, in which 91 sources were detected to – ergs (Manners et al. 2002; Almaini et al. 2002), most of which now have optical identifications (González-Solares et al. 2002). Sub-mm observations with SCUBA, detected 17 sources above a limit mJy (Scott et al. 2002).
2.3 Data Reduction
The UFTI and Ingrid data were reduced and analysed using IRAF. The UFTI dataset was made up of 16 pointings, each observed for 9 spatially dithered exposures of 800 sec (two pointings had slightly different exposures of 700 sec and 1100 sec and were renormalized to 800 sec). Our intention was to combine all exposures into a single mosaiced image, and to this end, the spacing between the grid of pointings had been matched to the field-of-view and dither pattern so that the resulting mosaic would have an approximately uniform 7200 sec coverage (except at the edges).
The sky background was subtracted from all UFTI data (using IRAF ‘sky’). Astrometry was derived for each pointing, by reference to detections on the WHT image. However, even with these transforms, the raw exposures could not be mosaiced with acceptable accuracy, indicating slight rotations or other distortions between them. This problem was remedied by choosing one pointing as a reference and then using IRAF ‘wcsmap’ to fit a general polynomial transform between its co-ordinate system and that of the other 15. These 15 frames were then rebinned, using IRAF ‘geotran’, into the co-ordinate system of the reference. The rebinned data could then be simply combined, using IRAF ‘combine’ (with ‘offsets=wcs’), into a 16-frame UFTI mosaic (taking care to exclude any ‘bad’ regions from each exposure in the summation). The final step was to trim the noisy edges (which received less than the full exposure time) from the mosaic, to leave a total usable area of 38.7 .
The three fields of Ingrid data overlap slightly with the UFTI mosaic, but not with each other, and were reduced separately. The data for each field consisted of 90 spatially dithered exposures of 61.56 seconds (each in turn made up of 6 exposures which were co-added during observing). All exposures were debiased, and flat-fielding was performed for blocks of 9 consecutive exposures, by dividing them by their median image (derived using ‘combine’ with sigclip rejection, and normalized to a mean of unity).
The spatial dithers, which followed the same sequence for each block of 9 exposures, were measured using ‘xregister’. All 90 exposures of each of the three fields could then be added using ‘combine’. Magnitude calibration was determined from short exposures of UKIRT standard stars, interspersed with the observations. We then matched –15 stars on each Ingrid field (detected as described below) to their known RA and Dec on th WHT image and fitted astrometric transforms using IRAF ‘pltsol’ (with rms residuals 0.11–0.25 arcsec).
2.4 Source Detection
Sources were detected on the and images using SExtractor (Bertin and Arnauts 1996). Throughout, magnitudes given are the ‘total’ magnitudes derived by SExtractor by fitting elliptical apertures to each individual detection.
For the UFTI mosaic, our detection criterion was that a source must exceed a threshold (21.36 mag ) in 16 contiguous pixels (0.13 ), and we also used a detection filter of Gaussian FWHM 4 pixels. Using a plot of detection magnitude against FWHM, stars could be separated from galaxies to and many spurious noise detections could be rejected. The mean FWHM of unsaturated stars was only 0.67 arcsec, indicating very good seeing, although there is significant variation in the PSF between the different frames of the mosaic.
For the WHT -band image, our detection threshold was (26.66 mag ) in a minimum area 4 pixels (0.23 ), with a detection filter of 2.0 pixels Gaussian FWHM. The total usable area is 212 . The mean stellar FWHM is 0.76 arcsec, and from the number count of detected galaxies, detection appears to be complete to , with moderate (25–30 per cent) incompleteness at and a turnover at . The Ingrid data (total area 49.5 ) have a similar pixel size and again we used the detection criterion of (20.60–20.65 mag ) in pixels, with a Gaussian 2.0 pixel FWHM filter. Stars (45) were separated from galaxies to . The mean stellar FWHM of 0.68 arcsec again indicated good seeing. The galaxy counts from the Ingrid data are very similar to the UFTI counts to but turn over at rather than at , hence are mag less deep.
The next step was to merge the Ingrid and UFTI catalogs, by flagging for exclusion the Ingrid detections within the area already covered by the UFTI mosaic. The Ingrid and UFTI magnitudes of the overlap-region objects were generally consistent within mag. Excluding overlaps reduced the total catalog area to 83.6 . Hereafter we make use of the combined UFTI+Ingrid catalog to and the UFTI mosaic only at .
3 Identifying the Galaxies
3.1 The Significance of
Galaxies with observer-frame ( in the AB system) are either old, passive (zero or near-zero SFR) galaxies at , or are very dust-reddened. Figure 1 shows against redshift for three models, computed using Pegase2 (Fioc and Rocca-Volmerange 1997) with the time-redshift relation for , and .
(i) An evolving model representing an elliptical galaxy, which forms stars in a 1 Gyr dust-reddened burst at . The SFR and dust then fall to zero, and passive evolution occurs. The galaxy would have at all and hence is a ‘pERO’.
(i) A pure, non-evolving starburst, with very strong dust reddening of mag. Such ‘dsfEROs’ are reddest at , but if as dusty as this model can be EROs at all . Starburst galaxies with an old stellar component, or post-starbursts, could be EROs with somewhat less reddening.
(iii) For comparison, a model representing an evolving spiral (Sbc) with near-solar metallicity and a ‘normal’ amount of dust. ‘Normal’ star-forming spirals like this do not have at any redshift.

3.2 ERO Selection
The -detected galaxies were matched in RA and Dec with detections on the WHT -band image, within a maximum offset radius of 1.5 arcsec (two small areas of Ingrid data were not covered in , slightly reducing the overlap region to 81.5 ). The colour of each galaxy was taken to be simply the difference of the and total magnitudes. To test this, the ‘total mag’ colours were compared with measured in fixed circular (2.5 arcsec) apertures, for a subsample of EROs. These colours agreed within mag in most cases, with no significant systematic difference.
Any detection with either or no counterpart was flagged as a candidate ERO. The detections in the latter category are either (i) spurious, (ii) real galaxies where the counterpart is obscured (e.g. by a diffraction spike) or merged with a brighter detection, (iii) real galaxies too faint in to be detected on our image, which can reasonably be classified as EROs. All were carefully examined by eye, on the image and at the corresponding position on the image. In this way, a number of spurious detections were identified, and thereafter excluded.
Our final catalog of verified EROs consists of 158 objects (including 49 undetected in ), of which 99 are on the UFTI mosaic. Figure 2 shows against magnitude for the detected galaxies – EROs appear only at faint magnitudes, mostly . One much brighter () object has , but appears stellar and is almost certainly a red Galactic star, and is not included here as an ERO.

3.3 Spatial Distribution
Figure 3 shows the distribution of EROs. ERO maps are useful for identifying galaxy clusters at , where the early-type members will show up as an arcmin-scale overdensity (e.g. Stanford et al. 1997). In our data, there may be a group of EROs centered on UFTI detection number 608, a bright ERO () of particular interest in that it is a radio and X-ray source (Section 7). Within a 45 arcsec radius (shown on Figure 3) of its position there are 8 EROs with , compared to 2.4 expected for a random distribution. These EROs are discussed further in Section 6.3.

4 Number Counts of Galaxies and EROs
4.1 Observations
Figure 4 shows -band differential number counts for all galaxies, from the combined UFTI+Ingrid data at and UFTI data only at . Also shown are counts from the deeper (to ) Keck and ESO-VLT surveys of Moustakas et al. (1997) and Saracco et al. (2001). Our counts are reasonably consistent with these, although lower at , suggesting some incompleteness – the ratio of our galaxy count to that of Saracco et al. (2001) falls from 0.968 at to 0.725 at and 0.611 at .

Figure 5 and Table 1 show number counts for EROs only. The fraction of EROs in the UFTI+Ingrid data is 112/812 = 13.8 per cent at and 158/1076 = 14.7 per cent at . The ‘incompleteness corrected’ count is derived by dividing our observed ERO count by the ratio of our count for all galaxies to that of Saracco et al. (2001) at the same limit. Also plotted are the ERO counts from Daddi et al. (2000), and the Saracco et al. (2001) ERO counts – note that the latter are selected with a different criterion of , which may include a greater number of ‘dsfEROs’. Our ERO counts agree well with these two surveys.

| (Obs.) | (‘Corrected’) | ||
|---|---|---|---|
| interval | |||
| 17.0–17.5 | 1 | - | |
| 17.5–18.0 | 3 | - | |
| 18.0–18.5 | 8 | - | |
| 18.5–19.0 | 23 | - | |
| 19.0–19.5 | 38 | - | |
| 19.5–20.0 | 39 | 3560. | |
| 20.0–20.5 | 20 | 5279. | |
| 20.5–21.0 | 26 | 8143. |
4.2 Models: PLE, NE, Merging and ‘M-DE’
These counts are compared with simple galaxy evolution models, with and without the effects of merging. For the models considered in this paper, we adopt cosmological parameters of , (using the analytic luminosity distance formula of Pen 1999) and the obseravtional (from 2MASS) -band galaxy luminosity functions of Kochanek et al. (2001). luminosity evolution is modelled using Pegase2 (Fioc and Rocca-Volmerange 1997) with a range of star-formation histories, and (as in Roche et al. 2002), an initial mass function with the Salpeter slope (where ) at , flattening to at .
Galaxies in the early-type luminosity function (represented as a Schechter function with , for ) form all their stars in an initial dust-reddened ( mag ) burst, beginning 16 Gyr ago (), with a range of durations represented as either 1 Gyr (for half) or 2 Gyr. After the burst both dust and SFR fall to zero and evolution is thereafter passive. Galaxies in the late-type luminosity function (, for ) are represented with a range of continuous star-formation models with different timescales and moderate dust (in the amounts calculated by Pegase). The only galaxies in this model are the E/S0s at .
In the pure luminosity evolution (PLE) model the galaxies evolve only in , with no change in or . As our version of this model gives relatively strong evolution, we also show a non-evolving (NE) model, with the same luminosity function at . In our merging model, the evolution of luminosity per unit mass in the same as the PLE model, but superimposed on this is an increase in comoving number density () and an associated decrease in the characteristic galaxy mass () with redshift, cancelling out some of the evolution in galaxy luminosity ().
The merger rate is parameterized in terms of the effect of merging on galaxy mass, per Hubble time (). Observationally, Patton et al. (2001) estimated from CNOC2 data that to . If we assume this evolution to continue to , with constant at , then will evolve as:
approximating the lookback time , gives . Substituting,
Integrating,
and,
with this gives . If the corresponding opposite evolution in comoving number density, , occurs at the same rate (), galaxies at are half as bright but twice as numerous as they would be in a PLE model.
The counts of all galaxies (Figure 4) exceed the NE model, and are more consistent with PLE or merging. The observations do not firmly distinguish between these two, as the model counts are relatively insensitive to merging. Beyond the limits of our survey there is some indication that the count exceeds all three models, which may indicate the luminosity function has a steeper faint-end slope than derived by Kochanek et al. (2001).
On Figure 5 the same models are used to predict the counts of EROs. Although only the ‘pERO’ type is included, our PLE model overpredicts the ERO counts at all magnitudes, by factors . The inclusion of merging improves the fit at the bright end, but increases the overprediction at . However, the non-evolving model does fit the ERO counts.
Firth et al. (2002) similarly found number counts of EROs to be well-fitted by a non-evolving model to (), and also claim that this model fits their photometrically-estimated redshift distribution . Our PLE model, with its relatively top-heavy IMF and ejection of the dust at the end of the starburst, gives strong evolution for E/S0s, and in combination with the high formation redshift, predicts a high ERO count. ‘Milder’ PLE models may be somewhat closer to the observed ERO counts, but to be consistent with them, we and Firth et al. (2002) had to reduce evolution to near-zero. Cimatti (2000b) did fit the ERO counts with a PLE model, but only for an elliptical formation redshift , which is unrealistically low in view of the existence of Lyman break objects, SCUBA sources and radio galaxies at . Hence we conclude that the number counts of EROs are in general inconsistent with PLE models.
With the aim of finding a physically realistic evolving model for ERO counts, we consider the merging model again, and retain while varying to best-fit our incompleteness-corrected ERO count. The minimum occurs for (with error bar ). Figure 5 shows the counts for this model, hereafter ‘M-DE’ (merging with negative density evolution). They are very similar to the NE model counts, to , and in good agreement with observations.
Figure 6 illustrates the features of the M-DE model. Both mass and comoving number density decrease with redshift. Luminosity per unit mass (shown for restframe and ) increases with redshift due to passive evolution (at the galaxy is starbursting and most of the red light is hidden by dust). Luminosity () increases with at a slower rate as it is partially cancelled by the decrease in mass. Physically, this model could be represented as 60 percent of the present-day comoving number density of E/S0 galaxies forming at , and 42 percent at , with the remainder originating at lower redshifts, e.g. from mergers of disk galaxies in which the remaining gas content is exhausted in a merger-triggered starburst. Some spiral-to-elliptical transformation could also occur through the cumulative effect of non-merging interactions, or gas-stripping in clusters.

In addition to rejecting the PLE model, the ERO counts do not support the other extreme case of ‘pure’ hierarchical merging. Cimatti (2002b) compares the observed count of passive EROs at with the predictions of two such models from Firth et al. (2002) and Smith et al. (2002), both derived from CDM cosmologies. These models predict, respectively, 0.19 and 0.04 EROs at . Our observed (UFTI+Ingrid) count of EROs to this limit is , and hence a mixture of formation histories, as represented by the M-DE model, is preferred.
5 Clustering of EROs
5.1 Calculating the Angular Correlation Function
The clustering properties of the EROs will provide clues to their nature and history. We investigate the clustering by calculating the angular correlation function, , for both galaxies and full -limited samples, by the methods described below. To we use the combined UFTI and Ingrid catalogs, but for fainter limits the analysis is limited to galaxies on the UFTI mosaic.
For galaxies brighter than a chosen magnitude limit, there will be possible galaxy-galaxy pairs. These are counted in bins of separation of width , giving a function . A large number of random points ( here) is scattered over the same area as covered by the real galaxies, and the separations of the galaxy-random pairs, taking the real galaxies as the centres, are counted in bins to give . The separations of the random-random pairs are also counted to give .
If , and and are the galaxy-random and random-random counts normalized to have the same summation over ,
then, using the Landy and Szalay (1993) estimator,
Errors were estimated by dividing the data area into 20 sub-areas and then recalculating for 20 subsamples, each time excluding both the real galaxies and the random points from a different sub-area and using the remaining 19. The scatter between the of these 20 subsamples is then multiplied by to give the error bars for the full dataset .
This estimate will be negatively offset from the true due to the restricted area of observation (the ‘integral constraint’). If the real is of the form , where is an amplitude, the estimate corresponds to . The negative offset can be estimated by doubly integrating an assumed true over the field area ,
Using the random-random correlation, this can be done numerically –
Assuming , this gives for the combined UFTI+Ingrid area, and 13.46 for the UFTI mosaic only.

The amplitude is then obtained by least-squares fitting to the observed , over the range arcsec, weighting each point using the error bars estimated as above. To estimate an error on , the same function is then fitted to the of each of the 20 subsamples, and multiplying the scatter between the subsample by, again, 4.25.
5.2 results
For the EROs we detect positive clustering at the level at magnitude limits –20.0. To the smaller sample provided by the only the UFTI data gives only evidence of clustering. At –21.0, there is no detection even at , but we do not consider these limits here as is likely to be affected by the incompleteness. For the full -limited sample the detection of clustering never reaches , and the upper limits indicate the is about an order of magnitude lower than for EROs at the same limits.
Figure 7 shows the observed , with the fitted functions, at two -band limits, and Table 2 gives the best-fit with errors. Figures 8 and 9 show our against limit, together with results from previous clustering analyses and models (described below). In general our results are consistent with all the published , support the strong clustering of EROs reported by Daddi et al. (2000) and Firth et al. (2001), and suggest that this continues to at least .
| mag | All galaxies | EROs | ||
|---|---|---|---|---|
| limit | ||||
| 19.50 | 615 | 73 | ||
| 19.75 | 714 | 93 | ||
| 20.00 | 813 | 112 | ||
| 20.25 | 418 | 63 | ||


5.3 Modelling and Interpretation of
The observed of any sample of galaxies depends on their redshift distribution , and the cosmological geometry (through the angular size distance), as well as on the intrinsic clustering of the galaxies, as parameterized by their two-point correlation function in three dimensions, . Hence to interpret , we begin by modelling .
Figure 10 shows the of EROs, at and , as given by our NE, PLE and M-DE models. PLE gives the highest numbers of EROs and most extended , while the M-DE model is much lower in normalization and a little less extended in redshift, especially at the brighter limit. The NE model, as previously noted, gives similar numbers of EROs to M-DE, but the is even less extended and peaks at a lower redshift.
The intrinsic (three-dimensional) clustering of galaxies and its evolution with redshift is represented here by the power-law form
where is the local correlation radius, (observationally) and represents the evolution with redshift, being clustering stable in proper co-ordinates, and comoving clustering. This produces a projected (two-dimensional) clustering, , where the amplitude is given by Limber’s formula (see e.g. Efstathiou et al. 1991),
where is the proper distance and for .

Figure 8 shows four models for the scaling of all galaxies with -band limit, all with the normalization Mpc, as estimated by Cabanac, de Lapparent and Hickson (2000) from an -band survey. The NE model predicts a higher than the PLE and merging () models, due to the less extended , and a negative increases .
The observed are consistent with or slightly above the merging and PLE models with . The NE and especially the comoving model overpredict the to some extent.
Figure 9 shows some models which fit the of EROs. Giant ellipticals are found in local surveys to be more strongly clustered than ‘average’ galaxies; e.g. Guzzo et al. (1997) estimate Mpc for E/S0s with . If the EROs, or most of them, are indeed the progenitors of massive ellipticals, they would be expected to show similarly strong clustering. To estimate the intrinsic clustering () of EROs, we very the to minimize the for the 7 plotted data points (from all three surveys) at , for our M-DE and NE models, and for both and .
For comoving clustering, we best-fit Mpc for the M-DE model and Mpc for NE, and for stable clustering, Mpc for the M-DE model and Mpc for NE. We note that Firth et al. (2002) estimate very similar for EROs and a photometrically estimated . Our four fitted models are very similar to , and all are consistent within of the observations – much deeper data will be needed to constrain the evolution within the range.
In summary, for the probable range of E/S0 luminosity evolution, we estimate the intrinsic clustering of bright, , EROs, in the form of a comoving correlation radius, as –13. This implies that the intrinsic clustering of at least the brighter EROs is indeed stronger than that of ‘average’ galaxies, and even exceeds the Mpc of present-day giant ellipticals, although it may not quite equal the Mpc of local Abell clusters (Abadi, Lambas and Muriel 1998). This is discussed further in Section 8.2.2.
| Number | R.A | Dec. | ell | Type | sig | other | ||||
| r91 | 16:36:54.32 | 40:56:57.43 | 19.084 | 25.655 | 0.188 | 2.1 | 0 | |||
| r196 | 16:36:47.92 | 40:57:52.13 | 19.034 | 25.859 | 0.128 | 1.03 | 0 | |||
| r256 | 16:36:48.43 | 40:58:08.46 | 18.881 | 25.038 | 0.061 | 2.1 | 0.375 | |||
| r270 | 16:36:45.13 | 40:58:15.69 | 18.843 | 24.625 | 0.229 | 4.0 | 0 | |||
| r280 | 16:36:47.87 | 40:58:22.07 | 19.325 | 24.376 | 0.171 | 1.05 | 0 | |||
| r332 | 16:36:50.31 | 40:58:42.15 | 19.226 | 24.759 | 0.118 | 0.47 | 0 | |||
| r407 | 16:36:46.62 | 40:59:16.15 | 19.472 | 0.106 | 3.3 | 0.6 | ||||
| r492 | 16:36:53.51 | 40:59:31.85 | 19.309 | 25.951 | 0.019 | 0.38 | 0.5 | |||
| r506 | 16:36:42.77 | 40:59:34.36 | 19.410 | 24.997 | 0.090 | 0.05 | 0 | |||
| r518 | 16:36:53.47 | 40:59:37.42 | 19.132 | 0.230 | 3.1 | 0 | ||||
| r552 | 16:36:56.25 | 40:59:47.74 | 19.194 | 25.288 | 0.039 | 0.05 | 0 | |||
| r561 | 16:36:53.89 | 40:59:55.92 | 18.019 | 23.246 | 0 | 0.043 | - | 1.0 | ||
| r581 | 16:37:00.60 | 41:00:06.62 | 19.356 | 26.367 | 0.248 | 0.10 | 0 | |||
| r585 | 16:36:46.19 | 41:00:05.93 | 19.131 | 26.950 | 0.248 | 1.67 | 0 | |||
| r594 | 16:36:39.43 | 41:00:07.48 | 19.377 | 26.338 | 0.210 | 0.81 | 0.25 | |||
| r599 | 16:36:45.46 | 41:00:10.81 | 19.463 | 25.957 | 0.062 | 0.08 | 0 | |||
| r608 | 16:36:57.76 | 41:00:21.71 | 17.780 | 23.176 | 0.152 | 26.1 | 0.09 | |||
| r622 | 16:36:45.80 | 41:00:23.72 | 18.501 | 24.802 | 0.325 | 14.8 | 0 | |||
| r626 | 16:36:58.36 | 41:00:25.34 | 19.338 | 25.311 | 0.056 | 0.67 | 0 | |||
| r629 | 16:36:58.51 | 41:00:28.11 | 18.728 | 24.638 | 0.104 | 2.8 | 0 | |||
| r642 | 16:36:56.99 | 41:00:31.76 | 18.610 | 24.819 | 0.105 | 7.9 | 0 | |||
| r650 | 16:36:38.92 | 41:00:33.62 | 18.984 | 24.466 | 0.438 | 16.4 | 0 | |||
| r660 | 16:36:41.05 | 41:00:38.86 | 19.248 | 25.062 | 0.582 | 12.9 | 0 | |||
| r675 | 16:36:56.29 | 41:00:46.77 | 18.695 | 23.960 | 0.429 | 0 | ||||
| r852 | 16:36:49.75 | 41:01:32.89 | 19.222 | 25.575 | 0.173 | 1.79 | 0.10 | |||
| r952 | 16:36:45.31 | 41:02:12.34 | 19.111 | 0.351 | 0.14 | |||||
| r955 | 16:37:02.38 | 41:02:19.25 | 17.471 | 22.687 | 0.142 | 17.8 | 0 | |||
| r1091 | 16:36:49.68 | 41:02:42.80 | 19.404 | 24.454 | 0.057 | 0 | ||||
| r1107 | 16:36:43.15 | 41:02:46.79 | 18.576 | 23.787 | 0.133 | 0.9 | 0.12 | |||
| r1114 | 16:36:56.54 | 41:02:47.07 | 19.105 | 24.265 | 0.150 | 0.4 | 0.50 | |||
| r1127 | 16:36:42.39 | 41:02:54.31 | 18.376 | 23.831 | 0.270 | 1.3 | 0 | |||
| r1437 | 16:36:53.52 | 41:04:50.34 | 19.283 | 24.667 | 0.156 | 0.02 | 0 |
6 Morphology and Radii of EROs
6.1 Profile Fitting and Classification
We investigate the morphology and angular sizes of the EROs, to as faint a limit as possible for our ground-based data. After some experimentation, it was found that useful morphological information could be extracted from the UFTI (but not Ingrid) images of galaxies to . Hence, this Section concentrates on the subsample of 32 EROs on the UFTI mosaic with .
Table 3 gives positions and magnitudes of these objects, labelled with their detection numbers in the SExtractor catalog (prefixed ‘r’ for red). Using IRAF ‘isophote.ellipse’, a set of elliptical isophotes were fitted to the UFTI images of each ERO, using centroids, ellipticities and position angles from the SExtractor catalog as the starting parameters. The surface brightness (SB) on each fitted isophote, as a function of semi-major axis, provides a radial intensity profile.
For each ERO, we estimate a morphological classification (i.e. bulge, disk or point-source) and half-light radius, , but this is complicated by the need to correct for atmospheric effects. The seeing point-spread function averaged 0.67 arcsec FWHM, but with significant variation between the 16 frames of the UFTI mosaic. Hence to correct for this, a bright (but not saturated), relatively isolated, star was identified on the same frame as the each ERO. Using IRAF ‘mkobjects’, a grid of model profiles was generated, including
(i) a point-source,
(ii) a set of bulge profiles,
(iii) disk (exponential) profiles,
covering a wide range of in steps of 0.01 arcsec (for a disk profile ). This grid was convolved with the seeing point-spread function as represented by the star (no sky noise is added at this stage). Using ‘isophote.ellipse’, isophotal profiles were extracted from each convolved model. Each is normalized to the same total intensity as the obseerved ERO profile, and -tested against it. The model giving the smallest is (after checking the fit by eye) then adopted as the estimate for morphological type and seeing-corrected .
To estimate an error for , a second grid was generated, containing multiple copies of the normalized, best-fit model profile. This was convolved with the seeing, and noise equivalent to the sky noise added. Isophotal profiles were extracted from the resulting set of noisy models, and tested against the observed ERO profile, and the scatter in the resulting , calculated. Returning to the first grid of noiseless models, the change away from the best-fit model that increases the by is than taken as the error on .
Where possible both a disk and a bulge model are fitted, so that the difference between their , in terms of , represents the significance by which one profile is favoured. Some EROs were not well fit by either model, but did give a lower when a central point-source component was included in the models. For these, point sources with flux fractions were combined with bulge and disk models, and we determined the (, ) combination which minimized . In some other EROs, the best-fit remained large because they have ‘peculiar’ morphologies, such as a double nucleus.
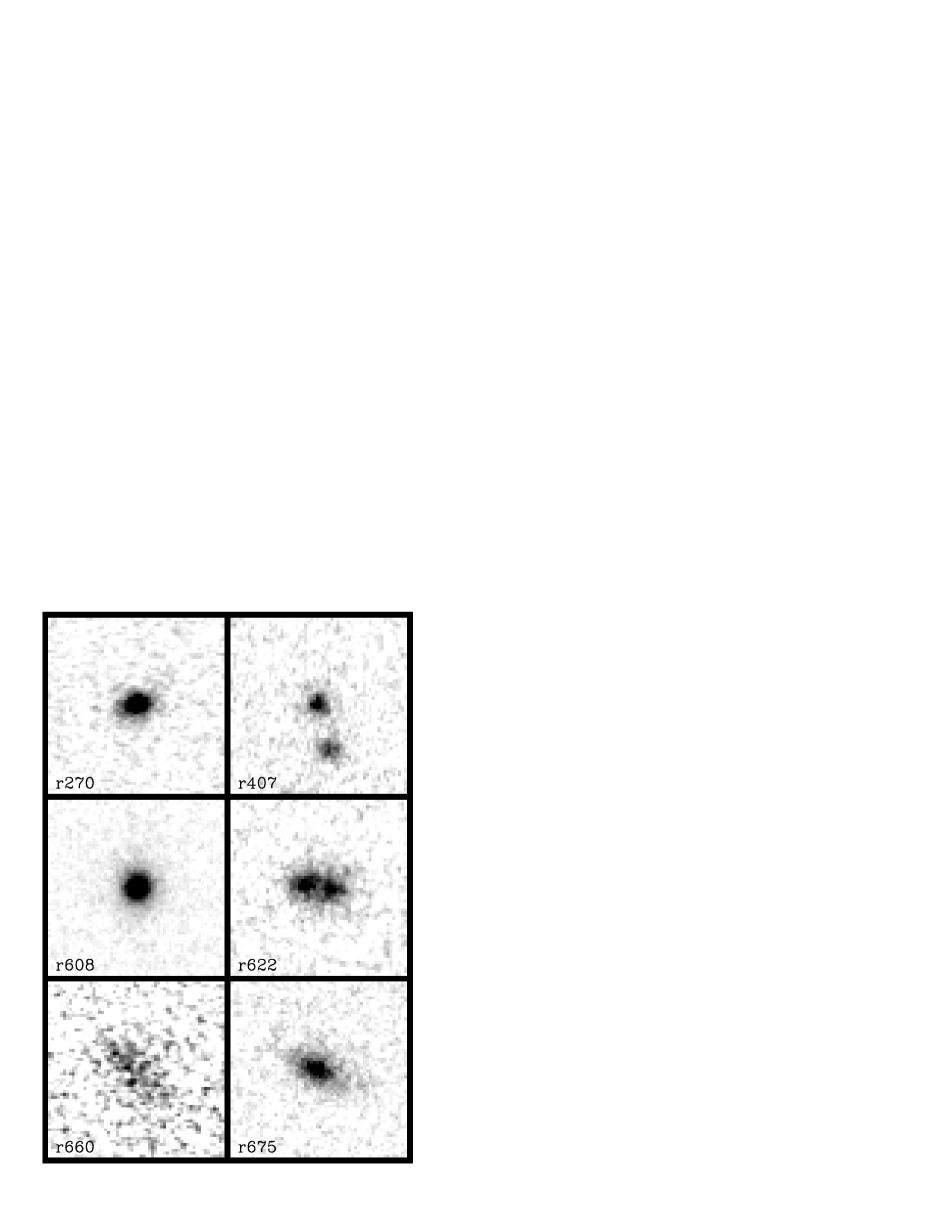
For each of the 32 bright EROs, the best-fit , ellipticity (from SExtractor), best-fit profile type and the significance by which it is favoured, are given in Table 3, and any obvious irregularity is noted. Figure 11 shows greyscale images of 6 of these EROs, representing a range of morphological types, and Figure 12 their radial intensity profiles with best-fit models.
6.2 Morphology: Summary of Results
(i) One of the 32 bright EROs, r561, appears to be a pure point-source, and is probably a red Galactic star.
(ii) Of the remaining 31 EROs, 19 were best-fitted with bulge and 12 with exponential profiles. For some EROs the difference in between the two models is very small – either they have intermediate profiles, and/or the signal/noise is insufficient for classification. Of those where one profile is favoured by , we classify 12 as bulges and 8 as disks.
(iii) A relatively small fraction of the EROs appear to be ongoing mergers – we find 2/31. A further 6 (4 bulge, 2 disk) have some visible asymmetry, most likely from recent interactions.
(iv) The profiles of 9/31 EROs, including the ‘cluster’ ERO, r608, were better fitted with the addition of central point-source components to the underlying disk or bulge galaxies, although higher resolution data will be needed to confirm this.
The EROs at appear to consist of about a 3:2 mixture of elliptical and spiral types, with about 1/4 showing evidence of ongoing or (more often) recent interactions. This is consistent with the findings of Moriondo et al. (2001) and Stiavelli and Treu (2001).
6.3 Angular Sizes of EROs
Figure 13 shows the best-fit half-light radii, , of the 31 (non-stellar) EROs against magnitude, compared to models based on the radii of local galaxies. The size-luminosity relation of local E/S0s can be represented by the double power-law relation of Binggeli, Sandage and Tarenghi (1984); for (with )
and for
An E/S0 galaxy with () at would, with the above size relation, have kpc. At , with the luminosity evolution of our passive model, it would have , and an angular of 0.48 arcsec. At it would appear fainter, but little different in size, arcsec. Figure 13 shows the whole – relation evolved to and 2.
![[Uncaptioned image]](/html/astro-ph/0205259/assets/x12.png)
![[Uncaptioned image]](/html/astro-ph/0205259/assets/x13.png)


The brightest of these EROs, r955, has too high a surface brightness for an elliptical at . As it is also only just red enough in to have been included, the most likely explanation is that it is at a much lower redshift. However, the other 18 bulge-type EROs all have sizes consistent with passively evolving E/S0 galaxies at . Most (12/19) are concentrated near the locus with only two (r525, r612) on the relation, as would be expected from the shape of (Figure 10).
Disk EROs are more likely to be dsfEROs, and hence their surface brightness may be increased or decreased by starbursting and/or dust. Cross and Driver (2002) determine a bivarate brightness function for 45000 disk galaxies in the 2dFGRS, which gives a mean effective surface brightness mag at ( for ), with a positive correlation between surface brightness and luminosity. Their best-fit relation corresponds to
with scatter . giving, for example kpc for , hence arcsec at . A galaxy (of any morphology) in which star-formation is truncated long before the epoch of observation will be undergoing approximately the passive (E/S0) model luminosity evolution, so with locally would have at .
Figure 13 shows the loci of this ‘passive disk’ model at and 2. Most (10/12) of the disk EROs lie below the locus, so if they are at their intrinsic SB is greater than this model (some very dusty galaxies may be included as EROs with redshifts as low as – see Figure 1). The two exceptions are the interacting r407, which lies on the locus, and the very large r660, which is of a lower SB than this model, suggesting it is strongly dust-reddened (see Section 7).
Using the PLE and M-DE models, we predict distributions for bulge and disk EROs. Figure 14 compares the of the bulge-type EROs in our sample and Moriondo et al. (2000) with the models. PLE predicts and arcsec for the bulge EROs, whweras with M-DE they are a factor 4.07 less numerous and have and arcsec. With the NE model, the EROs are just 4 per cent less fewwr than with M-DE, and havewith and arcsec For the 19 bulge EROs in our sample, arcsec, but the 16 of Moriondo et al. (2000) have arcsec (with most of the difference due to two very large cluster ellipticals). The combined sample would be reasonably consistent with the M-DE model, but apparently inconsistent with NE which overpredicts the sizes.

Figure 15 shows model for disk-type EROs, which adopt the spiral galaxy -band luminosity function. Again the evolving models assume passive luminosity evolution. As our models do not predict the fraction of disk EROs we have multiplied by arbitrary normalizations of 0.15 for PLE and 0.55 for M-DE and NE. These models are compared to histograms of the 12 disk-type EROs in our sample, and the three EROs from Moriondo et al. (2000) that were classed as disks.

The models predict arcsec for PLE, 0.76 arcsec for M-DE, and 0.90 arcsec for NE. In our sample the disk EROs have . Again the merging model is closest, although these disk EROs tend to be even more compact.
If this size discrepancy is significant, it could be the result of size evolution – there is some evidence that disk galaxies in general tend to be smaller in than local counterparts of similar mass (Roche et al. 1997, 1998; Giallongo et al. 2000). Roche et al. (1998) hypothesised that this resulted from ‘inside-outwards’ disk formation, with the star-formation becoming more centrally concentrated at higher redshifts. Disk evolution appears to be quite moderate ( dex) at , but could be sufficient for consistency with the M-DE model. It is also likely that many EROs classed as disks are actually disturbed, post-interaction galaxies which may be the process of transforming into bulge galaxies, and hence have become more centrally concentrated than normal spirals.
6.4 The EROs in a possible Cluster
In Section 3.3 we noted a possible grouping of EROs centered on the X-ray and radio luminous r608. There are 11 EROs within a 45 arcsec radius, of which 7 have – r552, r581, r608, r626, r629, r642, and r675, an overdensity compared to the 1.6 EROs expected by chance in this area. If the EROs in this area belong to a single cluster, they should trace an iso-redshift locus on the plot.

On Figure 17, the five bulge-type EROs lie neatly on the E/S0 locus, and the two disks are 0.1–0.2 dex below the disk model. If these disks have a similar size offset from this model as the distribution on Figure 16, these radii are entirely consistent with all 7 EROs belonging to a single, cluster. Of course, to confirm this will require spectroscopic redshifts (which we plan to obtain).
7 Radio, X-ray and sub-mm observations
The ELAIS N2 field has also been observed:
(i) At radio (1.4 GHz) frequencies using the VLA, reaching a threshold for source detection , with resolution 1.4 arcsec (see Ivison et al. 2002).
(ii) In X-rays using the Chandra satellite, for 75 ks in August 2000, reaching source detection limits – ergs with sub-arcsec resolution ( Manners et al. 2002).
(iii) At using SCUBA, reaching a source detection limit of mJy (Scott et al. 2002).
Here we discuss these observations for the UFTI EROs only. Seven of these 31 galaxies are detected at 1.4 GHz sources, only one as an X-ray source, and none in the sub-mm. Table 4 gives the fluxes of the detections.
| ERO | () | – | |
| peak | integral | ergs | |
| r256 | - | ||
| r518 | - | ||
| r552 | - | ||
| r608 | |||
| r642 | - | ||
| r660 | - | ||
| r952 | - | ||
In r256, r518, r552, r642 and r952, the radio emission is relatively weak and consistent with a point source, and the host galaxies appear to be regular ellipticals (the outer regions of r518 are mildly disturbed). The radio emission is stronger than would be expected for typical ellipticals ( at all ) and seems more likely to be produced by weak AGN, below the Chandra threshold, rather than powerful starbursts.
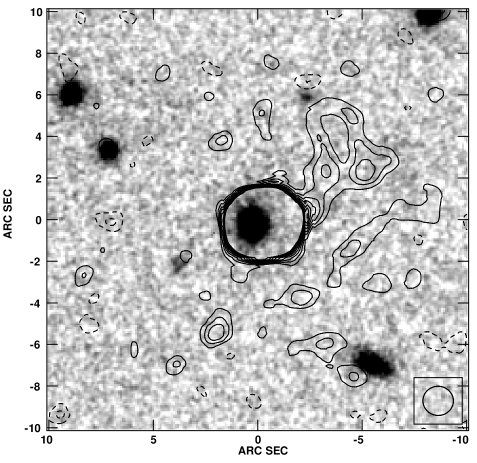
The galaxy r660, similar to these five in radio flux, differs in that (i) the radio emission is elongated, with major axis arscec on a position angle degrees, and ( Figure 18) aligned with the -band long axis, (ii) the galaxy is a large low-surface brightness disk. This suggests that the radio emission is produced by an extended dust-reddened starburst. With the Condon (1992) radio SED, the flux corresponds to a rest-frame luminosity () at of ergs . If is in the range bracketed by the Carilli (2000) and Condon (1992) relations, as in Roche et al. (2002), the total –– at , and r660 is a very powerful starburst galaxy, probably similar to local ULIRGs.
The non-detection of any of these 31 EROs in the SCUBA survey sets an upper limit on their SFR. Scott et al. (2002) estimate the detection limit of to correspond to a SFR , at all , for the Salpeter IMF, which for the IMF of our models becomes . Most of these bright EROs, including the double nucleus and disturbed galaxies, are not detected in the VLA data either, which sets stricter upper limits on SFRs, –– at . As most of the brightest EROs will be closer to , this implies that the average SFR of dsfEROs at these redshifts is less than . Nevertheless, a significant minority – e.g. r660, and the numerous examples of fainter EROs associated with SCUBA sources (Smail et al. 1999; Dey et al. 1999; Ivison et al. 2001; Lutz et al. 2001) – are real ULIRGs.
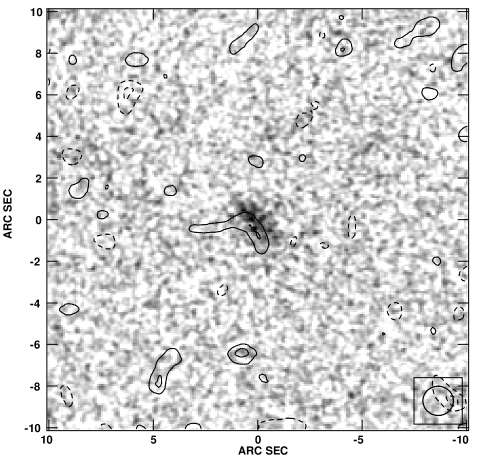
By far the strongest radio source in this sample, at 5mJy, is r608, the X-ray source and possible cluster central galaxy. The X-ray and VLA data (Figure 19) show most of the emission from a point-source concentric with the -band profile. The radio flux is far too strong to be attributed to star-formation (the non-detection with SCUBA limits the starburst contribution to per cent of this). If r623 is at , the rest-frame radio luminosity, ergs . This is 3 orders of magnitude above that of normal spirals but 3 orders below the most powerful radio galaxies. If we assume passive optical evolution and radio evolution for this galaxy then at it would have and ergs , or W , and its position on the radio-optical luminosity plane (Ledlow and Owen 1996) would then be typical of local FRI radio galaxies.
The X-ray flux, – ergs , corresponds at , assuming a spectrum, to – ergs , which could also be expressed in the form as ergs . From this, the radio to X-ray spectral index, , which is also consistent with an FRI radio galaxy (e.g. Capetti et al. 2002).
8 Summary and Discussion
8.1 Summary
(i) The number counts of EROs are significantly lower than expected if all local E/S0s evolved as in a PLE model, but are much higher than the predictions of CDM-based hierarchical merging models (Cimatti 2002b). We find (in agreement with Firth et al. 2002) that the ERO counts are consistent with completely non-evolving model for E/S0s. We can also fit the ERO counts with a physically plausible evolving model,‘M-DE’, in which both the characteristic mass and the comoving number density of passively evolving galaxies decrease with redshift. Physically this evolution could be accounted for by the continual formation of new passive ellipticals from the mergers and interactions of star-forming spirals.
Our best-fitting ‘M-DE’ model incorporates an observationally-estimated merger rate (Patton et al. 2001), with the negative density evolution parameterized by , meaning that only per cent of the present-day comoving number density of E/S0 galaxies formed at . This fraction is higher than the per cent estimated by Stiavalli and Treu (2001), because we have (a) included all types of ERO as possible E/S0 progenitors (b) included a reduction in mean mass galaxy and hence at high redshift, due to merging thus allowing a higher number density ()of passive galaxies. (ii) We examined the morphology of a bright () subsample of 32 EROs on the UFTI mosaic. One appeared to be a Galactic star, the other 31 a 3:2 mixture of elliptical and disk profile types. About 1/4 showed some evidence of asymmetry or disturbance, e.g from recent interactions, but only two were obvious mergers with double nuclei. This mixture of morphologies is consistent with the findings of Moriondo et al. (2001) and Stiavelli and Treu (2001) for similar samples of EROs.
By fitting radial profiles, we estimated seeing-corrected half-light radii. The of the bulge-type EROs were consistent with passively evolving E/S0 galaxies in the redshift range () predicted by the M-DE model. This is in agreement with Moriondo et al. (2000) who found the surface brightness–size relation of six bulge-type EROs at known redshifts of to be consistent with passively evolved ( mag) ellipticals.
Although both the M-DE and non-evolving models fit the ERO counts, these models give different angular size distributions, and our observed ERO radii are much more consistent with the smaller radii predicted by M-DE. This implies that, whatever the evolution, the surface brightness evolution of EROs is at least that predicted for passive evolution, and if the evolution is much weaker this must be the result of merging. The average of the disk-profile EROs is even smaller than the M-DE prediction and possible explanations include inside-outwards disk formation and/or morphological evolution. (iii) Radio observations with the VLA detect emission above the limit of for 7 of the 31 ERO galaxies with on the UFTI field. The strongest of these sources, at 5mJy, would be a radio galaxy, perhaps like local FRIs if these evolve as strongly as . The host galaxy is also a Chandra X-ray source and may be the central giant elliptical of a cluster of EROs. Of the other, much fainter (30–) detections, five are point sources within apparently regular galaxies, and may be weak AGN. The seventh, the galaxy r660, shows elongated radio emission aligned with the -band image. The galaxy is a large disk of lower surface brightness than the other bright EROs. These properties suggest it is a powerful but very dust-reddened starburst, with a SFR 100–1000 .
The non-detection of the other EROs, which include double-nucleus and disturbed objects, implies their SFRs are lower. This was interpreted as indicating the mean SFR of the dsfEROs to be . This is probably consistent with the Cimatti et al. (2002a) estimate of , based on the mean and UV fluxes of spectroscopically observed dsfEROs (see 8.2 below), after correcting for mag extinction. (iv) We investigated the angular correlation function of EROs on the UFTI and Ingrid fields. Positive clustering is detected at for the EROs to -20.0, with an estimated amplitude about an order of magnitude higher than that of all galaxies to the same mag limits. Our ERO clustering results are consistent with those of Daddi et al. (2000) and Firth et al. (2002), and using a combination of these, we estimate that the brighter () EROs have a comoving correlation radius –13 Mpc, depending on the strength of evolution. Statistical uncertainties remain large and it there is clearly a need for further ERO clustering analyses with both larger and deeper samples.
8.2 Discussion
8.2.1 Star-forming EROs
Cimatti et al. (2002a), using VLT spectroscopy, classified the spectra of about two-thirds of a sample of bright () EROs, and found approximately half ( per cent) to be dusty star-forming and half to be old ( Gyr) passive galaxies. The averaged spectrum of the dsfEROs showed [OII]3727 emission and Balmer absorption lines and closely resembled an e(a) type (Poggianti and Wu 2000) ‘very luminous infra-red galaxy’ with stellar reddening .
The VLA data indicate that only a small fraction of EROs can be ULIRGs, and furthermore the proportion of EROs which are ongoing mergers or very disturbed is considerably lower than 50 per cent, so some dsfEROs must have more regular bulge or intermediate profiles. This suggests that many of the dsfEROs are in late post-merger stages, with low and declining SFR and increasingly regular morphology. These galaxies may subsequently become E/S0s and contribute to the increase with time in the comoving number density of passive galaxies. The dsfEROs and pEROs would then be separate stages of an evolutionary sequence. At –2 we see the second (pERO) stage for the earliest formed ellipticals, contemporaneous with the dsfERO stage of those forming later, while deeper ERO surveys would reach the dusty starburst phase of the first massive ellipticals, at (i.e. the SCUBA sources).
On the basis of the Cimatti et al. (2002a) spectroscopy, dsfEROs would make up per cent of all galaxies and to this limit have a surface density . These high numbers imply the dsfERO phase is prolonged. For an order-of-magnitude estimate of the total dsfERO lifetime, , we assume that (i) each present-day E/S0 galaxy is associated with an average of one dsfERO ‘event’ at higher redshift, (ii) that the -band magnitudes of dsfEROs can be approximated by the passive model with merging (as they seem to be similar in surface brightness to the pEROs).
If were to last for the entire ‘ERO epoch’, , the dsfERO count could then be represented by the E/S0s in a model with merging mass evolution () but a comoving number density remaining at the present0day value (). This would be intermediate between the merging and M-DE models on Figure 6 and to gives 2.9 . The observed dsfERO count is lower, implying a shorter . As most EROs will be at , or lookback times in the period – Gyr, hence Gyr.
8.2.2 Clustering and evolution of the EROs
We estimate the intrinsic clustering of bright () EROs as – Mpc comoving, depending on the strength of evolution. This is even stronger than the clustering of present-day giant ellipticals, , and implies that if the –2 EROs evolve into the E/S0s, the increase in their comoving number density must involve the assimilation of less clustered types of galaxy into the class of passive galaxies, reducing the overall .
It may be significant that Abell galaxy clusters, with Mpc (Abadi, Lambas and Muriel 1998), and possibly SCUBA sources (Almaini et al. 2002), may be even more clustered than the –2 EROs. On the other hand, the Lyman break galaxies at are on the whole more moderately clustered, with a comoving – Mpc (Giavalisco and Dickinson 2001; Arnouts et al. 2002), which suggests they are mostly the progenitors of disk galaxies.
Daddi et al. (2002) found, on the basis of a small sample of redshifts, some evidence that the strong ERO clustering is associated with the pERO types only. They estimate Mpc for dsfEROs, and argue that this may be evidence against dsfEROs being E/S0 progenitors.
However, a large difference in pERO and dsfERO clustering would be expected if (i) the pEROs form at very dense mass concentrations in the early Universe, the ‘seeds’ of Abell clusters and SCUBA sources (and so have similar clustering), and (ii) the addition with time of dsfEROs (formed in mergers of the relatively weakly clustered disk galaxies) to the ERO class produces a continual dilution of the clustering – until, by , the passive galaxy is as observed for local E/S0s.
Secondly, IRAS () selected galaxies, which may be considered as low redshift counterparts of the dsfEROs, are weakly clustered ( Mpc), but nevertheless have many properties suggesting they are destined to evolve into E/S0s (Genzel et al. 2001).
Thirdly, many low-redshift E/S0 are observed to have have ‘boxy’ or ‘disky’ isophotes, and this may be ‘fossil’ evidence that they evolved from both types of ERO. The ’boxy’ ellipticals tend to be more massive and more confined to the centres of clusters, with slightly older stellar populations. The ’disky’ galaxies tend to have higher rotation velocities () but lower internal velocity dispersions (). These differences may result from the ‘disky’ ellipticals having formed at a relatively late epoch, when large spirals were already present – perhaps (at one extreme) from the merger of a single pair of spirals, which is likely impart a substantial angular momentum to the post-merger. At the other extreme, the oldest ellipticals might be formed through multiple mergers of very many small disks in the core of a proto-cluster, giving a summed angular momentum vector much closer to zero, and ‘boxy’ isophotes This latter process may have been observed in deep images of high- radio galaxies, which show massive ellipticals at but a large number of clustered sub-components at (van Breugel et al. 1999).
At –2, the progenitors of today’s ‘boxy’ and ‘disky’ E/S0s would then be, respectively, the pEROs and dsfEROs.
8.2.3 Future plans
We hope to investigate these scenarios further through
(i) Analysing the clustering and morphologies of of larger samples of EROs, with multi-colour imaging (e.g. , , , and ) to enable separation of the dsfEROs and pEROs, to fainter () limits. We now have some data for this. It may prove especially useful to compare the clustering properties of EROs and SCUBA sources.
(ii) High-resolution spectroscopy of a diverse sample of EROs, with the aim of not only determining the , but also of estimating properties such as current SFR, internal dust extinction, metallicity and kinematics, and applying new techniques of age-dating the stellar populations. From the velocities and , measurable from ground-based spectroscopy, on a – plot (Genzel et al. 2001), the ERO progenitors of ‘disky’ and ‘boxy’ ellipticals might be identified.
Acknowledgements
This paper is based on observations with the WHT and UKIRT. The William Herschel Telescope is operated on the island of La Palma by the Isaac Newton Group in the Observatorio del Roque de los Muchachos of the Instituto de Astrofisica de Canarias. The United Kingdom Infrared Telescope is operated by the Joint Astronomy Centre on behalf of the UK Particle Physics and Astronomy Research Council. NR acknowledges the support of a PPARC Research Associateship. OA acknowledges the support of a Royal Society Research Fellowship. JSD acknowledges the support of a PPARC Senior Fellowship. CJW and RJI thank PPARC for support.
References
- [1] Abadi M., Lambas D., Muriel H., 1998, ApJ, 507, 526.
- [2] Almaini O., et al., 2002, MNRAS, in press.
- [3] Arnouts S., et al., 2002, MNRAS, 329, 355.
- [4] Barger A., Cowie L., Trentham N., Fulton E., Hu E.M., Songaila A., Hall D., 1999, AJ, 117, 102.
- [5] Bertin E., Arnouts S. 1996, A&AS, 117, 393.
- [6] Cabanac A., de Lapparent V., Hickson P., 2000, A&A, 364, 349.
- [7] Capetti A., Celotti A., Chiaberge M., de Ruiter H.R., Fanti R., Morganti R., Parma, P, 2002, A&A, 383, 104.
- [8] Carilli C., Bertoldi F., Omont A., Cox P., McMahon R., Isaak K., 2001, AJ, 122, 1679.
- [9] Cimatti A., et al., 2002a, A&A, 381, 68.
- [10] Cimatti A., 2002b, ‘The Mass of Galaxies at Low and High Redshift’, proceeedings of ESO/USM workshop (astro-ph/0201050).
- [11] Condon J.J., 1992, A&A Ann. Rev., 30, 575.
- [12] Cross N., Driver S., 2002, MNRAS, 329, 579.
- [13] Daddi E., Cimatti A., Pozzetti L., Hoekstra H., Röttgering, H., Renzini A., Zamorani G., Mannucci F, 2000, A&A, 361, 535.
- [14] Daddi E., et al., 2002, A&A, 384, 1.
- [15] Dey A., Graham J., Ivison, R.J., Smail I., Wright G., Liu M., 1999, ApJ, 519, 610.
- [16] Dunlop J., Peacock J., Spinrad H., Dey A., Jimenez R., Stern D., Windhorst R., 1996, Nature, 381, 581.
- [17] Efstathiou G., Bernstein G., Katz N., Tyson J.A., Guhathakurta P., 1991, ApJ, 380, L47.
- [18] Elston R., Rieke M., Rieke G., 1988, ApJ, 331, L77.
- [19] Fioc M., Rocca-Volmerange B., 1997, A&A, 326, 950.
- [20] Firth A.E., et al., 2002, MNRAS, 332, 617.
- [21] Genzel R., Tacconi L., Rigopoulou D., Lutz D., Tecza M., 563, 527.
- [22] Giallongo E., Menci N., Poli F., D’Odorico S., Fontana A., 2000, ApJ, 530, L73.
- [23] Giavalisco M., Dickinson M., 2001, ApJ, 550, 177.
- [24] González-Solares E., et al., 2002, in prep.
- [25] Guzzo L., Strauss M., Fisher K., Giovanelli R., Haynes, M., 1997, ApJ, 489, 37.
- [26] Hu E.M., Ridgeway S.E., 1994, AJ, 107, 1303.
- [27] Ivison, R.J., Dunlop J.S., Smail I., Dey A., Liu M., Graham J., 2000, ApJ, 542, 27.
- [28] Ivison R.J., et al., 2002, MNRAS, in press.
- [29] Jimenez R., Friaca A. S., Dunlop J.S., Terlevich R., Peacock, J., Nolan L., 1999, MNRAS, 305, L16.
- [30] Kochanek C., et al., 2001, ApJ, 560, 566.
- [31] Kuemmel W., Wagner J., 2000, A&A, 353, 867.
- [32] Ledlow, M., Owen, F., 1996, AJ, 112, 9.
- [33] Lutz D, et al., 2001, A&A, 378, 70.
- [34] Manners J., et al., 2002, in prep.?
- [35] Mannucci F., Pozzetti L., Thompson D., Oliva E., Baffa C., Comoretto G., Gennari S., Lisi F., 2002, MNRAS, 329.
- [36] McCracken H., Shanks T., Metcalfe N., Fong R., Campos A., 2000, MNRAS, 318, 913.
- [37] Moustakas L., Davis M., Graham J., Silk J., Peterson B., Yoshii Y., ApJ, 475, 445.
- [38] Moriondo G., Cimatti A., Daddi E., 2000, A&A, 364, 26.
- [39] Oliver S., et al., 2000, 316, 749.
- [40] Patton D., et al., 2002, ApJ, 565, 208.
- [41] Poggianti B., Wu H., 2000, ApJ, 529, 157.
- [42] Pen Ue-Li, 1999, ApJS, 120, 49.
- [43] Roche N., Ratnatunga K., Griffiths R.E., Im M., 1997, MNRAS, 288, 200.
- [44] Roche N., Ratnatunga K., Griffiths R.E., Im M., Naim A., 1998, MNRAS, 293, 157.
- [45] Roche N., Eales S., 1999, MNRAS, 307, 703.
- [46] Roche N., Lowenthal J., Koo D., 2002, MNRAS, 330, 307.
- [47] Saracco P., Giallongo E., Cristiani S., D’Odorico S., Fontana A., Iovino A., Poli F., Vanzella E., 2001, A&A, 375, 2001.
- [48] Scott S., et al., 2002, MNRAS, 331, 817.
- [49] Smail I., Ivison R.J., Kneib J.-P., Cowie L., Blain A., Barger A., Owen F., Morrison G., MNRAS, 1999, 308, 1061.
- [50] Smith G., Treu T., Ellis R., Smail I., Kneib J.-P., Frye B., 2001, ApJ, 562, 635.
- [51] Smith G., et al., 2002, MNRAS, 330, 1.
- [52] Spinrad H., Dey A., Stern D., Dunlop J., Peacock J., Jimenez R., Windhorst R., 1997, ApJ, 484, 581.
- [53] Stanford S., Elston R., Eisenhardt P., Spinrad H., Stern, D., Dey A., 1997, AJ 114, 2232.
- [54] Stiavelli M., Treu T., 2001, ’Galaxy Disks and Disk Galaxies’, ASP Conf. Series., vol. 230, 603.
- [55] van Breugel W., Stanford S., Spinrad H., Stern D., Graham J., 1998, ApJ, 502, 614.