Spectroscopic study of blue compact galaxies
Blue compact galaxies are compact objects that are dominated by intense star formation. Most of them have dramatically different properties compared to the Milky Way and many other nearby galaxies. Using the IRAS, H i data, and optical spectra, we wanted to measure the current star formation rates, stellar components, metallicities, and star formation histories and evolution of a large blue compact galaxy sample. We anticipate that our study will be useful as a benchmark for studies of emission line galaxies at high redshift. In the first paper of this series, we describe the selection, spectroscopic observation, data reduction and calibration, and spectrophotometric accuracy of a sample of 97 luminous blue compact galaxies. We present a spectrophotometric atlas of rest-frame spectra, as well as tables of the recession velocities and the signal-to-noise ratios. The recession velocities of these galaxies are measured with an accuracy of V 67 km s-1. The average signal-to-noise ratio of sample spectra is 51. The spectral line strengths, equivalent widths and continuum fluxes are also measured for the same galaxies and will be analyzed in the next paper of this series. The atlas and tables of measurements will be made available electronically.
Key Words.:
atlases – galaxies: active – galaxies: evolution – galaxies: stellar content – techniques: spectroscopic1 Introduction
Blue compact galaxies (BCGs) have luminosities in the range mag to mag (Kunth & Östlin (2000)). Much work has been devoted to the study of BCGs, including image ( such as Kunth et al. (1988); Doublier et al. (1999); Cairós et al. (2001)), and spectra (such as Kunth & Sargent (1979); Terlevich et al. (1991); Kinney et al. (1993); Kunth et al. (1997)) observation in all wavelengths. These galaxies have an average surface brightness higher than 20 mag arcsec-2 (Gordon & Gottesman (1981)), and are characterized by their compact morphology and blue rest-frame colors (; Pisano et al. (2001)). Most of BCGs have a saturated region surrounded by no, or only small amounts of, nebulosity, and show no regular structures, such as spiral arms, but may display irregular features, such as jets, filaments, bridges, etc.(Gordon & Gottesman (1981)). BCGs were first observed spectroscopically by Sargent & Searle (1970). Their optical spectra show strong narrow emission lines superposed on an almost featureless continuum, similar to the spectrum of an H ii region. The least blue systems generally show both emission and absorption lines, while the bluest usually show only emission lines. The blue rest-frame colors and strong narrow emission line spectra indicate intense current star formation activity (Cairós et al. (2001)). Population synthesis models yield typical star formation rates between 1 and 20 yr-1 (Mas-Hesse & Kunth (1999); Östlin et al. (2001)).
Neutral hydrogen observations, in the 21-cm line, of BCGs have shown that BCGs are typically rich in H i gas, and there are indications that they have large H i halos (Thuan et al. (99); Pisano et al. (2001)). Another interesting property found among BCGs is that some of them have significant under-abundance of elements heavier than helium. The abundances of heavy elements in these galaxies range between and , and put them among the least chemically evolved galaxies in the universe. The two most metal-deficient galaxies known, I Zw 18 () and SBS 0335-052 () are BCGs (Doublier et al. (1999); Izotov & Thuan (1999)). These properties make BCGs represent an extreme environment for star formation, that differs from that in the Milky Way and in many other nearby galaxies. Detailed studies of these galaxies are not only important for understanding their intrinsic properties, but also crucial for understanding star formation processes, galaxy evolution and cosmological parameters (Kunth & Östlin (2000); Izotov et al. (2001)).
The Hubble Space Telescope and the new generation of 8 m class telescopes have extended our knowledge of the early Universe by identifying galaxies down to magnitudes B28 mag and redshifts z3. Studies of intermediate-redshift galaxies have revealed a population of compact, luminous galaxies with high star formation rates. Jangren et al. (2002) have compared several of the brighter objects of some intermediate-redshift samples and found that most of the galaxies have small sizes, high luminosities (hence high surface-brightness), and very blue colors, similar to the BCGs (Pisano et al. (2001)). Therefore, the more accessible nearby BCGs should help us better understand these distant objects.
Despite the extensive work carried out during the past decade, age and star formation histories of BCGs are not very constrained. With the advent of modern detectors, many BCGs ( 90%) have been found to contain an underlying old stellar population (Kunth & Östlin 2000, 2001). It suggests that most BCGs undergo a few or several short bursts of star formation followed by longer, more quiescent periods (Kong & Cheng (1999)). An important question is whether these BCGs are unique objects or not? Only a large spectral sample can help us answer this question. The data published so far are not sufficient to allow a systematic analysis of the star formation history of BCGs, because detailed and exhaustive studies have concentrated on particular type of BCGs, such as very metal-deficient galaxies.
Motivated by these facts, we have undertaken an extensive study of a large sample of BCGs, including the collction of IRAS, H i and optical spectroscopy data. Our ultimate goal is to perform a detailed analysis of these galaxies, focusing on the aspects of the various stellar components, the star formation rates, the metallicities (chemical abundances), the age of the underlying population, dust contents and star formation history.
In this paper, we present the blue compact galaxies sample, the optical spectroscopic observations and the method of reduction. The paper is organized as follows: in §2, we present the galaxy sample. In §3, we describe the spectral observations. The data reduction, and calibration are outlined in §4. The spectrophotometric atlas is presented in §5. In §6, we assess the data quality and spectrophotometric errors. Finally, some concluding remarks are given in §7. In the forthcoming papers of this series, we will study the constraints set by these observations on the physical properties of BCGs in our sample.
2 Description of the sample
BCGs are typically rich in H i gas. Many large H i surveys of BCGs were carried out, in particular by Gordon & Gottesman (1981), Thuan & Martin (1981), Thuan et al. (1999) and Smoker et al. (2000). Since we want to combine the optical spectra we obtain with HI data to constrain simultaneously the stars and gas contents of BCGs, we therefore select our sample on the basis of these surveys.
Considering the observatory site, instruments and possible observation times, we selected our sample according to the following criteria: (1) mag; (2) ; (3) mag. Using these criteria, 83 BCGs were selected. 14 additional ”dwarf”( mag) BCGs were also included because we want to compare their properties with those of ”luminous”( mag) BCGs. The final sample consists of 97 BCGs. We emphasize that there is no guarantee that our sample has any statistical completeness.
Most (92/97) of the galaxies in our sample come from Gordon & Gottesman (1981). These authors assembled a list of 99 blue compact galaxies from the Markarian, Haro and Zwicky lists. The H i observations were made using the 91-m transit radio telescope of the National Radio Astronomy Observatory and the 305-m spherical radio telescope of the Arecibo Observatory. Three other galaxies in our sample come from Kinney et al. (1993). One galaxy comes from Thuan & Martin (1981); these authors assembled a list of 115 blue compact dwarf galaxies (BCDs, mag) known at that time from the objective prism surveys of Markarian and Haro, with a few objects from Zwicky and other investigators (we are presently observing most of these BCDs and will present our results in the future). Finally, one galaxy in our sample comes from Thuan et al. (1999).
| Galaxy | R.A.(2000) | Decl(2000) | m | Dist. | M | E(B-V)G | Other |
|---|---|---|---|---|---|---|---|
| Name | (h-m-s) | (d-m-s) | (mag) | (Mpc) | (mag) | Name | |
| Mrk335 | 00:06:19.5 | +20:12:10 | 13.72 | 102.0 | -21.3 | 0.035 | PGC473 |
| IIIZw12 | 00:47:56.5 | +22:22:23 | 14.58 | 80.0 | -19.9 | 0.045 | Mrk347 |
| Haro15 | 00:48:35.4 | -12:42:59 | 13.48 | 86.0 | -21.2 | 0.023 | Mrk960 |
| Mrk352 | 00:59:53.3 | +31:49:37 | 14.24 | 62.0 | -19.7 | 0.061 | PGC3575 |
| Mrk1 | 01:16:07.2 | +33:05:22 | 14.69 | 67.0 | -19.4 | 0.060 | NGC449 |
| IIIZw33 | 01:43:56.5 | +17:03:43 | 14.56 | 109.0 | -20.6 | 0.068 | Mrk360 |
| VZw155 | 01:57:49.4 | +27:51:56 | 15.00 | 111.0 | -20.2 | 0.082 | Mrk364 |
| IIIZw42 | 02:11:33.5 | +13:55:02 | 14.51 | 107.0 | -20.6 | 0.088 | Mrk366 |
| IIIZw43 | 02:13:45.0 | +04:06:07 | 14.05 | 47.0 | -19.3 | 0.042 | Mrk589 |
| VZw372 | 04:13:56.0 | +29:09:28 | 15.19R | 74.0 | -19.2 | 0.709 | UGC2989 |
| IIZw18 | 04:38:39.7 | +11:14:28 | 16.41R | 59.0 | -17.4 | 0.391 | PGC15715 |
| IIZw23 | 04:49:44.4 | +03:20:03 | 13.88 | 110.0 | -21.3 | 0.063 | Mrk1087 |
| IIZw28 | 05:01:42.0 | +03:34:28 | 14.94 | 113.0 | -20.3 | 0.060 | VV790B |
| IIZw33 | 05:10:48.1 | -02:40:54 | 13.48 | 36.0 | -19.3 | 0.102 | Mrk1094 |
| IIZw35 | 05:16:59.3 | +00:55:20 | 16.90N | 95.0 | -18.0 | 0.140 | PGC17037 |
| IIZw40 | 05:55:42.8 | +03:23:30 | 14.22 | 9.0 | -15.6 | 0.820 | UGCA116 |
| IIZw42 | 06:03:11.4 | +07:49:37 | 15.37 | 69.0 | -18.8 | 0.417 | UGC3393 |
| Mrk5 | 06:42:15.5 | +75:37:33 | 15.12 | 13.3 | -15.5 | 0.084 | UGCA130 |
| Mrk6 | 06:52:12.2 | +74:25:37 | 13.86 | 76.0 | -20.5 | 0.136 | UGC3547 |
| VIIZw153 | 07:28:12.0 | +72:34:29 | 13.40 | 43.0 | -19.8 | 0.030 | Mrk7 |
| VIIZw156 | 07:29:25.4 | +72:07:44 | 13.17 | 50.0 | -20.3 | 0.026 | Mrk8 |
| Haro1 | 07:36:56.4 | +35:14:31 | 12.39 | 50.0 | -21.1 | 0.043 | NGC2415 |
| Mrk385 | 08:03:28.0 | +25:06:10 | 14.57 | 110.0 | -20.6 | 0.030 | PGC22615 |
| Mrk622 | 08:07:41.0 | +39:00:15 | 14.33 | 94.0 | -20.5 | 0.051 | UGC4229 |
| Mrk390 | 08:35:33.1 | +30:32:03 | 14.58 | 101.0 | -20.4 | 0.041 | PGC24127 |
| Zw0855 | 08:58:27.4 | +06:19:41 | 14.50 | 47.0 | -18.9 | 0.069 | UGC4703 |
| Mrk105 | 09:20:26.3 | +71:24:16 | 15.88 | 49.0 | -17.6 | 0.066 | PGC26416 |
| IZw18 | 09:34:02.0 | +55:14:28 | 15.80 | 10.9 | -14.4 | 0.032 | Mrk116 |
| Mrk402 | 09:35:19.2 | +30:24:31 | 15.66R | 98.0 | -19.3 | 0.020 | PGC27258 |
| IZw21 | 09:46:28.6 | +45:45:09 | 14.59 | 67.0 | -19.5 | 0.015 | UGC5225 |
| Haro22 | 09:50:11.0 | +28:00:47 | 14.94 | 18.4 | -16.4 | 0.025 | PGC28305 |
| Haro23 | 10:06:18.1 | +28:56:40 | 14.33 | 17.5 | -16.9 | 0.024 | UGCA201 |
| IIZw44 | 10:15:14.7 | +21:06:34 | 15.75 | 81.0 | -18.8 | 0.023 | PGC29934 |
| Haro2 | 10:32:31.9 | +54:24:03 | 13.15 | 21.0 | -18.5 | 0.012 | Mrk33 |
| Mrk148 | 10:35:34.8 | +44:18:57 | 14.65R | 96.0 | -20.3 | 0.019 | UGC5747 |
| Haro3 | 10:45:22.4 | +55:57:37 | 12.81 | 13.6 | -17.9 | 0.007 | Mrk35 |
| Haro25 | 10:48:44.2 | +26:03:12 | 15.52 | 101.0 | -19.5 | 0.033 | Mrk727 |
| Mrk1267 | 10:53:03.9 | +04:37:54 | 14.48 | 77.8 | -20.0 | 0.034 | Ark264r1 |
| Haro4 | 11:04:58.5 | +29:08:22 | 15.51 | 7.9 | -14.0 | 0.030 | Mrk36 |
| IZw26 | 11:25:36.2 | +54:22:57 | 16.80 | 83.0 | -17.8 | 0.014 | Mrk40 |
| Mrk169 | 11:26:44.4 | +59:09:20 | 13.95 | 17.5 | -17.3 | 0.014 | UGC6447 |
| Haro27 | 11:40:24.8 | +28:22:26 | 14.13 | 24.0 | -17.8 | 0.022 | Mrk1507 |
| Mrk198 | 12:09:14.1 | +47:03:30 | 14.56 | 97.0 | -20.4 | 0.017 | PGC38613 |
| IIZw57 | 12:09:32.9 | +17:00:51 | 13.60 | 88.0 | -21.1 | 0.036 | PGC38634 |
| Mrk201 | 12:14:09.7 | +54:31:38 | 12.86 | 35.0 | -19.9 | 0.015 | IZw33r1 |
| Haro28 | 12:15:46.1 | +48:07:54 | 13.21 | 10.6 | -16.9 | 0.016 | NGC4218 |
| Haro8 | 12:19:09.9 | +03:51:21 | 14.49 | 18.6 | -16.9 | 0.017 | Mrk49 |
| Mrk50 | 12:23:24.1 | +02:40:45 | 14.89R | 92.0 | -19.9 | 0.016 | PGC40220 |
| Haro29 | 12:26:16.0 | +48:29:37 | 14.24 | 4.8 | -14.2 | 0.015 | IZw36 |
| Galaxy | R.A.(2000) | Decl(2000) | m | Dist. | M | E(B-V)G | Other |
|---|---|---|---|---|---|---|---|
| Name | (h-m-s) | (d-m-s) | (mag) | (Mpc) | (mag) | Name | |
| Mrk213 | 12:31:22.2 | +57:57:52 | 13.03R | 41.7 | -20.1 | 0.012 | NGC4500r1 |
| Mrk215 | 12:32:34.7 | +45:46:04 | 14.47 | 79.0 | -20.0 | 0.017 | PGC41591 |
| Haro32 | 12:43:48.6 | +54:54:02 | 13.70 | 67.0 | -20.4 | 0.016 | IZw41 |
| Haro33 | 12:44:38.3 | +28:28:19 | 14.39 | 12.5 | -16.1 | 0.016 | UGCA294 |
| Haro34 | 12:45:06.6 | +21:10:10 | 14.86 | 93.0 | -20.0 | 0.041 | Ark386 |
| Haro36 | 12:46:56.4 | +51:36:46 | 14.67 | 8.0 | -14.8 | 0.015 | UGC7950 |
| Haro35 | 12:47:08.5 | +27:47:35 | 15.89R | 99.0 | -19.1 | 0.013 | PGC43139 |
| Haro37 | 12:48:41.0 | +34:28:39 | 15.18 | 57.0 | -18.6 | 0.014 | Mrk444 |
| IIIZw68 | 12:58:02.4 | +26:51:34 | 14.34 | 76.0 | -20.1 | 0.009 | UGC8080 |
| IIZw67 | 12:58:35.2 | +27:35:47 | 13.69 | 101.0 | -21.3 | 0.010 | NGC4853 |
| Mrk57 | 12:58:37.2 | +27:10:34 | 15.08 | 102.0 | -20.0 | 0.014 | PGC44486r2 |
| Mrk235 | 13:00:02.1 | +33:26:15 | 15.07 | 100.0 | -19.9 | 0.012 | PGC44694 |
| Mrk241 | 13:06:19.8 | +32:58:25 | 15.87 | 105.0 | -19.2 | 0.014 | PGC45363 |
| IZw53 | 13:13:57.7 | +35:18:55 | 15.00R | 69.0 | -19.2 | 0.011 | PGC45993 |
| IZw56 | 13:20:35.3 | +34:08:22 | 14.10 | 93.0 | -20.7 | 0.013 | UGC8387 |
| Haro38 | 13:35:35.6 | +29:13:01 | 14.87 | 11.9 | -15.5 | 0.012 | UGC8578 |
| Mrk270 | 13:41:05.7 | +67:40:20 | 13.61 | 38.0 | -19.3 | 0.020 | NGC5283 |
| Mrk275 | 13:48:40.5 | +31:27:39 | 14.52 | 106.0 | -20.6 | 0.019 | PGC48992 |
| Haro39 | 13:58:23.8 | +25:33:00 | 14.49 | 35.0 | -18.2 | 0.016 | PGC49732 |
| Haro42 | 14:31:09.0 | +27:14:14 | 14.74 | 60.0 | -19.2 | 0.015 | Mrk685 |
| Haro43 | 14:36:08.8 | +28:26:59 | 15.08 | 27.0 | -17.1 | 0.020 | PGC52193 |
| Haro44 | 14:43:24.7 | +28:18:04 | 16.05R | 51.0 | -17.5 | 0.017 | PGC52587 |
| IIZw70 | 14:50:56.5 | +35:34:18 | 14.04 | 18.0 | -17.2 | 0.012 | Mrk829 |
| IIZw71 | 14:51:14.4 | +35:32:31 | 13.34 | 18.0 | -17.9 | 0.013 | PGC53039 |
| IZw97 | 14:54:39.2 | +42:01:26 | 14.47 | 36.0 | -18.3 | 0.020 | PGC53299 |
| IZw98 | 14:55:15.6 | +42:30:25 | 13.91 | 75.0 | -20.5 | 0.019 | NGC5787 |
| IZw101 | 15:03:45.8 | +42:41:59 | 15.19 | 68.0 | -19.0 | 0.019 | Ark467 |
| IZw117 | 15:35:53.6 | +38:40:37 | 14.15 | 77.0 | -20.3 | 0.017 | UGC9922 |
| IZw123 | 15:37:04.2 | +55:15:48 | 15.44 | 11.6 | -14.9 | 0.014 | Mrk487 |
| VIIZw631 | 15:59:11.9 | +20:45:31 | 12.98 | 62.0 | -21.0 | 0.055 | NGC6027 |
| Mrk297 | 16:05:12.9 | +20:32:32 | 12.98 | 65.0 | -21.1 | 0.076 | NGC6052 |
| IZw147 | 16:23:12.0 | +54:08:36 | 15.80R | 75.0 | -18.6 | 0.009 | PGC57975 |
| IZw159 | 16:35:21.1 | +52:12:53 | 15.70 | 38.0 | -17.2 | 0.029 | Mrk1499 |
| IZw166 | 16:48:24.1 | +48:42:33 | 15.03 | 106.0 | -20.1 | 0.016 | Mrk499 |
| Mrk893 | 17:15:02.2 | +60:12:59 | 16.34 | 83.7 | -18.3 | 0.021 | 1714+602r3 |
| IZw191 | 17:40:24.8 | +47:43:59 | 14.70R | 81.0 | -19.8 | 0.019 | PGC60671 |
| IZw199 | 17:50:05.1 | +56:40:27 | 14.82 | 74.0 | -19.5 | 0.048 | PGC60950 |
| IZw207 | 18:31:10.4 | +55:16:32 | 15.31R | 79.0 | -19.2 | 0.042 | PGC61982 |
| IIZw82 | 20:23:15.6 | +00:39:52 | 13.46 | 56.0 | -20.3 | 0.191 | UGC11546 |
| IVZw67 | 21:02:18.8 | +36:41:44 | 14.00N | 38.0 | -18.9 | 0.280 | UGC11668 |
| IIZw172 | 22:14:45.9 | +13:50:37 | 13.23 | 108.0 | -21.9 | 0.065 | NGC7237 |
| IVZw93 | 22:16:07.7 | +22:56:33 | 15.44R | 55.0 | -18.3 | 0.069 | PGC68454 |
| Mrk303 | 22:16:26.8 | +16:28:17 | 14.62 | 104.0 | -20.5 | 0.051 | NGC7244 |
| Zw2220 | 22:23:02.0 | +30:55:29 | 13.52 | 93.0 | -21.3 | 0.078 | UGC12011 |
| Mrk314 | 23:02:59.2 | +16:36:19 | 13.45 | 31.0 | -19.0 | 0.085 | Mrk314 |
| IVZw142 | 23:20:03.1 | +26:12:58 | 14.89 | 109.0 | -20.3 | 0.086 | Mrk322 |
| IVZw149 | 23:27:41.2 | +23:35:21 | 12.66 | 80.0 | -21.9 | 0.043 | Mrk325 |
| Zw2335 | 23:37:39.6 | +30:07:47 | 15.37 | 22.0 | -16.3 | 0.093 | Mrk328 |
r1: Kinney et al. (1993); r2: Thuan & Martin (1981);
r3: Thuan et al. (1999);
The other BCGs were selected from Gordon & Gottesman (1981)
In total our sample contains 97 blue compact galaxies, the general parameters of which are listed in Table 1. Column (1) lists the galaxy name following Haro (Haro (1956)), Markarian (Mrk, Markarian et al. (1989)), and Zwicky (Zw, Zwicky (1971)). Columns (2) and (3) list the right ascension and declination at epoch 2000, taken from NED 111The NASA/IPAC Extragalactic Database (NED) is operated by the Jet Propulsion Laboratory, California Institute of Technology, under contract with the National Aeronautics and Space Administration.. Column (4) lists the apparent blue magnitude () corrected for instrumental effects, extinction, inclination, and doppler velocity. Most magnitudes were taken from Gordon & Gottesman (1981). The other galaxies were corrected for instrumental effects, extinction, inclination based on de Vaucouleurs et al. (1991, RC3) and NED, as indicated by ”R”, ”N”. Column (5) lists the distance (D) to the galaxy, in megaparsecs, assuming a Hubble constant of =75 km s-1 Mpc-1 and . Column (6) lists the absolute blue magnitude (,), derived from Column (4) and Column (5) with . Column (7) lists the Galactic foreground reddening, E(B-V). The last column (8) lists other commonly used designations for the galaxies.
The spatial distribution of the 97 sample galaxies on the sky is show in Fig. 1. The absolute blue magnitude () distribution of the 97 sample galaxies is presented in Fig. 2.


3 Spectroscopic observations
Two-dimensional (long-slit) spectra were obtained using the OMR (Optomechanics Research Inc.) spectrograph mounted at the Cassegrain focus of the 2.16 m telescope at the XingLong Station of the Beijing Astronomical Observatory (BAO) in China, which also belongs to the National Astronomical Observatories, Chinese Academy of Sciences. The data were acquired during 26 predominantly moonless nights between March 1997 and January 2002. The vast majority of the observations were obtained during transparent or photometric conditions, the remainder through thin clouds.
The OMR spectrograph was equipped with a TEKTRONIX TEK1024, AR coated back illuminated CCD with 1024 1024, 24 m pixels. A 300 line mm-1 grating blazed at 5500 Å in first order was used, giving a dispersion of 4.8 Å pixel-1 and a total spectral coverage of 4500 Å. According to the condition of seeing, we adjusted the slit width in between 2′′ and 3′′ on each night and used the selected configuration for all target spectra. Our spectra were centered on 5500 Å or 6000 Å (see Table 2), at a resolution (FWHM) of 10 Å, thus covering many interesting spectral features ranging from [O ii]3727 in the blue to [S ii]6731 in the red.
The slit was generally placed across the nucleus of each galaxy. In some cases where the location of the nucleus was not obvious, the slit was aligned to intersect the brightest part of the galaxy in order to maximize the chance of detecting the nucleus. Otherwise, the spectrograph was rotated about the optical axis of the telescope as required to keep the slit approximately perpendicular to the horizon, to minimize loss of light due to differential atmospheric refraction (e.g., Filippenko (1982)).
Dome flats, illuminated by a hot, spectroscopically featureless arc lamp, were taken at the beginning and end of each night. He-Ar or Fe-Ar (before 1998, see Column 6 of Table 2) lamps were observed immediately after observing each target object at the same position as the object for wavelength calibration.
Two or more of the KPNO spectrophotometric standards from Massey et al. (1988), such as G191B2B, Hiltner 600, Feige 34, HZ 44, BD +28∘4211, were observed each night for absolute photometric calibration. In good conditions, a standard was observed about every 3 or 4 hours.
Table 2 lists the observations log and instrumental parameters for each run. Column (1) lists the observation run number, Column (2) the observation period, and Column (3) the number of nights actually observed, i. e. that were not lost because of poor weather conditions. Column (4) lists the centering wavelength used for each run. Columns (5) – (8) list the slit width, the arc lamp used, the number of spectral obtained, and the standard stars for each run. The individual integration times in each of the observations varied from 1200 seconds to about an hour, depending on the magnitude of the object and the seeing. For 39 objects, observations were performed twice in order to get a higher signal-to-noise ratio spectrum, so that we have observed a total 136 BCGs spectra. 107 of the total 136 spectra were observed at airmass less than 1.2, only 4 spectra were observed at airmass larger than 1.5. Table 3 lists these observation parameters. Column (1) lists the object name, while Columns (2) – (4) and (5) – (7) list the observation date, exposure time, and airmass.
| Obs. | Observation date | Number | cw. | slit | arc | Spec. | Standard stars |
|---|---|---|---|---|---|---|---|
| No. | of nights | (Å) | (′′) | lamp | num. | ||
| 1 | 2002 Jan 08 – Jan 12 | 5 | 5500 | 2.5 | He/Ar | 20 | G191B2B Hilt600 Feige56 Feige25 HZ44 |
| 2 | 2001 Oct 12 | 1 | 5500 | 2.5 | He/Ar | 4 | Hilt600 HD192281 G191B2B BD174708 |
| 3 | 2001 Feb 24 – Mar 01 | 4 | 5500 | 2.5 | He/Ar | 33 | G191B2B Feige34 BD332642 HZ44 |
| 4 | 2000 Apr 29 – May 01 | 3 | 6000 | 2.3 | He/Ar | 24 | Feige34 BD332642 HZ44 |
| 5 | 2000 Feb 25 | 1 | 6000 | 2.2 | He/Ar | 4 | Hilt600 Feige34 |
| 6 | 2000 Jan 01 – Jan 02 | 2 | 5500 | 3.0 | He/Ar | 17 | G191B2B Hilt600 Feige34 |
| 7 | 1999 Aug 03 – Aug 09 | 2 | 5500 | 2.0 | He/Ar | 4 | BD284211 HD192281 |
| 8 | 1998 Aug 14 – Aug 20 | 4 | 5500 | 2.5 | He/Ar | 15 | BD284211 Kopff27 Feige15 BD332642 |
| 9 | 1998 Feb 17 | 1 | 5500 | 2.0 | He/Ar | 2 | Hilt600 Feige98 |
| 10 | 1997 Mar 18 – Mar 20 | 3 | 6000 | 2.0 | Fe/Ar | 13 | Feige34 Feige98 Sa29130 |
4 Data reduction
The spectroscopic reductions were made using the Image Reduction Analysis Facility (IRAF)111IRAF is distributed by the National Optical Astronomy Observatories, which are operated by the Association of Universities for Research in Astronomy, Inc., under cooperative agreement with the National Science Foundation. packages CCDRED, TWODSPEC and ONEDSPEC. For each night of data, the following steps were performed: (a) interpolation over bad columns, dead and hot pixels; (b) bias subtraction; (c) division of each frame by a flat-field exposure to remove multiplicative gain and illumination variations across the chip; (d) extraction of one dimensional spectra for each observation from the two-dimensional image by summing the pixels within the aperture at each point along the dispersion axis and subtracting out the sky background; (e) wavelength calibration and subsequent resampling of the data on a linear wavelength grid; (f) flux calibration of the extracted spectra, using flux standard stars from the KPNO standards sample; (g) correction for extinction using a standard atmospheric extinction law.
4.1 Basic reductions
Pixel-to-pixel variations in the response were removed through division by appropriately normalized exposures of the dome illuminated by a hot, spectroscopically featureless lamp. The dark counts were so low that their subtraction was not performed. Cosmic ray events in each input image were detected and replaced by the average of the four neighbors with the IRAF task cosmicrays. The remaining cosmic ray hits were flagged manually and were subsequently removed by interpolation.
We extracted the spectra using objectively defined apertures. The peak of the galaxy light distribution was used to trace the extraction aperture. For the object spectra, we used a fixed aperture, 6 pixels along the slit centered on the brightest pixel in the portion of the spectrum between 5300–5600Å. The background sky level was determined from areas as close to the nucleus as possible, taking care not to include the contribution from extended emission near the nucleus. One-dimensional spectra of the standard stars were extracted in exactly the same manner as for the galaxy spectra, using an effective slit length to contain all the stellar light.
Wavelength calibration was carried out by fitting a cubic spline to unblended emission lines of He, Ar, and Fe in the comparison lamp spectra. These spectra were also used to measure the spectral resolution as a function of position on the CCDs. More than 20 lines were used to establish the wavelength scale. Typical rms residuals in the cubic spline fits were 0.3 Å. The accuracy of the wavelength calibration was better than 1.5 Å.
The extracted spectra were flux calibrated on a relative flux scale using more than two KPNO standard stars. Cubic spline sensitivity functions of ninth order were fit interactively for each of the standard star observations. The sensitivity function relates the measured intensity to the (calibrated) flux density (in ergs scmÅ-1) as a function of wavelength, after removing atmospheric extinction.
Atmospheric extinction was corrected using the mean extinction coefficients for the Xinglong station (BAO), that were measured in the Beijing-Arizona-Taiwan-Connecticut (BATC) multi-color survey (Kong et al. (2000)). There is little error introduced by this procedure, since the observations were restricted to small air masses, usually less than 1.2 and always less than 1.7.
The telluric O2 absorption lines near 6280 and 6860Å (the ”B band”) were removed through division by normalized, intrinsically featureless spectra of the standard stars. Large residuals caused by mismatches at the sharp, deep band were not removed.
4.2 Additional reductions
To measure the rest-frame spectral line properties of the galaxies, we first measured the recession velocity of each galaxy by averaging the recession velocities, of different lines, where is the rest-frame wavelength of the line.
For galaxies with emission lines, recession velocities were determined from the average of five measurable emission lines, [O ii]3727, H4861, [O iii]4959, [O iii]5007, H6563. For those objects without emission lines, velocities were obtained from the average of 5 measurable absorption lines, Ca K3935, H4101, G band4306, Mg i+Mg h5177 and Na i5896. For the galaxy, IVZw 67, that has neither strong emission nor absorption lines, we adopted the redshift listed by NED. The accuracy of the recession velocities in our sample ranges from very good (3 – 55 km s-1 uncertainties) when the galaxy has strong emission lines, to relatively poor (7 – 67 km s-1 uncertainties) when the galaxy has only absorption lines. The recession velocity distribution for all the sample galaxies with spectroscopic observations from this study are presented in Figure 3. All galaxies in the sample have velocities below 9000 km s-1. On the basis of these recession velocities , the calibrated spectra were shifted to rest-frame wavelengths. Column (8) – (9) of Table 3 list the galaxy recession velocities in km s-1, the uncertainty of the recession velocity.

The foreground reddening cause by our Galaxy was corrected using the values in Column (7) of Table 1. The wavelength dependence of the extinction was assumed to follow the empirical selective extinction function of Cardelli et al. (1989), with .
The rest frame spectra were normalized to the average flux in a 50Å interval centered at 5500Å and subsequently resampled on a uniform wavelength grid spanning the range 3580–7400Å.
For each galaxy, multiple exposures taken with the same setting, sometimes over several epochs, were combined in a weighted average, with the weights determined by the signal-to-noise ratios.
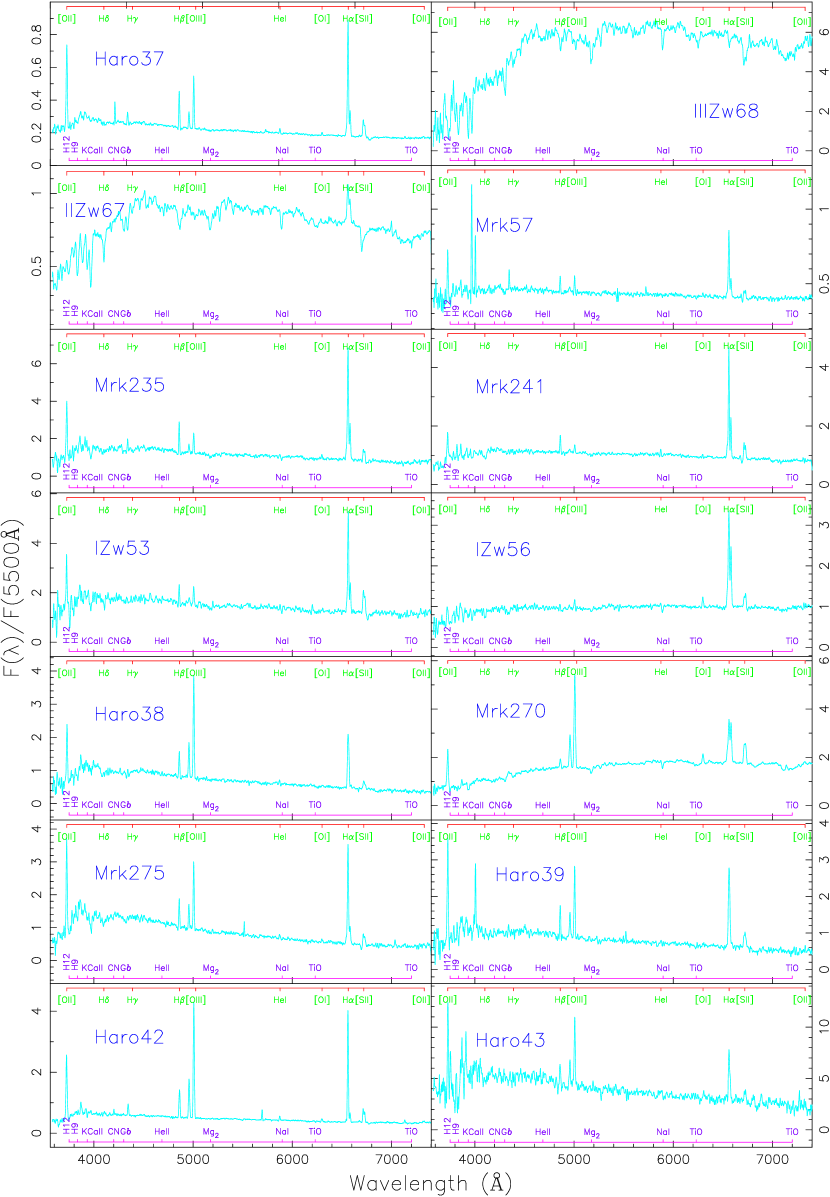
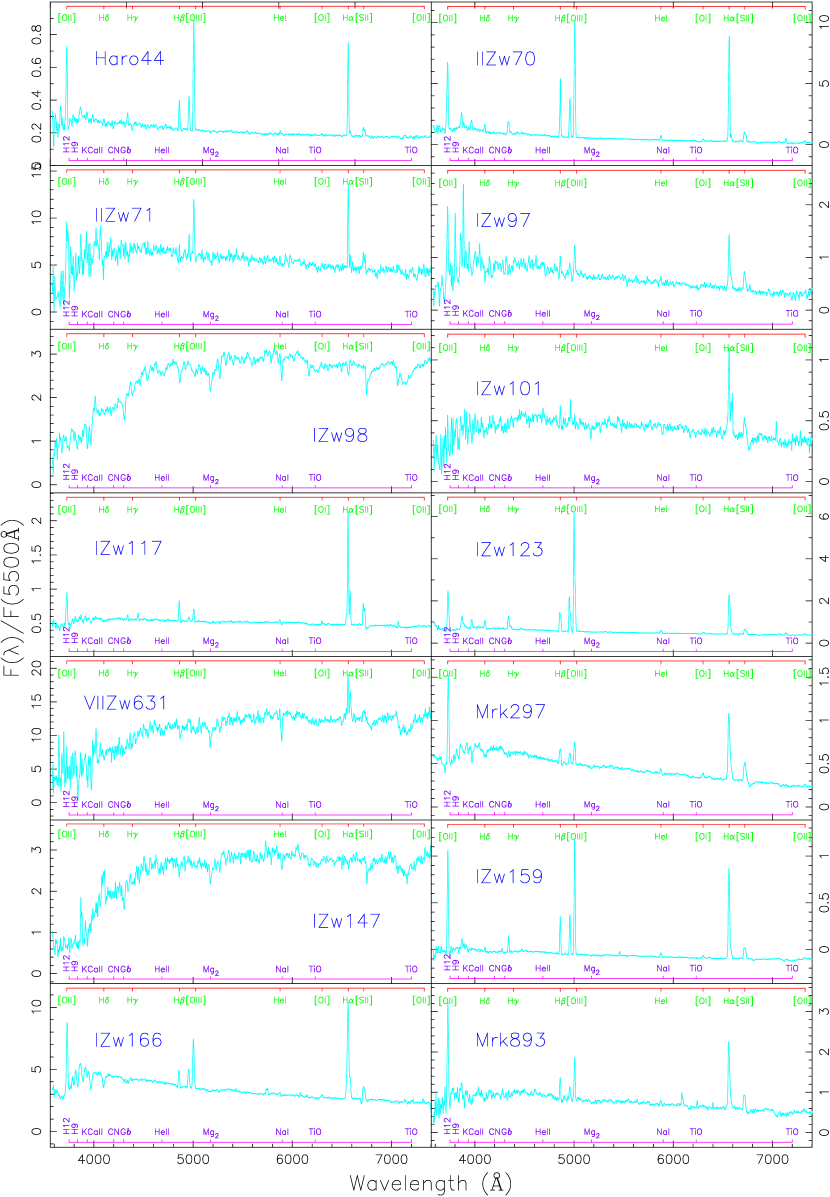
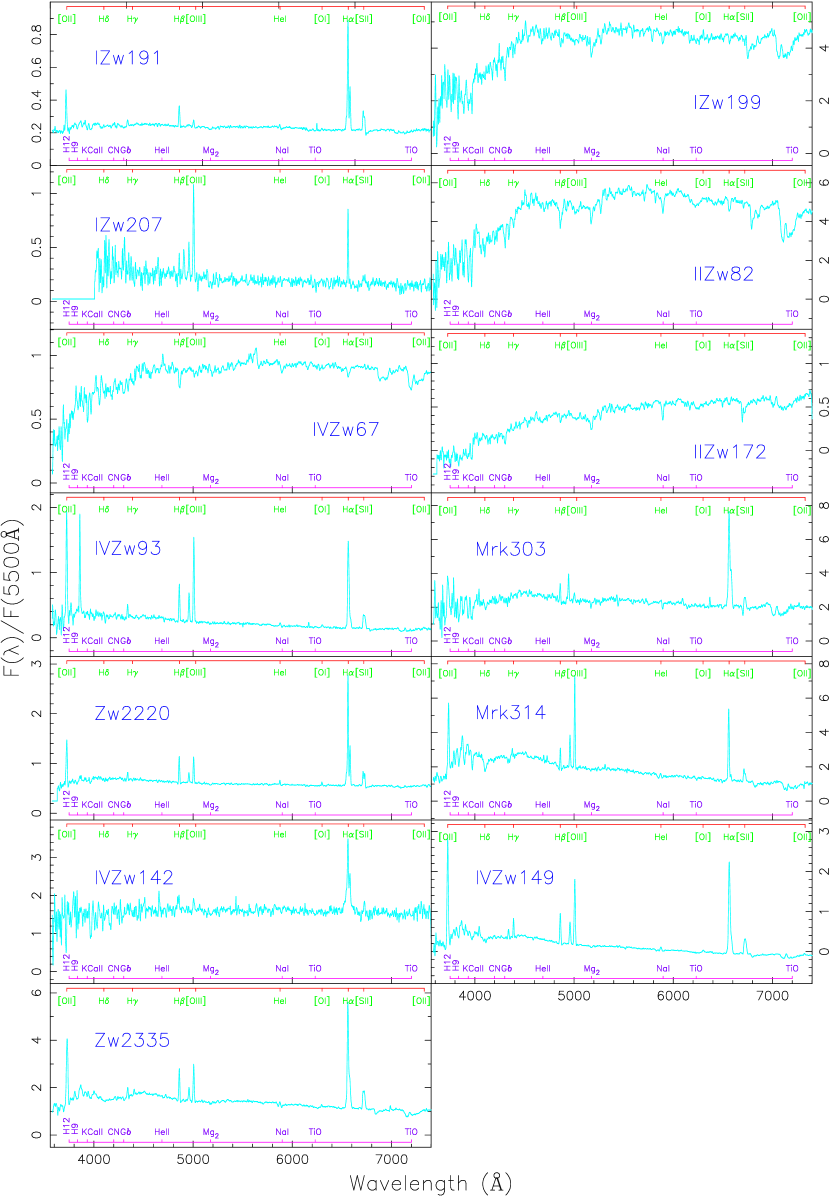
5 The spectral atlas
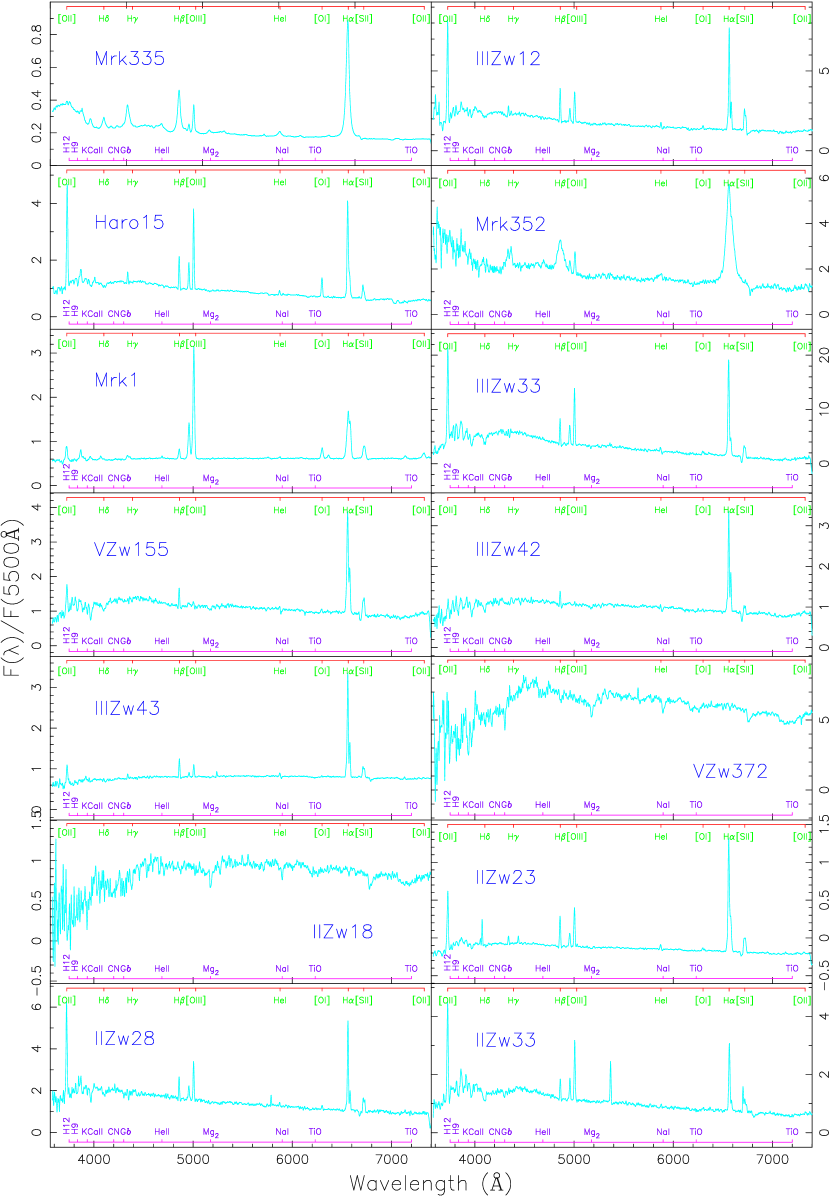
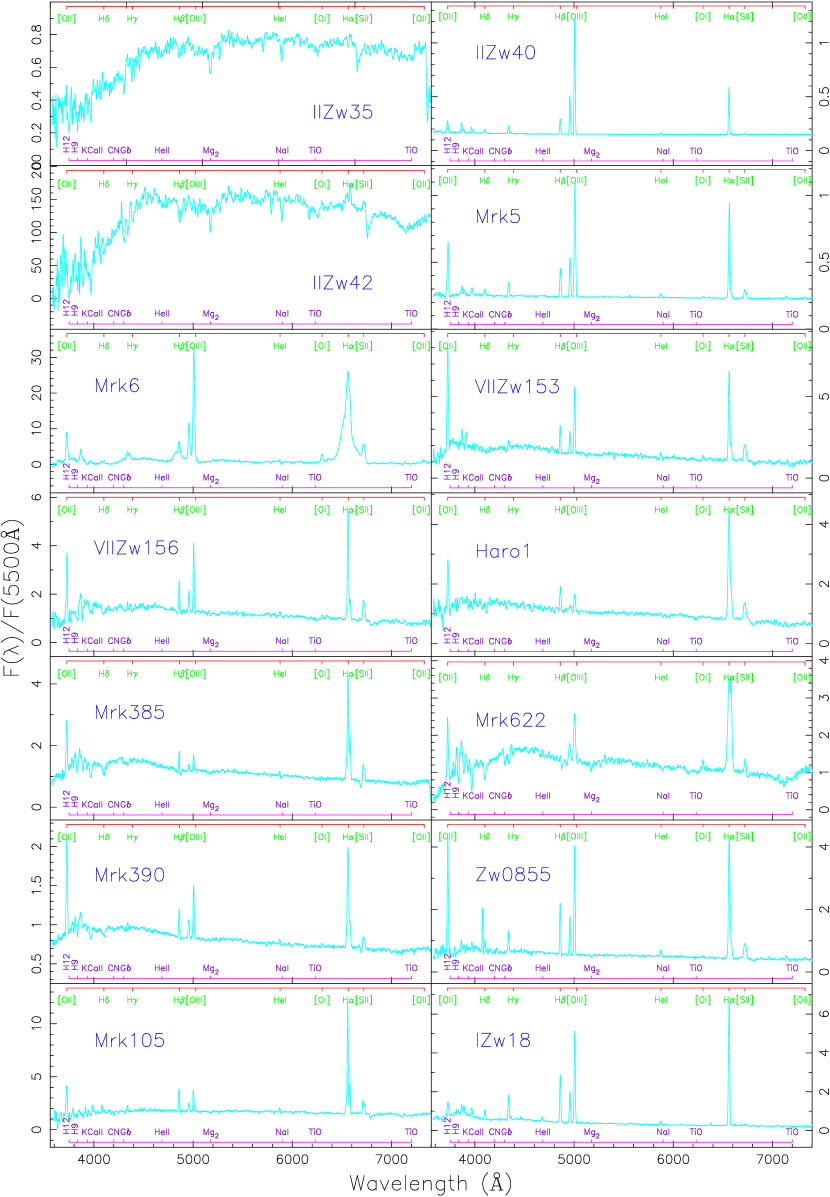
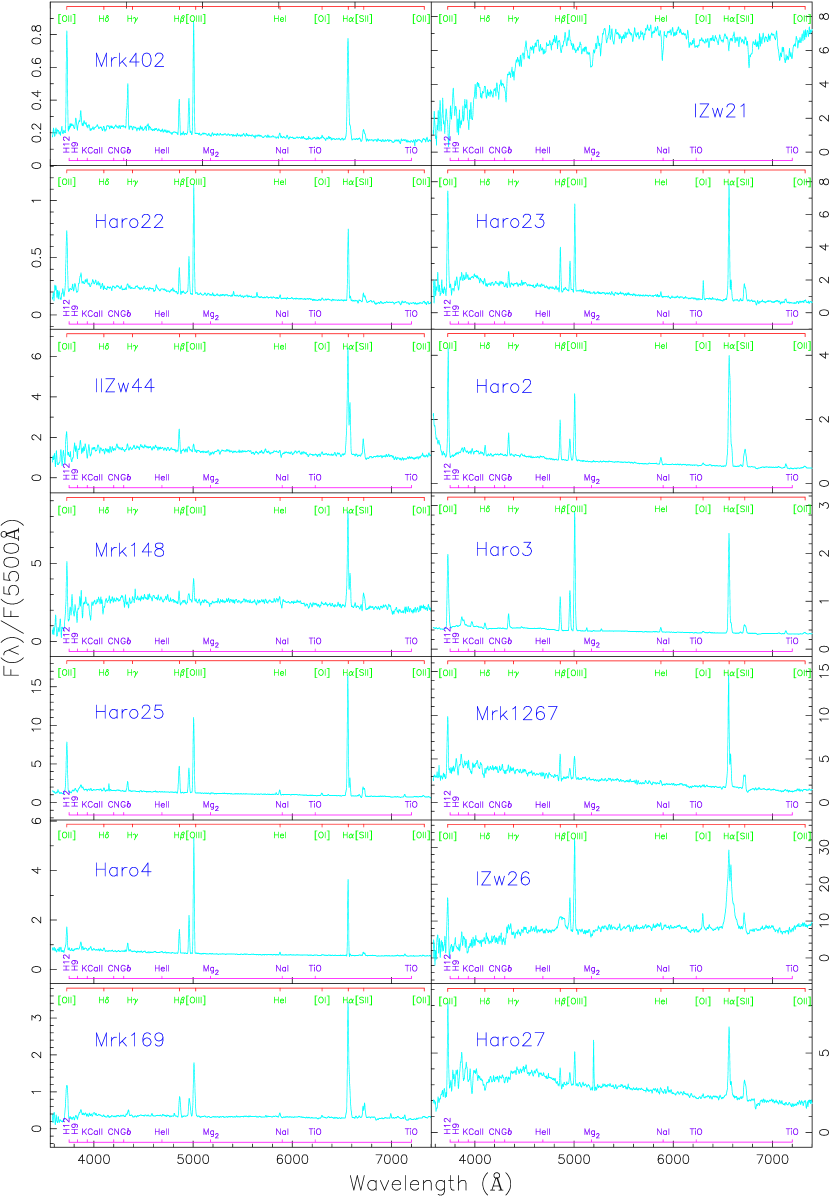
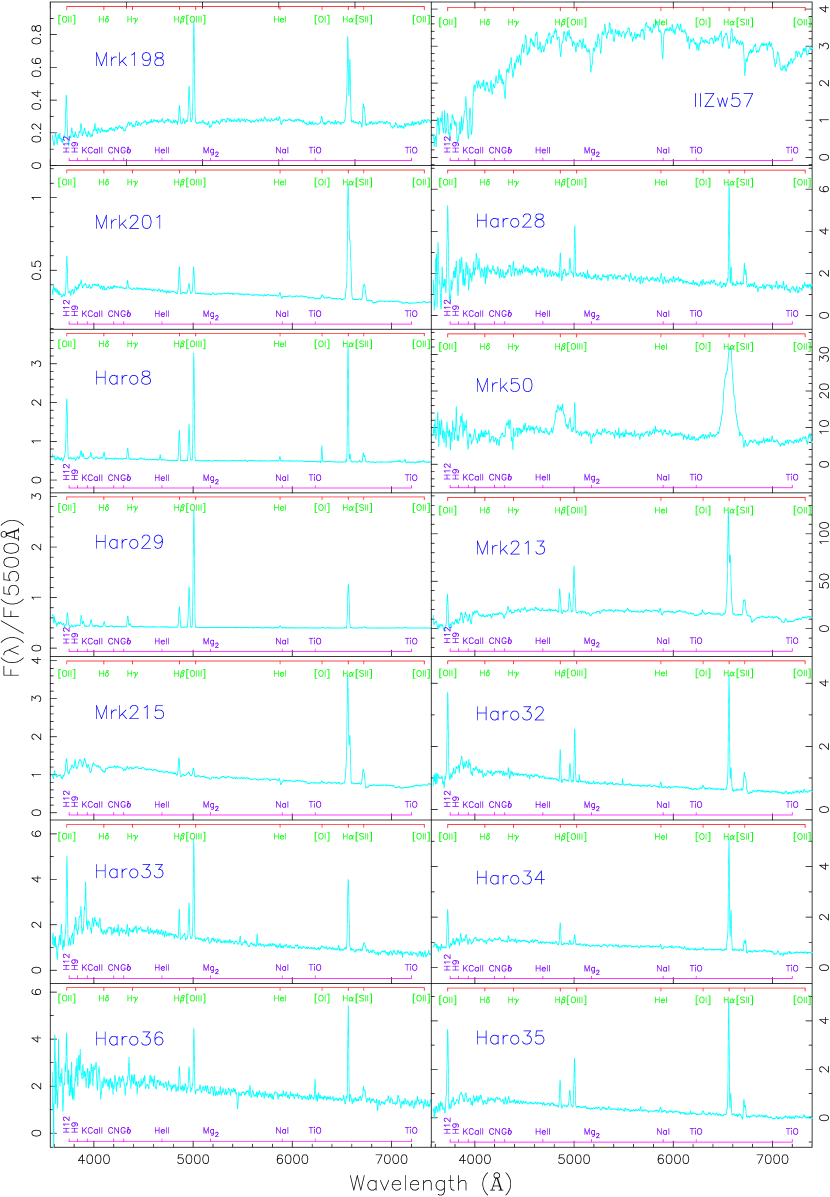
The calibrated spectra of the nuclei of all survey galaxies are presented in Figure 4. The objects are ordered with increasing right ascension at the epoch 2000 (), as in Table 1. The spectra have all been normalized to the flux in a 50Å wavelength interval centered on 5500Å. The ordinate displays normalized flux, , and the abscissa wavelength(Å) in the restframe of the galaxy, binned linearly to 2 Å. All spectra were plotted on a common wavelength scale of 3580 – 7400Å.
The spectra are generally of high quality. The signal-to-noise ratios (SNRs) of the spectra, measured at 5500Å over a region between 5475 and 5525Å, are high. The SNRs of 89 sample galaxies are larger than 20, the average over the sample galaxies being 51. Column (10) – (11) of Table 3 list the flux and signal-to-noise ratios in a 50Å wavelength interval centered on 5500Å.
Because the original BCGs sample of Haro (1956), Markarian et al.(1989), and Zwicky (1971) were identified on the basis of their high surface brightness on photographic plates and strong UV emission, they do not all have spectra similar to those of H ii regions. We find that some BCGs have broad H spectral lines, such as Mrk 6, Mrk 335, and other objects. In fact, based on Véron-Cetty & Véron (2001), 10 sample galaxies are found to be Seyfert galaxies. 13 of 97 BCGs have no emission lines. The other 74 spectra are typical H ii region spectra, with strong narrow nebular emission lines.
| Galaxy | 1 observation | 2 observation | Vo | V | F5500 | SNRs | ||||
|---|---|---|---|---|---|---|---|---|---|---|
| Name | Date | Exp.(s) | Air | Date | Exp.(s) | Air | (km s-1) | (km s-1) | ||
| Mrk335 | 14/08/1998 | 4000. | 1.07 | 02/01/2000 | 1500. | 1.12 | 7978.3 | 21.4 | 9.0192 | 128.0 |
| IIIZw12 | 12/10/2001 | 1800. | 1.06 | 10/01/2002 | 1800. | 1.13 | 5670.2 | 22.6 | 2.4061 | 87.3 |
| Haro15 | 19/08/1998 | 2000. | 1.71 | 09/08/1999 | 1800. | 1.68 | 6478.3 | 42.1 | 3.0558 | 155.2 |
| Mrk 352 | 10/01/2002 | 1800. | 1.12 | 4314.8 | 33.5 | 2.8522 | 30.0 | |||
| Mrk 1 | 09/01/2002 | 1800. | 1.06 | 4723.4 | 32.0 | 1.5423 | 28.6 | |||
| IIIZw33 | 02/01/2000 | 1800. | 1.10 | 8375.7 | 27.3 | 8.1323 | 52.4 | |||
| VZw155 | 02/01/2000 | 1800. | 1.05 | 8554.9 | 42.4 | 6.8131 | 70.3 | |||
| IIIZw42 | 24/02/2001 | 1800. | 1.55 | 10/01/2002 | 1800. | 1.22 | 8262.3 | 25.8 | 2.9035 | 64.8 |
| IIIZw43 | 25/02/2001 | 1800. | 1.68 | 4202.2 | 35.2 | 3.9608 | 63.3 | |||
| VZw372 | 02/01/2000 | 1800. | 1.02 | 24/02/2001 | 1800. | 1.11 | 4249.3 | 31.4 | 19.849 | 59.9 |
| IIZw18 | 25/02/2001 | 1800. | 1.21 | 4020.3 | 66.5 | 5.6460 | 23.1 | |||
| IIZw23 | 24/02/2001 | 1800. | 1.41 | 27/02/2001 | 1800. | 1.33 | 8310.0 | 36.9 | 2.5924 | 70.3 |
| IIZw28 | 25/02/2000 | 2000. | 1.26 | 25/02/2000 | 2000. | 1.29 | 8552.4 | 17.8 | 0.6340 | 41.6 |
| IIZw33 | 02/01/2000 | 2400. | 1.38 | 2068.7 | 30.3 | 4.7074 | 34.4 | |||
| IIZw35 | 25/02/2001 | 1800. | 1.38 | 08/01/2002 | 1800. | 1.30 | 7402.0 | 46.8 | 2.5327 | 53.0 |
| IIZw40 | 25/02/2000 | 1800. | 1.28 | 25/02/2000 | 1800. | 1.32 | 770.5 | 15.6 | 5.8835 | 47.2 |
| IIZw42 | 24/02/2001 | 1800. | 1.24 | 01/03/2001 | 1800. | 1.20 | 5146.6 | 31.4 | 6.0929 | 34.5 |
| Mrk5 | 27/02/2001 | 1800. | 1.22 | 11/01/2002 | 2400. | 1.23 | 772.1 | 34.4 | 0.6563 | 18.4 |
| Mrk6 | 01/01/2000 | 1800. | 1.21 | 5677.7 | 24.9 | 7.3775 | 58.0 | |||
| VIIZw153 | 02/01/2000 | 1800. | 1.18 | 02/01/2000 | 600. | 1.19 | 2666.1 | 19.6 | 2.9714 | 21.2 |
| VIIZw156 | 24/02/2001 | 1800. | 1.18 | 01/03/2001 | 1800. | 1.20 | 3630.4 | 23.2 | 0.9874 | 19.5 |
| Haro1 | 20/03/1997 | 2400. | 1.25 | 17/02/1998 | 2000. | 1.02 | 4081.9 | 26.0 | 2.5661 | 26.9 |
| Mrk385 | 01/01/2000 | 1800. | 1.04 | 8181.2 | 13.3 | 3.1053 | 45.7 | |||
| Mrk622 | 02/01/2000 | 1800. | 1.01 | 6666.6 | 28.3 | 7.3464 | 52.5 | |||
| Mrk390 | 02/01/2000 | 1800. | 1.03 | 7496.4 | 23.7 | 4.3751 | 29.6 | |||
| Zw0855 | 27/02/2001 | 1800. | 1.28 | 3110.0 | 14.7 | 0.9041 | 19.6 | |||
| Mrk105 | 01/05/2000 | 1800. | 1.22 | 09/01/2002 | 1800. | 1.17 | 3912.4 | 42.7 | 1.3456 | 69.1 |
| IZw18 | 01/01/2000 | 1800. | 1.03 | 01/01/2000 | 1800. | 1.04 | 744.5 | 10.1 | 0.6808 | 34.1 |
| Mrk402 | 02/01/2000 | 1800. | 1.02 | 7243.0 | 12.6 | 2.3288 | 20.9 | |||
| IZw21 | 29/04/2000 | 1800. | 1.10 | 4874.0 | 30.9 | 2.6133 | 46.1 | |||
| Haro22 | 24/02/2001 | 1500. | 1.04 | 24/02/2001 | 900. | 1.03 | 1131.0 | 13.5 | 1.0172 | 25.8 |
| Haro23 | 24/02/2001 | 1800. | 1.02 | 1379.7 | 10.2 | 1.2867 | 30.6 | |||
| IIZw44 | 24/02/2001 | 1800. | 1.06 | 08/01/2002 | 1800. | 1.06 | 6278.8 | 34.1 | 1.1679 | 58.8 |
| Haro2 | 19/03/1997 | 1200. | 1.03 | 1583.9 | 44.5 | 4.9081 | 65.8 | |||
| Mrk148 | 30/04/2000 | 1800. | 1.00 | 11/01/2002 | 1800. | 1.01 | 7318.0 | 18.5 | 1.1232 | 34.3 |
| Haro3 | 18/03/1997 | 1200. | 1.15 | 01/01/2000 | 1800. | 1.04 | 904.7 | 11.5 | 6.6393 | 110.3 |
| Haro25 | 30/04/2000 | 1800. | 1.05 | 7914.8 | 13.4 | 2.4676 | 51.9 | |||
| Mrk1267 | 20/03/1997 | 2400. | 1.30 | 10/01/2002 | 1800. | 1.24 | 6185.1 | 23.1 | 2.8781 | 53.4 |
| Haro4 | 01/05/2000 | 1800. | 1.02 | 740.4 | 13.7 | 0.7125 | 19.0 | |||
| IZw26 | 01/05/2000 | 2400. | 1.04 | 6169.0 | 20.7 | 0.9970 | 38.9 | |||
| Mrk169 | 17/02/1998 | 3600. | 1.07 | 29/04/2000 | 1800. | 1.08 | 1271.3 | 55.4 | 2.5631 | 83.9 |
| Haro27 | 01/01/2000 | 1800. | 1.02 | 1800.1 | 20.4 | 4.4561 | 50.1 | |||
| Mrk198 | 29/04/2000 | 1800. | 1.06 | 7358.9 | 50.0 | 2.6700 | 43.1 | |||
| IIZw57 | 30/04/2000 | 1800. | 1.09 | 6627.2 | 24.0 | 4.9057 | 70.2 | |||
| Mrk201 | 20/03/1997 | 1800. | 1.04 | 2619.0 | 26.2 | 8.0253 | 55.2 | |||
| Haro28 | 01/05/2000 | 1800. | 1.02 | 743.3 | 17.5 | 1.0679 | 25.6 | |||
| Haro8 | 30/04/2000 | 2400. | 1.25 | 1631.1 | 13.7 | 0.7415 | 26.5 | |||
| Mrk50 | 24/02/2001 | 1800. | 1.33 | 7026.6 | 24.6 | 1.5518 | 25.9 | |||
| Haro29 | 19/03/1997 | 1800. | 1.01 | 315.5 | 17.1 | 0.4020 | 18.5 | |||
| Galaxy | 1 observation | 2 observation | Vo | V | F5500 | SNRs | ||||
|---|---|---|---|---|---|---|---|---|---|---|
| Name | Date | Exp.(s) | Air | Date | Exp.(s) | Air | (km s-1) | (km s-1) | ||
| Mrk213 | 20/03/1997 | 1800. | 1.06 | 08/01/2002 | 1800. | 1.10 | 3377.5 | 11.8 | 4.8087 | 57.7 |
| Mrk215 | 10/01/2002 | 1800. | 1.03 | 11/01/2002 | 1800. | 1.02 | 5986.9 | 30.0 | 6.1985 | 80.8 |
| Haro32 | 25/02/2001 | 1800. | 1.08 | 4837.4 | 11.3 | 2.7195 | 45.6 | |||
| Haro33 | 27/02/2001 | 2400. | 1.05 | 1000.1 | 24.0 | 0.8098 | 25.8 | |||
| Haro34 | 30/04/2000 | 1800. | 1.08 | 7012.3 | 9.8 | 2.0477 | 54.5 | |||
| Haro36 | 01/05/2000 | 2400. | 1.09 | 379.8 | 25.1 | 0.3791 | 18.2 | |||
| Haro35 | 30/04/2000 | 1500. | 1.09 | 7663.0 | 15.8 | 1.6945 | 27.7 | |||
| Haro37 | 24/02/2001 | 1800. | 1.02 | 4213.4 | 2.8 | 1.9236 | 59.8 | |||
| IIIZw68 | 25/02/2001 | 1800. | 1.07 | 27/02/2001 | 1800. | 1.04 | 7241.2 | 35.1 | 2.3599 | 55.3 |
| IIZw67 | 19/03/1997 | 1500. | 1.03 | 01/01/2000 | 1500. | 1.04 | 7624.1 | 15.1 | 6.0330 | 109.1 |
| Mrk57 | 25/02/2001 | 1800. | 1.03 | 7718.2 | 48.4 | 0.7684 | 27.2 | |||
| Mrk235 | 24/02/2001 | 1800. | 1.01 | 7079.7 | 13.0 | 1.3856 | 38.4 | |||
| Mrk241 | 30/04/2000 | 1800. | 1.08 | 8053.9 | 42.5 | 1.3220 | 48.1 | |||
| IZw53 | 09/01/2002 | 1800. | 1.07 | 09/01/2002 | 1800. | 1.03 | 4829.3 | 38.9 | 0.8252 | 32.9 |
| IZw56 | 25/02/2001 | 1800. | 1.01 | 11/01/2002 | 1800. | 1.04 | 6880.9 | 55.0 | 1.1944 | 65.1 |
| Haro38 | 27/02/2001 | 1800. | 1.02 | 981.3 | 16.3 | 1.2028 | 33.3 | |||
| Mrk270 | 30/04/2000 | 1500. | 1.17 | 3112.3 | 17.3 | 5.3308 | 93.3 | |||
| Mrk275 | 24/02/2001 | 1800. | 1.01 | 7653.4 | 20.2 | 1.3908 | 56.9 | |||
| Haro39 | 27/02/2001 | 1800. | 1.04 | 2691.9 | 14.4 | 0.7904 | 26.0 | |||
| Haro42 | 29/04/2000 | 1800. | 1.10 | 4605.6 | 38.8 | 1.3191 | 73.2 | |||
| Haro43 | 27/02/2001 | 1800. | 1.03 | 1608.8 | 10.1 | 0.4845 | 16.4 | |||
| Haro44 | 10/01/2002 | 1800. | 1.21 | 10/01/2002 | 1800. | 1.14 | 3600.8 | 17.1 | 0.6320 | 28.6 |
| IIZw70 | 11/01/2002 | 1800. | 1.11 | 1126.4 | 27.3 | 1.8516 | 47.7 | |||
| IIZw71 | 01/05/2000 | 1800. | 1.01 | 1225.2 | 22.1 | 0.7794 | 23.1 | |||
| IZw97 | 24/02/2001 | 1800. | 1.00 | 27/02/2001 | 1200. | 1.02 | 2320.1 | 52.3 | 0.7185 | 25.1 |
| IZw98 | 29/04/2000 | 1800. | 1.07 | 01/05/2000 | 1200. | 1.03 | 5478.8 | 24.1 | 4.2581 | 53.7 |
| IZw101 | 24/02/2001 | 1800. | 1.00 | 4785.6 | 30.0 | 1.1713 | 21.2 | |||
| IZw117 | 30/04/2000 | 2400. | 1.01 | 5602.5 | 10.7 | 2.2100 | 52.9 | |||
| IZw123 | 18/03/1997 | 1800. | 1.04 | 20/03/1997 | 2820. | 1.04 | 584.0 | 32.3 | 0.9901 | 132.2 |
| VIIZw631 | 01/05/2000 | 1200. | 1.10 | 4310.9 | 22.6 | 2.1508 | 40.5 | |||
| Mrk297 | 19/03/1997 | 1800. | 1.06 | 4760.3 | 37.6 | 2.4518 | 59.2 | |||
| IZw147 | 01/05/2000 | 1800. | 1.06 | 5370.3 | 22.4 | 1.3458 | 29.8 | |||
| IZw159 | 20/08/1998 | 1800. | 1.10 | 20/08/1998 | 1800. | 1.14 | 2884.9 | 13.4 | 1.5788 | 63.7 |
| IZw166 | 19/03/1997 | 3000. | 1.02 | 19/03/1997 | 1200. | 1.01 | 7721.4 | 52.4 | 3.3032 | 148.0 |
| Mrk893 | 19/08/1998 | 3600. | 1.07 | 19/08/1998 | 1800. | 1.12 | 6267.9 | 22.6 | 0.5122 | 50.3 |
| IZw191 | 29/04/2000 | 1800. | 1.01 | 5624.6 | 27.8 | 2.5024 | 42.4 | |||
| IZw199 | 20/08/1998 | 3000. | 1.10 | 5485.6 | 17.0 | 2.2458 | 40.8 | |||
| IZw207 | 12/10/2001 | 1800. | 1.10 | 5724.3 | 22.1 | 0.2198 | 11.9 | |||
| IIZw82 | 15/08/1998 | 1500. | 1.48 | 3651.3 | 18.3 | 8.1681 | 70.8 | |||
| IVZw67 | 15/08/1998 | 1800. | 1.09 | 03/08/1999 | 600. | 1.02 | 2550.0 | – | 272.96 | 97.1 |
| IIZw172 | 12/10/2001 | 1500. | 1.13 | 7880.5 | 6.9 | 4.0476 | 38.9 | |||
| IVZw93 | 20/08/1998 | 3600. | 1.11 | 3595.7 | 26.4 | 1.1569 | 19.2 | |||
| Mrk303 | 20/08/1998 | 1800. | 1.10 | 20/08/1998 | 1800. | 1.09 | 7437.3 | 50.7 | 1.6985 | 88.8 |
| Zw2220 | 12/10/2001 | 1800. | 1.03 | 6829.8 | 17.0 | 2.9004 | 58.8 | |||
| Mrk314 | 09/08/1999 | 1500. | 1.09 | 2079.8 | 33.6 | 5.5239 | 61.0 | |||
| IVZw142 | 09/01/2002 | 1800. | 1.25 | 8109.9 | 26.8 | 0.8097 | 22.8 | |||
| IVZw149 | 14/08/1998 | 3000. | 1.06 | 20/08/1998 | 2500. | 1.05 | 3224.4 | 30.3 | 2.4436 | 37.8 |
| Zw2335 | 15/08/1998 | 4000. | 1.05 | 09/08/1999 | 1800. | 1.02 | 1338.1 | 52.5 | 3.1063 | 113.5 |
The absolute flux (10th column) is in units of .
The atlas and tables of measurements will be made available electronically.
6 Discussion
6.1 Spectrophotometric accuracy
The spectrophotometric accuracy can be estimated by adding individual contributions to the total error in quadrature.
The main sources of errors that affect the spectral shape include: the fitting of the sensitivity function, the published standard star fluxes, the adopted atmospheric extinction curve (Jansen et al. (2000)). The error in the fit of the sensitivity function is estimated using the residuals of individual standard stars from the mean calibration. These residuals are dominated by systematic differences in the sensitivity function fitted to the different stars, and are less than 5%. Standard star fluxes are accurate to better than 3% (Massey et al. (1988)). Considering this 3% uncertainty, we find that errors in our sensitivity function fits are likely to be less than 5%. Application of the BAO mean atmospheric extinction curve to correct our data introduces an error in the continuum slope of the spectra. Because most galaxies were observed at low airmasses, we expect the error in the continuum slope to be less than 5% at any wavelength.
The main sources of errors that affect restricted ranges in wavelength include: the flat field variations, wavelength calibration, the sky subtraction and residuals due to cosmic ray hits (Jansen et al. (2000)). Differences between flat fields taken on different nights within a run are small. The contribution of the read noise to the error in the flat field is negligible. Errors in the wavelength calibration introduce small errors in the inferred flux densities on scales comparable to the distance between individual calibration lines. Errors in the dispersion solution are less than 0.3Å. These dispersion errors produce spectrophotometric errors of at most 3%. Sky subtraction errors dominate the total error on small scales. Because BCGs are compact objects, errors from sky subtraction are less than 5%. Cosmic ray residuals introduce large errors in the extracted spectra only near emission lines, where the steepness of the local background renders a clean fit difficult. Residuals in continuum or sky portions in the spectra are smaller than 2% of the local background. Errors may be as large as 10% per extracted pixel.
This analysis shows that the spectrophotometry is accurate to better than 10% over small wavelength regions, and about 15% or better on large scales.
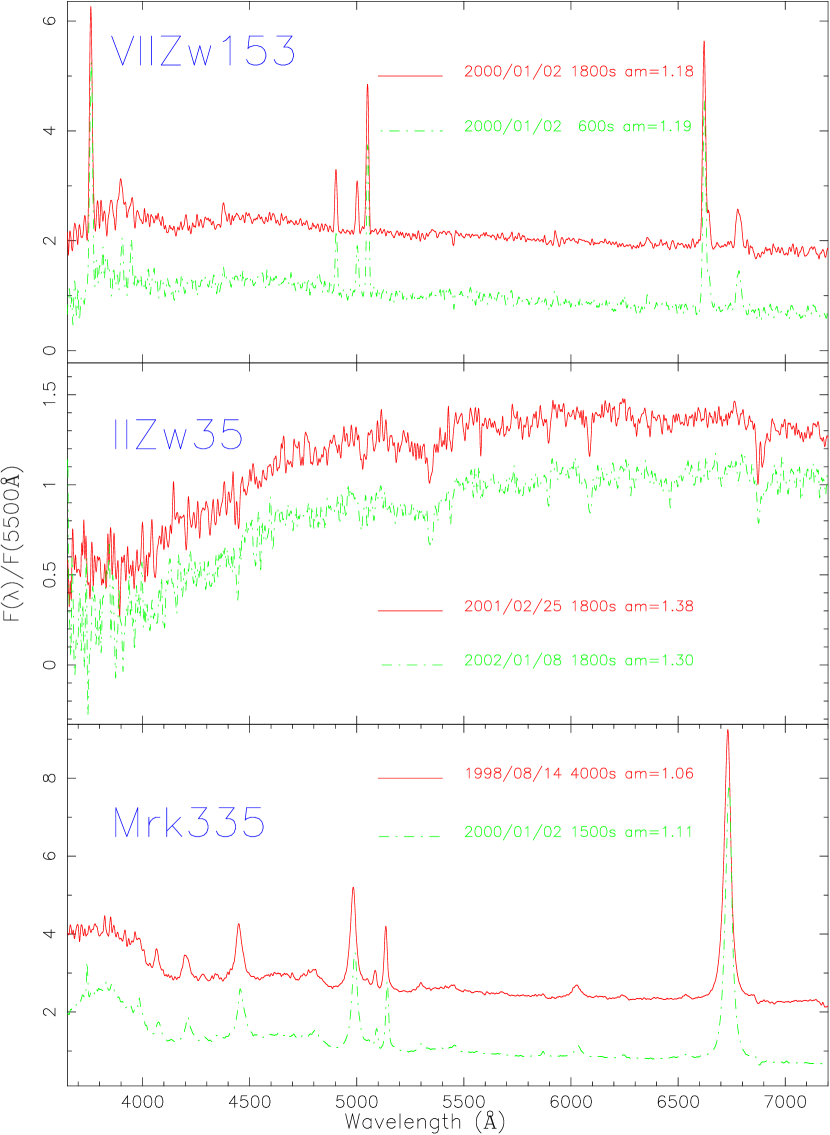
6.2 Internal checks of the spectrophotometry
In Table 3 we list the total number of observations of each galaxy, 39 galaxies have been observed twice. To check how consistent our calibration procedure is from night to night, including whatever errors exist in the adoption of a mean extinction curve, we can compare the final spectrophotometry to each individual observation.
To illustrate this level of accuracy, we show in Figure 5a. duplicate spectra for three kinds of galaxies: an emission line galaxy (VIIZw 153), an absorption line galaxy (IIZw 35), and a Seyfert galaxy (Mrk335). The dates at which the spectra were obtained, the exposure times, and the effective airmasses during the observations are indicated. As expected, the deviations are rarely larger than 10% from 4500 to 6800Å. We see that the average spectral energy distribution precision of our data is good. No systematic differences are seen.
6.3 Comparison with other spectra
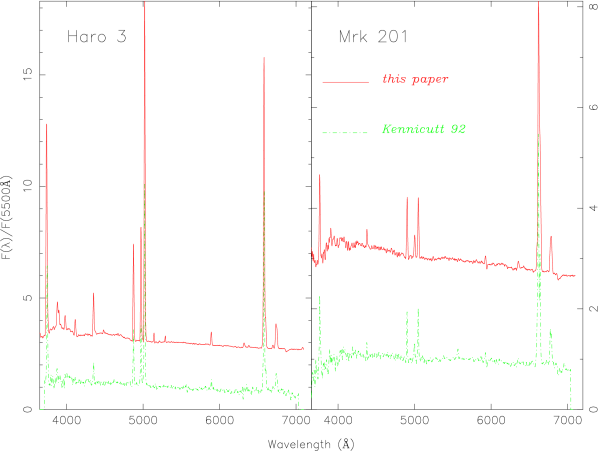
Our sample of blue compact galaxies contains two galaxies that were also observed by Kennicutt (1992): Haro 3 and Mrk 201. We compare our spectra for these objects with those obtained by Kennicutt (1992) in Figure 5b.
In the 4500–6800Å region the continuum of our spectra match Kennicutt’s to better than 10% over small ranges. Bluewards of 4500Å differences tend to become larger, up to about 30%. In addition, our spectra show a bluer optical spectrum and stronger emission lines than do Kennicutt’s. The aperture used by Kennicutt is much larger than ours (45′′ circular versus 3′′ slit). Since BCGs have a central burst of star formation, the difference in aperture size is most likely the cause of the difference in continuum shape and emission lines. The increased aperture size allows for a greater contribution to the flux by older stars surrounding the central brust.
7 Summary
We have presented medium-resolution spectroscopy observations of 97 blue compact galaxies. These BCGs cover a range in absolute blue magnitude ; 83 BCGs have mag. The spectra were obtained with the Beijing Astronomical Observatory 2.16 m telescope, with spectral resolution (FWHM) of about 10Å and spectral range 3580Å – 7400Å. The spectrophotometry is expected to be accurate to 10%.
Based on the emission and absorption lines, we measured the recession velocities of the sample galaxies. Most galaxies in the sample have velocities below 9000 km s-1; the error in recession velocity is less than 67 km s-1.
The majority of the sample galaxies are dominated by active star formation; 74 of them have typical H ii regions spectra, the others are Seyfert galaxies and absorption line galaxies.
Measurement of the spectral line strengths and the results of the spectral analysis of these galaxies will be presented in the next paper of this series. We will use these data to understand the star formation history, the physical parameters governing the burst mode of star formation and chemical evolution in blue compact galaxies.
Acknowledgements.
We are grateful to Dr. A. Weiss and Dr. S. Charlot for their helpful comments, constructive suggestions, and hard work of English revision for this paper. The referee Dr. D. Kunth is thanked for many useful suggestions. We also thank the BAO Chinese 2.16m Telescope time allocation committee for their support of this programme and to the staff and telescope operators of the Xinglong Station of the Beijing Astronomical Observatory for their support. Especially we would like to thank Dr. J.Y. Wei and Dr. X.J. Jiang for their active cooperation that enabled all of the observations to go through smoothly. This work is supported by the Chinese National Natural Science Foundation (CNNSF 10073009). Dr. X. Kong has been financed by the Special Funds for Major State Basic Research Projects of China and the Alexander von Humboldt Foundation of Germany.References
- Cairós et al. (2001) Cairós L. M., Caon N., Vílchez J. M., et al., 2001, ApJS, 136, 393
- Cardelli et al. (1989) Cardelli J. A., Clayton G. C., Mathis J. S., 1989, ApJ, 345, 245
- de Vaucouleurs et al. (1991) de Vaucouleurs G., de Vaucouleurs A., Corwin Jr. H.G., et al., 1991, Third Reference Catalogue of Bright Galaxies (RC3), Springer-Verlag: New York
- Doublier et al. (1999) Doublier V., Caulet A., Comte G., 1999, A&AS, 138, 213
- Filippenko (1982) Filippenko A. V., 1982, PASP, 94, 715
- Gordon & Gottesman (1981) Gordon D., Gottesman T. S., 1981, AJ, 86, 161
- Haro (1956) Haro G., 1956, AJ, 61, 178
- Izotov et al. (2001) Izotov Y. I., Chaffee F. H., Green R. F., 2001, ApJ, 562, 727
- Izotov & Thuan (1999) Izotov Y. I., Thuan T. X., 1999, ApJ, 511, 639
- Jangren et al. (2002) Jangren A., Bershady M. A., Conselice C. J., et al., 2002, ApJ, submitted
- Jansen et al. (2000) Jansen R. A., Fabricant D., Franx M., et al., 2000, ApJS, 126, 331
- Kinney et al. (1993) Kinney A. L., Bohlin R. C., Calzetti D., et al.,1993, ApJS, 86, 5
- Kennicutt (1992) Kennicutt R. C., 1992, ApJS, 79, 255
- Kong & Cheng (1999) Kong X., Cheng F. Z., 1999, A&A, 351, 477
- Kong et al. (2000) Kong X., Zhou X. Chen J. S., et al., 2000, AJ, 119, 2745
- Kunth et al. (1997) Kunth D., Lequeux J., Mas-Hesse, J. M., et al., 1997, Rev. Mex. Astron. Astrofis. 6, 61
- Kunth et al. (1988) Kunth D., Maurogordato S., Vigroux L., 1988, A&A, 204, 10
- Kunth & Östlin (2000) Kunth D., Östlin G., 2000, A&A Rev., 10, 1
- Kunth & Östlin (2001) Kunth D., Östlin, G., 2001, Astrophysics and Space Science Supplement 277, 281
- Kunth & Sargent (1979) Kunth D., Sargent W. L. W., 1979, A&A, 76, 50
- Markarian et al. (1989) Markarian B. E., Lipovetsky V. A., Stepanian J. A., et al., 1989, Soobshcheniya Spetsial’noj Astrofizicheskoj Observatorii, 62, 5
- Mas-Hesse & Kunth (1999) Mas-Hesse J. M., Kunth D., 1999, A&A, 349, 765
- Massey et al. (1988) Massey P., Strobel K., Barnes J. V., et al., 1988, ApJ, 328, 315
- Östlin et al. (2001) Östlin G., Amram P., Bergvall N., et al., 2001, A&A, 374, 800
- Pisano et al. (2001) Pisano D. J., Kobulnicky H. A., Guzmán R., et al., 2001, AJ, 122, 1194
- Sargent & Searle (1970) Sargent W.L.W., Searle L., 1970, ApJ, 162, L115
- Terlevich et al. (1991) Terlevich, R., Melnick, J., Masegosa, J., et al., 1991, A&AS, 91, 285
- Thuan et al. (99) Thuan T. X., Lipovetsky V. A., Martin J.-M., et al., 1999, A&AS, 139, 1
- Thuan & Martin (1981) Thuan T. X., Martin G. E., 1981, ApJ 247, 823
- Véron-Cetty & Véron (2001) Véron-Cetty M.-P., Véron P., 2001, Quasars and Active Galactic Nuclei (10th Ed.), ESO Scientific Report 20
- Zwicky (1971) Zwicky F., 1971, Catalogue of selected compact galaxies and of post-Eruptive galaxies (Guemligen: Zwicky)