THE DEPENDENCE OF OBSERVED GAMMA-RAY PULSAR
SPECTRA ON VIEWING
GEOMETRY
We calculate the gamma-ray lightcurves and spectra of rotation powered pulsars for a wide range of observer’s viewing angles (), and inclination angles of the magnetic axis to the rotation axis (). We show how the shapes of the observed phase-averaged spectra as well as energy-integrated pulse profiles depend on the orientation for classical and millisecond pulsars.
We compute characteristics of high energy emission from pulsars within the framework of a polar cap model. We use the Monte Carlo code described in detail in papers to show how the shapes of the observed phase-averaged spectra and the corresponding pulse profiles depend on viewing geometry and pulsar parameters. We assume that the magnetic field is a rigid dipole tilted at an angle with respect to the rotation axis. In the calculation we include the effects of aberration and the time of flight delays (TOF). These effects are important when the site of gamma-ray emission moves at relativistic speeds, i.e. for millisecond pulsars. Figure 1 presents these two effects for a perpendicularly rotating millisecond pulsar with ms and G. An observer is located at angle with respect to the rotation axis.
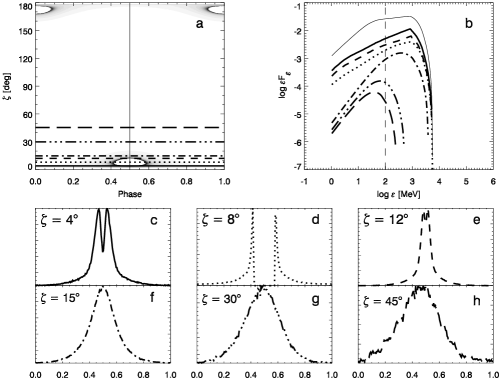
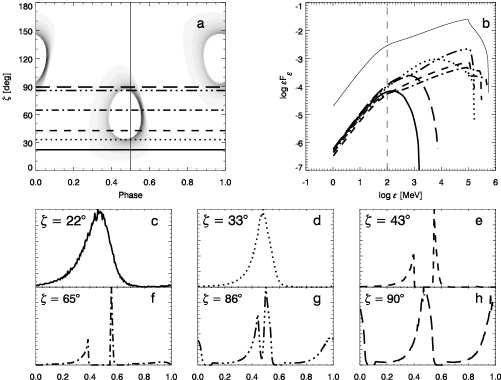
Figure 2 shows the characteristics of high-energy radiation calculated for a classical pulsar with s and G for the magnetic dipole inclination . The top left panel (a) presents intensity distribution for radiation above 100 MeV as a function of the rotational phase and the viewing angle . Positions of six observers located at different values of are marked with horizontal lines of different type. Phase-averaged spectra recorded by each of these observers (panel b) and corresponding pulse profiles (panels c-h) are shown with the same line type as in the panel a. In panel b, the spectrum of total emission from pulsar (i.e. integrated over all directions) is shown as a thin solid line. Its position relative to the phase-averaged observed spectra is arbitrary. Figure 3 is for the same and but for and a different choice of observer positions. In Figures 4 and 5 we present the similar characteristics of radiation for millisecond pulsar parameters ( ms and G) for and , respectively. For classical pulsars (Figs 2 and 3), curvature as well as synchrotron emission is included, whereas for millisecond pulsars (Figs 1,4 and 5) only the curvature radiation is calculated.
Conclusions
-
•
The combined effects of aberration and retardation (TOF) lead to spreading of the leading peak and to piling up of photons in the trailing peak in the case of double-peak lightcurves (Fig 1, Fig 4 - panels e,f,g). The same mechanism leads to asymmetry of single peaks in pulsar lightcurves – the leading wing is broader than the trailing one (Figs 2c,d,g, 4c,d,h). The latter effect is noticeable even for the case of classical pulsars as long as the line of sight misses the polar cap beam and the radiation in the peak originates at high altitudes (Fig 2c,d,g).
-
•
In the case of highly inclined millisecond pulsars the position of high energy cutoff is significanty different for the leading and the trailing peaks (for details see Dyks & Rudak ). This leads to step–like decline above MeV (dashed, dot-dashed and three-dot-dashed lines in Figure 4b).
-
•
The energy spectra integrated over the entire sky (thin solid line in panels b, Figs. 2-5) are different from the phase-averaged spectra for most viewing orientations.


Acknowledgements
This work was supported by the KBN grant 2P03D02117.
References
References
- [1] J.K. Daugherty and A. Harding, ApJ 458, 278 (1996).
- [2] J. Dyks and B. Rudak, MNRAS 319, 477 (2000).
- [3] J. Dyks and B. Rudak, A&A, submitted