Adaptive Optics Near-Infrared Spectroscopy
of the Sgr A* Cluster
Abstract
We present K-band / 2600 spectroscopy of five stars (K 14 - 16 mag) within 0.”5 of Sgr A*, the radio source associated with the compact massive object suspected to be a 2.6 x 10⁶ M☉ black hole at the center of our Galaxy. High spatial resolution of 0.”09, and good strehl ratios of 0.2 achieved with adaptive optics on the 10-meter Keck telescope make it possible to measure moderate-resolution spectra of these stars individually for the first time. Two stars (S0-17 and S0-18) are identified as late-type stars by the detection of CO bandhead absorption in their spectra. Their absolute K magnitudes and CO bandhead absorption strengths are consistent with early K giants. Three stars (S0-1, S0-2, and S0-16), with rproj 0.0075 pc ( 0.”2) from Sgr A*, lack CO bandhead absorption, confirming the results of earlier lower spectral and lower spatial resolution observations that the majority of the stars in the Sgr A* Cluster are early-type stars. The absolute K magnitudes of the early-type stars suggest that they are late O - early B main sequence stars of ages 20 Myr. The presence of young stars in the Sgr A* Cluster, so close to the central supermassive black hole, poses the intriguing problem of how these stars could have formed, or could have been brought, within its strong tidal field.
1 Introduction
The Sgr A* Cluster is a concentration of faint stars (K 14 - 16 mag) observed within 0.”5 of Sgr A*, the compact radio source located at the dynamical center of our Galaxy. Stellar velocities in the central 25 arcsec2 have demonstrated the existence of 2.6 x 10⁶ M☉ of dark mass confined to a volume less than 10-6 pc3, most likely in the form of a central supermassive black hole (Genzel et al. 1997; Ghez et al. 1998). The dynamics of the Sgr A* Cluster stars are critical for further constraining the location and distribution of the central dark mass to smaller scales. Ghez et al. (2000) used the proper motion accelerations of three Sgr A* Cluster stars (S0-1, S0-2, and S0-4) to localize the central dark mass to within 0.”05 0.”04 of Sgr A*, and to increase the implied dark mass density by an order of magnitude compared to that achieved with the proper motion velocities. The dark matter distribution within the orbits of the Sgr A* Cluster stars can be probed with even greater detail if the radial velocities of the stars can be added to their proper motions, to determine their three-dimensional orbits.
The Sgr A* Cluster stars can be fit by stars of two different spectral types given their absolute K magnitudes, assuming a distance of 8 kpc (Reid 1993) and 3 mag of K-band extinction to the Galactic Center: 1) early-type ( B) dwarfs, or 2) late-type ( K) giants. If the Sgr A* Cluster stars are early-type main sequence stars, then they must be relatively young ( 20 Myr). This would amplify, by introducing young stars deeper into the potential well, the problem already posed by the presence of the He I stars (tage 5 Myr; e.g., Krabbe et al. 1995) of how and where young stars that are currently in the proximity of a supermassive black hole are formed (Morris 1993; Sanders 1992).
Due to the high density of stars in the central arcsecond, both high spatial resolution and moderate spectral resolution K-band spectroscopy are required to determine the nature and the radial velocities of the individual Sgr A* Cluster stars. Thus far no experiment has satisfied both criteria. Genzel et al. (1997) used speckle spectroscopy to obtain high spatial resolution but low spectral resolution (/ 35) spectra of four stars in the Sgr A* Cluster. While they did not detect CO bandhead absorption indicative of late type giants, at this low spectral resolution they were also unable to resolve any of the He I and Br features expected from early-type dwarfs. Other experiments, which achieved the necessary moderate spectral resolution (/ 3000), but only seeing limited spatial resolution ( 0.”3 - 0.”6), provided spectra of the Sgr A* Cluster stars together as an unresolved cluster (Eckart et al. 1999; Figer et al. 2000). These composite spectra demonstrated a lack of CO bandhead absorption from the northern part of the Sgr A* Cluster, and a weak detection of CO bandhead absorption from the southern part, constraining the presence of late-type stars in the cluster, and suggesting that the majority of the Sgr A* Cluster stars are early-type main sequence stars.
Wih NIRSPEC behind adaptive optics on the 10-meter Keck telescope, one can achieve the spatial resolution and strehl ratios needed to obtain moderate-resolution (R 2600) spectra of these stars individually. Thus, for the first time, we have in principle the capability of determining the spectral types and the radial velocities of the Sgr A* Cluster stars in the immediate vicinity of our Galaxy’s central black hole. The data obtained improve considerably on previous measures of the K-band spectra of a few of these stars, but the presumably weak absorption lines expected for OB main sequence stars remain below our detection threshold, perhaps confused in part by local gas emission in the same lines. This paper describes this important, but difficult experiment in detail, in anticipation of continued efforts to push this technique to the requisite sensitivity level.
2 Observations
Simultaneous K-band (2.0 - 2.4 m ) spectra and images of stars in the Sgr A* Cluster were obtained with the facility near-infrared spectrometer NIRSPEC (McLean et al. 1998, 2000) behind the adaptive optics (AO) system (Wizinowich et al. 2000) on the W.M. Keck II 10-meter telescope during three nights of observations on 2000 June 20-22 (UT). Near-diffraction-limited spatial resolution was achieved with adaptive optics using the R = 13.2 mag natural guide star located 30” NE from Sgr A*. The observed AO point spread function (PSF) was composed of a near-diffraction-limited core on top of a seeing halo of FWHM 0.”25 - 0.”30. Figure 1 shows the FWHM of the PSF’s core and the fraction of energy it contained during the spectroscopic observations. The measurements were made with a 0.”5 radius aperture on the bright star IRS 16C in the tint = 10 sec images of the central 4.4” x 4.4” taken with the slit viewing camera (SCAM), plate scale = 0.0171”/pixel. The nights of June 20 and 21 had similar spectroscopic conditions, with the PSF containing a median of 30% of the total energy in a 0.”09 core. The night of June 22 had somewhat worse conditions for spectroscopy, with the PSF containing a median of 25% of the total energy in a 0.”1 core.
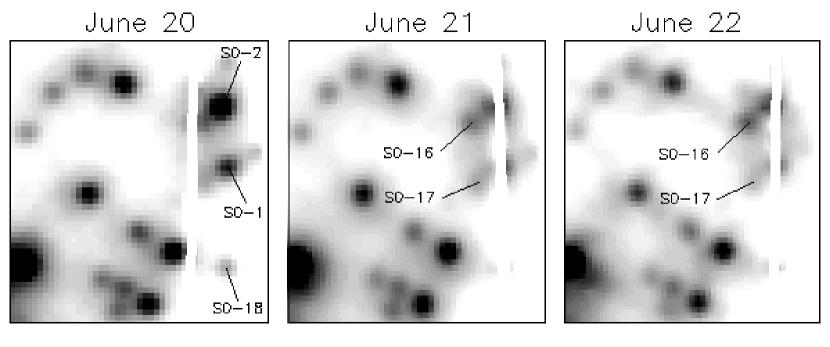
Spectra were obtained with SPEC, which contains a 10241024 InSb array, using a 2-pixel-wide slit (3.96” x 0.036”) in low-resolution mode, resulting in a moderate spectral resolution of / 2600. Figure 2 shows the position of the slit on the Sgr A* Cluster for each night of observations. On June 20 the slit was centered on S0-16 222New sources named using the convention from Ghez et al. (1998)., a new and variable source coincident with the position of Sgr A* detected by Ghez et al. (2002), and on June 21 and 22 the slit was centered on the Sgr A* Cluster stars S0-1 and S0-2 together. Table 1 lists the five stars in the Sgr A* Cluster observed under the slit (S0-1, S0-2, S0-16, S0-17, and S0-18), their projected distance from Sgr A*, K magnitude, date they were observed, total integration time, and the signal-to-noise ratio per pixel of the extracted spectrum for each night of observations. The slit was aligned so that the bright star IRS 16NW (K = 10.1 mag) was in the slit for each tint = 300 sec exposure, in order for the exposures to be easily shifted and added together in post-processing of the data. Spectra were also obtained of Tau Sco (B0-V) and HD 203638 (K0-III) for spectral standards, and BS7105 (B8-V) and BS7194 (A2-III) for telluric standards.
3 Data Reduction and Analysis
The following standard data reduction routines were performed using JIP, an analysis package developed by James Larkin (Larkin 1996): 1) Observations of a “dark spot” of sky relatively devoid of stars 180” East and 65” South of Sgr A* were subtracted from each spectrum to remove the atmospheric and instrumental background, 2) the spectra were spatially dewarped, 3) the spectra were wavelength calibrated using a spectral map constructed from neon arc lamps, and 4) the spectra were divided by spectra of telluric standard stars in order to correct for atmospheric absorption features in the spectra. The telluric standard spectra, featureless in the K-band except for Br absorption, were continuum corrected (i.e., divided by a blackbody of the same temperature), normalized, and their Br absorption feature removed by linear interpolation.
Due to the large number of bad pixels in the spectrometer array, an additional bad pixel removal routine was performed on the reduced exposures. In order to account for fluctuations of pixel fluxes between exposures due to varying seeing conditions and AO performance, and to take advantage of dithering between exposures, bad pixels were identified by looking at the ratio of pixel fluxes in an exposure to the median in the stack of exposures. Pixels with flux ratios outside of 3 for an exposure, were replaced by the mean flux ratio times the median flux of that pixel in the stack.
To ensure the best atmosphere and instrumental correction, spectra were reduced using all possible combinations of telluric standard stars and dark spot exposures obtained each night. The best matched telluric standard star and dark spot exposure was determined by the signal-to-noise ratios of the final extracted spectra. The signal-to-noise of the continuum for each star was measured in the wavelength range from 2.18 to 2.28 m , where the spectra presumably lack stellar features. This large range of wavelengths was used in order for the signal-to-noise calculation to include noise from systematic errors due to poor telluric absorption and emission correction.
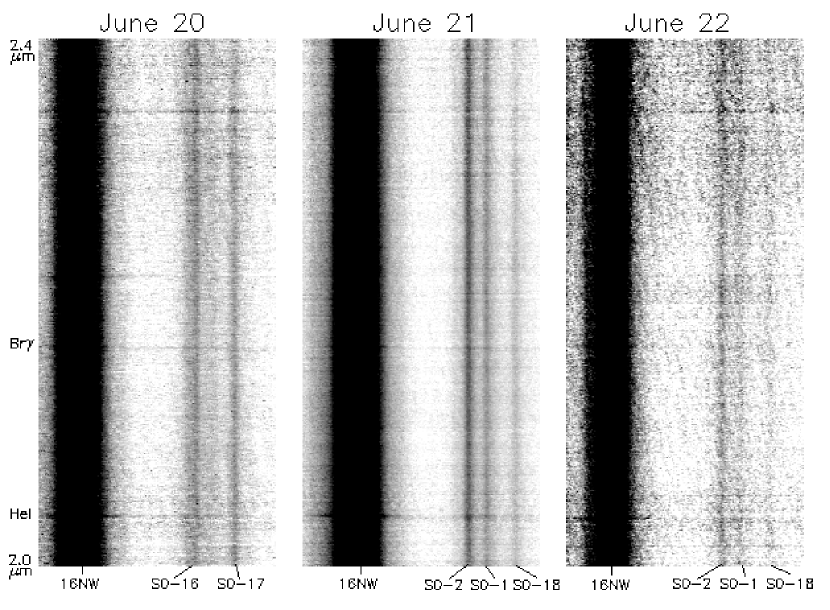
In order to maximize the signal-to-noise of the faint Sgr A* Cluster stellar spectra, the reduced exposures were weighted by the peak of IRS 16NW (integrated from 2.20 to 2.28 m ) in each exposure before being summed together, so that the exposures with the highest strehl ratios contributed the most to the final averaged 2D spectrum. The peak flux of IRS 16NW in each spectroscopic exposure varied during the observing nights due to changes in AO performance, seeing conditions, and centering of the slit. Figure 3 shows the final 2D spectra for each night, and figure 4 shows the spatial profile of the Sgr A* Cluster stars and the astronomical sky background level in the final 2D spectra averaged from 2.20 to 2.28 m , in average counts per pixel. It is evident from the poor quality of the June 22 spectrum that, in addition to the total integration time, the signal-to-noise ratios of the final spectra are very sensitive to the strehl ratios of the individual exposures.
A 1D spectrum for each star was extracted from the final 2D spectrum from each night by carrying out a weighted average across 0.”2 in the spatial direction, centered on the peak of the star, by weights set by the PSF profile of IRS 16NW as measured in the 2D spectrum. 1D spectra of the astronomical sky background of unresolved stars and gas, henceforth referred to as the ’sky’, in the region between IRS 16NW and S0-16 on June 20, and the region between IRS 16NW and S0-2 on June 21 and June 22, were also extracted by averaging across the same width in the spatial direction. The signal-to-noise ratios of the spectra extracted from the June 22 spectrum are comparable to the signal-to-noise of the sky (S/Npix 10), so they were not used in this analysis. Figure 5 shows the 1D spectra extracted for the Sgr A* Cluster stars observed on June 20 and June 21, compared to the sky spectrum extracted each night. The spectral features expected in early-type stars (He I and Br) and late-type stars (CO bandheads) are labeled with tick marks. The feature at 2.316 m , seen in emission on June 20 and in absorption on June 21 for all of the Sgr A* Cluster stars and the sky background, is an atmosphere line that was not completely removed in the data reduction. Figure 6 shows spectra obtained of two bright stars in the central parsec which show the strong spectral features in the K-band characteristic of early-type He I stars (IRS 16NW) and late-type supergiant stars (IRS 7).
4 Results
4.1 Late-type spectral features: CO bandhead absorption
CO bandhead absorption is easily identified in late-type stars because of its distinctive line shape and bandhead spacing. In order to identify CO bandheads in the low signal-to-noise spectra of the Sgr A* Cluster stars, and to measure their radial velocity shifts, the extracted spectrum of each star was cross-correlated with the spectrum of the observed K0-III spectral standard, HD 203638. Figure 7 shows the cross-correlations for the wavelength range from 2.29 to 2.37 m , which includes the 12CO (2,0), 12CO (3,1), and the 12CO (4,2) absorption bandheads, for each of the Sgr A* Cluster stars observed (solid line) in comparison to the cross-correlation for the sky on the same night of observations (dotted line). The K0-III standard spectrum and the Sgr A* Cluster spectra were normalized and the slope of the continuum in this wavelength range was removed before the cross-correlation. Three of the Sgr A* Cluster stars, S0-1, S0-2, and S0-16, show no significant cross-correlation peaks with the K0-III standard spectrum above the sky background. S0-17 and S0-18, on the other hand, show 7 and 5 cross-correlation peaks respectively with the K0-III spectrum, where 1 is determined by the standard deviation of the cross-correlation for the sky for that night of observations. In order to not include the negative peak in the sky cross-correlation attributed to the atmosphere line at 2.316 m , only the portion of the sky cross-correlation with positive pixel shifts was used to determine 1 . It should be noted that the cross-correlations for S0-17 and S0-18 peak at the same pixel shift. This may point to the cross-correlation peaks as being the result of features in the spectra not intrinsic to the stars (i.e. features due to atmosphere lines, or systematic errors introduced in the data reduction process). However, the other Sgr A* Cluster stars (S0-1, S0-2, and S0-16) do not show significant correlation peaks at this pixel shift, making it hard to attribute the cross-correlation peaks for S0-17 and S0-18 to systematic features in the spectra. Assuming that the CO features are real, we derived a radial velocity of -66 17 km/s for S0-17 and -76 13 km/s for S0-18. The velocity shifts were measured by the peak of the gaussian fit to the cross-correlation peak, and the error was determined by the jack-knife resampling method (Babu & Feigelson 1996), in which random half sets of data were cross-correlated with the K0-III spectrum, and the dispersion of these velocity fits from the original velocity shift is the 1 error.
In addition to cross-correlation as a method for identifying CO bandhead absorption, absorption strengths for the three strongest bandheads in this wavelength range, 12CO (2,0), 12CO (3,1), and 12CO (4,2), were measured for the stars that showed cross-correlation peaks with the K0-III standard (S0-17 and S0-18), at the appropriate wavelengths determined by the velocity shift of the peak of the cross-correlation. Absorption strengths were also measured for the sky at those wavelengths to estimate upper limits on absorption strengths due to systematic errors. Absorption strengths for the CO bandheads, [(1 - FCO/Fcont) x 100], were measured using a bandwidth of = 0.0055 m for the CO absorption and continuum fluxes, where the continuum was measured to the left of the first CO bandhead at 2.29 m , in order to match the methods used in the Kleinmann and Hall (1986) 2.0 - 2.5 m spectral atlas of late-type standard stars. The spectra were divided by the slope of the continuum from 2.00 to 2.29 m before measuring absorption strengths, so that the slopes of the spectra would be comparable to the flat spectra in Kleinmann and Hall (1986) which were directly ratioed by a telluric reference star that was not corrected for its continuum. The statistical error in the absorption strength measurements was estimated by the jack-knife resampling method. Figure 8 shows the CO bandhead absorption strengths with 1 error bars for S0-17 and S0-18, in comparison to the sky for that night of observations, the observed K0-III standard HD 203638 (plotted with diamonds), and the K0-III standard i Cep from Kleinmann and Hall (1986) (plotted with triangles). Table 2 lists the absorption strengths measured for S0-17 and S0-18.
S0-17 and S0-18 both have significant 12CO (2,0), 12CO (3,1), and 12CO (4,2) absorption strengths consistent with a K0 giant (within 3 ) as measured for both the Kleinmann and Hall (1986) K0-III standard, and the K0-III standard observed in this analysis. The CO absorption cannot be attributed to systematic errors, since the sky background demonstrates very little or no absorption at these same wavelengths. The absorption strength measurements, in combination with the cross-correlation peaks with the K0-III giant spectrum, are suggestive evidence that S0-17 and S0-18 are in fact late-type giants. The other sources, S0-1, S0-2, and S0-16, have higher signal-to-noise spectra than S0-17 and S0-18, and are uncorrelated with the K0-III spectrum, strongly suggesting that these stars lack CO bandhead absorption, and therefore do not appear to be late-type stars.
4.2 Early-type spectral features: He I and
In addition to a lack of CO bandhead absorption, early-type main sequence stars can be identified by their He I absorption lines at 2.058 m and 2.113 m , and H I Br absorption line at 2.166 m . In the Hanson et al. (1996) 2 m spectral atlas of hot, luminous stars, the strongest feature in the K-band spectra of late O - early B main sequence stars is the H I Br absorption line. This also appears to be the line most sensitive to stellar temperature, as the Br absorption equivalent width monotonically increases from 1 for an O5 star up to 7 for a B5 star. The He I lines at 2.058 m and 2.113 m , on the other hand, have weak absorption equivalent widths ( 1 ) in this range of spectral types, and their strengths do not have an obvious dependence on temperature. In the spectral class range we are interested in for the Sgr A* Cluster, the Br line appears to be the most useful diagnostic for spectral classification. Unfortunately, the Sgr A* Cluster spectra are heavily contaminated at 2.166 m by Br emission from ionized gas in the region. This is demonstrated in the 2D spectrum on June 20 and June 21 (Figure 4), where Br is seen in emission across the spectrum. At this spectral resolution, we cannot separate out any Br absorption intrinsic to the Sgr A* Cluster stars that may be veiled by the strong background gas emission. We can, however, estimate the strength of the stellar Br line by first subtracting out the flux of Br emission from the sky background, and then measuring the residual flux in the stellar spectrum. The Br line equivalent widths were measured at 2.166 m using a bandwidth of = 0.02 m , in order to allow for doppler shifts of the lines from the rest wavelength of up to 1500 km/s. Table 2 lists the resulting Br line equivalent widths measured for the Sgr A* Cluster stars after the line emission from the sky has been subtracted out, with 1 error bars determined by the jack-knife resampling method.
Within 2 , S0-17 and S0-18 do not demonstrate Br absorption in their spectra, consistent with their classification as early K giants. A suggestion of residual Br emission can be attributed to the incomplete removal of contributions from the background gas emission. The spectra of stars lacking CO absorption, S0-1, S0-2, and S0-16, have Br equivalent widths that are within the range measured for late O - early B main sequence stars (within 2 ). However, given the large errors in the equivalent widths measured for the Sgr A* Cluster stars, 1 2, and the uncertainties in subtraction of the background gas contamination, the Br measurements are not statistically significant and therefore are not conclusive enough to classify or rule out that these stars are early-type. In addition, difficulties in measuring lines in this region of the spectrum arise from uncertainties in the removal of the Br absorption line in the telluric standard spectrum. Hanson et al. (1996) emphasize that this is their largest source of systematic error in their Br line equivalent widths.
The He I 2.058 m line is also contaminated by emission from background ionized He I gas. However, even without the difficulties introduced by background gas emission, both He I lines at 2.058 m and 2.113 m have absorption strengths in normal stars that are intrinsically too low to be detected in the Sgr A* Cluster spectra, which have equivalent width errors up to 3 . The very low signal-to-noise ratios of the Sgr A* Cluster spectra, and the strong contamination by background gas emission makes identification of early-type spectral features intrinsic to the stars in the spectra infeasible at this time.
5 Discussion & Conclusions
The velocities of the Sgr A* Cluster stars can be used to determine an upper limit to their current distances from the central black hole by assuming that the stars are in a bound orbit, and thus that r 2GMbh/v2. Combining the radial velocities for S0-17 and S0-18 reported in Table 2, with their proper motions (Ghez et al. 2002), we derive three-dimensional velocities of 730 and 320 km/sec, respectively, which bounds their positions to within 0.04 and 0.22 pc. This makes them both likely members of the Sgr A* Cluster, which has a projected radius of 0.02 pc.
The three dimensional velocities measured for S0-17 and S0-18 cannot be used to better constrain the density of the enclosed central dark mass, because their radial distances are greater than the smallest radius of 0.015 pc measured by the proper motion experiment of Ghez et al. (1998). However, if the radial velocities of the three stars identified as early-type (S0-1, S0-2, S0-16) could be measured with future higher spectral resolution spectroscopy sensitive to the He I and Br absorption lines expected to be present in these stars, then their 3D velocities could constrain the central dark mass density down to radii 0.0075 pc, and further establish the configuration of the central dark matter distribution as a central supermassive black hole, as opposed to a cluster of stellar remnants, or other more exotic forms of dark matter.
The lack of CO bandhead absorption in the moderate resolution spectra of S0-1, S0-2, and S0-16 is direct evidence that these stars are not late-type stars, and with their absolute K magnitudes, that they may be late O - early B main sequence stars with ages less than 20 Myr. The existence of young stars in the immediate vicinity of a central supermassive black hole is surprising, considering the extreme conditions expected to inhibit star formation in such an environment. Morris (1993) discusses how the strong magnetic fields ( mG), large turbulent velocities (v 10 km/s), high temperatures, and the large tidal forces induced by the central black hole in the Galactic Center would only enable star formation in gas clouds of very high densities. Gas near the Galactic Center would have to be compressed to densities 5 orders of magnitude higher than the densities currently inferred for nearby gas in order to avoid tidal disruption and be able to gravitationally collapse to form stars. Such a large density might be accomplished by a violent compression of gas clouds caused by cloud collisions, stellar winds, supernova shocks, or the violent release of accretion energy by the black hole. Alternatively, the presence of early-type stars in the Sgr A* Cluster might be explained by dynamical friction acting on a massive young star cluster which formed at a substantial distance from the black hole and which migrates into the central parsec on a time scale less than the lifetime of these relatively massive stars (Gerhard 2000, Kim & Morris 2002).
K-band spectra of five stars in the Sgr A* Cluster demonstrate that this concentration of faint stars mainly contains young, late O - early B main sequence stars, consistent with the low spectral resolution results of Genzel et al. (1997) and the low spatial resolution results of Eckart et al. (1999) and Figer et al. (2000), along with a small number of older K giants. The close proximity of the young stars in the Sgr A* Cluster to the 2.6 x 10⁶ M☉ black hole, is an interesting challenge for either star formation theory or dynamical theory. In either case, more can be learned about the star formation history of the Galactic Center, and about the detailed dark mass distribution there, if the spectral types and radial velocities of the Sgr A* Cluster stars can be unambiguously determined. This may be possible with future, higher spectral resolution adaptive optics spectroscopy.
References
- Babu & Feigelson (1996) Babu, G.J. & Feigelson, E.D. 1996, Astrostatistics, London Chapman and Hall
- Blum et al. (1996) Blum, R.D., Sellgren, K., & DePoy, D.L. 1996, ApJ, 112, 1988
- Eckart et al. (1999) Eckart, A., Ott, T., & Genzel, R. 1999, A&A, 352, L22
- Figer et al. (2000) Figer, D.F. et al. 2000, ApJ, 533, L49
- Genzel et al. (1997) Genzel, R., Eckart, A., Ott, T., & Eisenhauer, F. 1997, MNRAS, 291, 219
- Gerhard (2000) Gerhard, O. 2000, ApJ, 546, L39
- Ghez et al. (1998) Ghez, A.M., Klein, B.C., Morris, M., & Becklin, E.E. 1998, ApJ, 509, 678
- Ghez et al. (2000) Ghez, A.M., Morris, M., Becklin, E.E., Tanner, A., & Kremenek, T. 2000, Nature, 407, 349
- Ghez et al. (2002) Ghez, A.M. et al. 2002, in preparation
- Hanson et al. (1996) Hanson, M.M., Conti, P.S., & Rieke, M.J. 1996, ApJS, 107, 281
- Kim & Morris (2002) Kim, S.S., & Morris, M. 2002, in preparation
- Kleinmann & Hall (1986) Kleinmann, S.G., & Hall, D.N.B 1986, ApJS, 62, 501
- Krabbe et al. (1995) Krabbe, A. et al. 1995, ApJ, 447, L95
- Larkin (1996) Larkin, J. 1996, Ph.D. thesis, California Institute of Technology
- McLean et al. (1998) McLean, I.S. et al. 1998, Proc. SPIE, 3354, 566
- McLean et al. (2000) McLean, I.S. et al. 2000, Proc. SPIE, 4008, 1048
- Morris (1993) Morris, M. 1993, ApJ, 408, 496
- Paumard et al. (2000) Paumard, T., Maillard, T.P., Morris, M., & Rigaut, F. 2000, A&A,
- Reid (1993) Reid, M.J. 1993, ARA&A, 31, 345
- Sanders (1992) Sanders, R.H. 1992, Nature, 359, 131
- Wizinowich et al. (2000) Wizinowich, P. et al. 2000, Proc. SPIE, 4007, 2
| Source | r (”)aaProjected distance from Sgr A*. | K (mag) | Date | Total tint (min) | S/Npix |
|---|---|---|---|---|---|
| S0-1 | 0.11 | 14.9 | 21 June | 100 | 21 |
| 22 June | 80 | 9 | |||
| S0-2 | 0.15 | 14.1 | 21 June | 100 | 25 |
| 22 June | 80 | 10 | |||
| S0-16 | 0.046 | 15.3 | 20 June | 45 | 18 |
| S0-17 | 0.21 | 16.0 | 20 June | 45 | 17 |
| S0-18 | 0.44 | 15.1 | 21 June | 100 | 15 |
| 22 June | 80 | 9 | |||
| Sky | 0.37 | - | 20 June | 45 | 12 |
| 0.44 | - | 21 June | 100 | 12 | |
| 0.30 | - | 22 June | 80 | 9 |
| Star | Br EWaaEquivalent widths measured after flux from background gas emission was subtracted out. Positive equivalent widths indicate absorption, negative equivalent widths indicate emission. | 12CO(2,0) AS | 12CO(3,1) AS | 12CO(4,2) AS | SpectralbbSpectral type determined by the presence (late-type) or lack (early-type) of CO bandhead absorption. | Radial Velocity |
|---|---|---|---|---|---|---|
| () | [(1-FCO/Fcont)x100] | [(1-FCO/Fcont)x100] | [(1-FCO/Fcont)x100] | Type | (km/s) | |
| S0-1 | 0.64 1.22 | - | - | - | early | - |
| S0-2 | 1.27 2.04 | - | - | - | early | - |
| S0-16 | 1.03 1.91 | - | - | - | early | - |
| S0-17 | -3.60 2.25 | 11.35 2.50 | 14.76 1.35 | 10.14 1.96 | late | -66 17 |
| S0-18 | -1.15 1.67 | 13.53 2.48 | 10.00 1.80 | 8.93 3.01 | late | -76 13 |