Bulges on the Fundamental Plane of Early-Type Galaxies
Abstract
In an ongoing effort to study the formation and evolution of galactic bulges we have investigated the position of 19 bulges of type S0-Sbc on the fundamental plane (FP). We find that bulges, both in and band, lie close to but slightly below the FP defined by ellipticals and S0s, i.e. are slightly brighter. There are hints that bulges of later morphological type are situated below the other bulges in our sample. The FP results are consistent with the picture, obtained from our recent analysis of HST-colours, that bulges are old, except for the Sbc galaxies. The fact that bulges lie so close to the FP of ellipticals and S0s implies that their formation epoch must have been similar, at most about 2.5 Gyr earlier, than cluster Es and S0s, and and that the surrounding disk does not significantly affect their structure.
keywords:
galaxies: bulges – galaxies: fundamental parameters – galaxies: individual(NGC5326, NGC5389, NGC5422, NGC5443, NGC5475, NGC5587, NGC5689, NGC5707, NGC5719, NGC5746, NGC5838, NGC5854, NGC5879, NC5965, NGC6010, NGC6504, NGC7332, NGC7457, NGC7537)1 Introduction
It has been known for almost 15 years that early-type galaxies obey a tight relation linking their structure with their kinematics. Originally discovered by Djorgovski & Davis [1987] and Dressler et al. [1987], the Fundamental Plane (FP) establishes that the effective radius (), the mean effective surface brightness () and the central velocity dispersion () are related by
The FP is one of the main scaling relations for early-type galaxies (e.g. Pahre, Djorgovski & de Carvalho 1998, hereafter P98). The fact that, compared to other relations, its scatter is so small, has made it a useful distance indicator (Jørgensen, Franx & Kjærgaard 1996, hereafter J96). Historically, the FP is a refinement of the Faber-Jackson [1976], relation between galaxy luminosity and , which includes the dependency of luminosity and on surface brightness (Kormendy [1985]).
Much work has been devoted to determining the exponents and . The virial theorem predicts and . However, observations show lower values of and higher values of (Busarello et al. 1997). The value has been well determined to be (P98, J96). , usually referred to as the ’tilt’ of the FP (P98), has values that vary significantly depending on the band employed. Several mechanisms are likely to produce the difference between observations and the Virial Theorem prediction: age and metallicity, shape of the light profiles [1993, 1997, 1994, 1997] variations in the initial mass function (IMF) or even the dark matter distribution in galaxies [1993, 1996].
Beyond its value as a distance indicator, the FP contains useful clues on the physics of galactic systems. The position of galactic bulges on the FP of elliptical galaxies provides information about the differences in stellar populations, internal structure and kinematics of both types of galaxies. In a series of papers, Prugniel & Simien (1994, 1996, 1997) have gone into the details of using the FP for this purpose. Assuming that the FP is a representation of the Virial Theorem , and that the mass-to-light ratio scales as , these authors obtain the relation between observables . In their picture, this relation is tight for old elliptical galaxies, since for them is a good mass-indicator, and is a smooth function of L, probably metallicity-driven. Deviations to the relation can be due to the presence of young stellar populations (causing a change in , see also Schweizer & Seitzer 1992), rotational support (since in this case gives an underestimate of the gravitational energy), or differences in structure, for example indicated by the shape of the surface brightness profile.
One of the first papers addressing the position of bulges on the FP is the study of Bender, Burstein & Faber (1992, hereafter B92). They present -band FP properties for a large sample of dynamically hot galaxies, which they divide into several groups, referred to as Es, intermediate Es, compact Es, bulges, bright dwarf ellipticals and dwarf spheroidals. B92 conclude that bulges lie preferentially below the FP of ellipticals, suggesting that, on average, bulges are younger than ellipticals. Most (17 out of 19) of the bulges in B92 are in lenticular galaxies. In a related study using a sample of galaxies from the Coma cluster Saglia, Bender & Dressler [1993] find a small shift in the same direction in the location of bulges when compared with Es and S0s (0.1 in log() in B-band). In contrast with these findings, J96, in their comparison between the FP of 10 clusters, find a negligible difference between E and S0 galaxies ( in B-band), a result shared by Prugniel & Simien [1996].
The FP of bulges is more complicated to study than that of elliptical galaxies, since a determination of structural parameters requires a decomposition of the light into bulges and disks, as well as to take into account dust reddening and extinction. These problems only worsen as we move to later types. Perhaps as a result of this, very little information is available about the FP of bulges of types later than S0. This paper intends to fill this gap by presenting a study of the FP of bulges for types ranging from S0 to Sbc. It belongs to a series of papers discussing the properties of galactic bulges. The first paper [1994] discusses optical colours and colour gradients of an optically selected, complete, sample of 50 bulges of type S0-Sbc. The galaxies were required to have an inclination i 50o to minimize the amount of disk light which projects onto the bulge and ensure that extinction from dust in the disk does not dominate the colours measured on one side of the bulge. Of this sample, 30 galaxies for which the colour profiles were smooth on one side of the bulge (i.e. where the colours were not significantly affected by dust extinction) were observed in the near-infrared -band at higher spatial resolution. Andredakis, Peletier & Balcells (1995, hereafter APB95) present a photometric decomposition into bulge and disk, using Kent’s (1986) model-independent method, after which Sérsic r1/n laws are fitted to the bulge. They find that the Sérsic law generally fits very well, and that there is a good correlation between and morphological type, such that bulges of early-type spiral galaxies follow the r1/4 law, while profiles of late type spirals are more nearly exponential. Optical and near-infrared colours of bulges are presented in Peletier & Balcells [1996]. Photometric data for this sample, including colour profiles along major and minor axis and fits of ellipticity and position angle as a function of radius, are presented in Peletier & Balcells (1997, hereafter PB97). Central color profiles, based on HST/WFPC2 and NICMOS imaging of a subsample of 20 of our galaxies, are analysed in Peletier et al. [1999]. The latter paper concludes that all bulges, except those of Sbc’s, are old with an age spread of less than 2 Gyr. The present paper makes use of our own spectroscopy of the sample to address the position of bulges on the FP of elliptical galaxies. A full report of the kinematic properties derived from the spectroscopy will be given in a forthcoming paper.
When analyzing bulges, several authors have made the assumption that bulges’ surface brightness profiles are either or exponential [1996], a dichotomy of shapes that would suggest a dichotomy of formation processes. Carollo [1999] also divides bulges into and exponential classes in her study of galaxy nuclei. In our work we define and characterize a bulge on the basis of its signature in the galaxy’s ellipticity profile, rather than on the shape of the surface brightness profile. We thus avoid having to assign each bulge to a given profile class, and indeed we find a continuum of profile shapes, which we model with Sérsic’s law with free index , rather than two separate classes. Because our sample includes objects ranging from exponential to , our FP study should uncover any structural and population signatures that depend on the shape of the surface brightness profile.
Section §2 summarises the observations and data reduction as well as procedures to derive the different structural and kinematic parameters. In §3 we show the FP in the different bands and compare the results with other authors. The Mg2 - relation is analysed in §4. Possible correlations between observables and the residuals of the FP are studied in §5. Throughout the paper we use a Hubble Constant of =50 km s-1Mpc-1.
2 Observations & Data Reduction
2.1 Observations
We obtained long-slit spectra of our sample galaxies at the 4.2m William Herschel Telescope of the Observatorio del Roque de los Muchachos at La Palma between 11 and 13 July 1997. Nineteen galaxies were observed (see Table 1). All galaxies were observed between 3660 - 5560 Å and between 8360 - 9170 Å using the ISIS blue and red arms, respectively. The red arm was equipped with the Tektronix (10241024) TEK2 CCD (0.36” per 24 m pixel) and the R600R grating, giving a spectral resolution (FWHM of arc lines) of 1.74 Å(60 km/s). The blue arm was equipped with the Loral (20482048) LOR2 CCD, (15 m pixels, 0.22 ”/pixel) and the R300B grating, giving a spectral resolution of 4.1 Å. We used the 6100 Å dichroic for simultaneous red and blue arm exposures. Typical exposure times per galaxy were 1500 sec in both wavelength ranges. The slit width was 1.2”, matching the seeing at the time of the observations. Arc line exposures were taken before and after each target exposure. Tungsten continuum lamp exposures were taken with the red arm after each target exposure, for fringe calibration. Twilight sky exposures were taken every night for flat fielding. We took spectra of spectral templates of types A2 to M5, from the Lick list of stars [1994].
| NGC | VLG | Scale | S/N | T | Mg2,0 | |||||||
|---|---|---|---|---|---|---|---|---|---|---|---|---|
| km/s | kpc/arcsec | arcsec | mag arsec-2 | arcsec | mag arsec-2 | pix | mag | |||||
| (1) | (2) | (3) | (4) | (5) | (6) | (7) | (8) | (9) | (10) | (11) | (12) | (13) |
| 5326 | 2576 | 0.25 | 1.87 | 13.88 | 2.40 | 18.14 | 2.216 | 84 | 2.19 | 1 | 0.55 | 0.291 |
| (0.016) | (0.45) | |||||||||||
| 5389 | 1990 | 0.19 | 3.23 | 14.94 | 3.98 | 19.19 | 2.056 | 62 | 3.07 | 0 | 0.75 | 0.275 |
| (0.023) | (0.24) | |||||||||||
| 5422 | 1929 | 0.19 | 3.63 | 14.78 | 4.44 | 18.97 | 2.205 | 69 | 3.07 | -2 | 0.80 | 0.307 |
| (0.016) | (0.20) | |||||||||||
| 5443 | 2060 | 0.20 | 3.85 | 15.69 | 4.94 | 19.80 | 1.881 | 38 | 2.86 | 3 | 0.72 | 0.240 |
| (0.046) | (0.35) | |||||||||||
| 5475 | 1861 | 0.18 | 2.43 | 14.83 | 3.12 | 18.91 | 1.960 | 57 | 2.52 | 1 | 0.71 | 0.239 |
| (0.029) | (0.25) | |||||||||||
| 5587 | 2291 | 0.22 | 1.76 | 15.13 | 2.05 | 19.02 | 1.967 | 36 | 1.53 | 0 | 0.70 | 0.259 |
| (0.038) | (0.21) | |||||||||||
| 5689 | 2290 | 0.22 | 6.86 | 15.39 | 9.77 | 20.04 | 2.155 | 59 | 5.90 | 0 | 0.75 | 0.275 |
| (0.018) | (0.62) | |||||||||||
| 5707 | 2354 | 0.23 | 3.10 | 14.71 | 3.49 | 18.50 | 2.149 | 52 | 1.30 | 2 | 0.75 | 0.257 |
| (0.019) | (0.27) | |||||||||||
| 5719 | 1684 | 0.16 | 2.77 | 14.69 | 4.47 | 19.98 | 2.034 | 52 | 2.26 | 2 | 0.68 | 0.212 |
| (0.024) | (0.10) | |||||||||||
| 5746 | 1677 | 0.16 | 11.00 | 15.57 | 17.43 | 20.55 | 2.144 | 45 | 4.10 | 3 | 0.83 | 0.324 |
| (0.025) | (0.43) | |||||||||||
| 5838 | 1337 | 0.13 | 6.66 | 14.56 | 8.05 | 18.83 | 2.407 | 86 | 4.04 | -3 | 0.63 | 0.319 |
| (0.010) | (0.34) | |||||||||||
| 5854 | 1708 | 0.17 | 5.04 | 15.53 | 5.09 | 19.14 | 1.986 | 65 | 4.12 | -1 | 0.70 | 0.191 |
| (0.027) | (0.47) | |||||||||||
| 5879 | 1065 | 0.10 | 1.90 | 15.68 | 2.99 | 20.11 | 1.761 | 42 | 2.21 | 4 | 0.70 | 0.190 |
| (0.060) | (0.31) | |||||||||||
| 5965 | 3603 | 0.35 | 6.26 | 15.77 | 8.50 | 20.12 | 2.210 | 46 | 3.29 | 3 | 0.83 | 0.230 |
| (0.021) | (0.26) | |||||||||||
| 6010 | 1923 | 0.19 | 2.10 | 13.76 | 2.71 | 17.85 | 2.157 | 68 | 2.21 | 0 | 0.77 | 0.297 |
| (0.018) | (0.34) | |||||||||||
| 6504 | 4680 | 0.46 | 3.86 | 15.21 | 4.21 | 19.35 | 2.266 | 53 | 2.59 | 2 | 0.80 | 0.347 |
| (0.014) | (0.36) | |||||||||||
| 7332 | 1550 | 0.15 | 2.99 | 12.97 | 3.66 | 16.91 | 2.051 | 102 | 4.48 | -2 | 0.75 | 0.259 |
| (0.015) | (0.27) | |||||||||||
| 7457 | 1114 | 0.11 | 6.68 | 16.50 | 8.28 | 20.53 | 1.749 | 52 | 6.24 | -3 | 0.48 | 0.191 |
| (0.046) | (1.44) | |||||||||||
| 7537 | 2717 | 0.26 | 1.28 | 15.69 | 1.52 | 19.62 | 1.619 | 23 | 0.89 | 4 | 0.66 | 0.155 |
| (0.094) | (0.19) |
Notes: Photometric errors in columns (5) and (7) are 0.05 and 0.08 mag respectively (PB97). For definition of log() and Mg2,0 see text.
2.2 Spectroscopic Parameters
2.2.1 Spectral Data Reduction
The data were reduced following standard steps using the IRAF package. Each individual frame was divided by a flatfield, taken at the same position, after a bias frame had been subtracted. We subtracted the sky using the outer regions of the 4′ long slit, and removed the cosmic rays using the package [1999]. The data were calibrated in wavelength, with an RMS error in the calibration solution of 0.1 Å in the blue and 0.02 Å in the red arm. Finally the data were calibrated in flux using standard stars BD+284211 [1990] and BD+174708 [1983].
2.2.2 Derivation of kinematic parameters
Kinematic parameters were derived from data in the region of the IR Ca II triplet (8498 Å, 8542 Å, 8662 Å) in the red arm spectra. We worked with coadded spectra covering the central 3 pixels of each long-slit galaxy spectrum, roughly 1.1 arcsec, which is a good match to the seeing conditions during the observations. Signal-to-noise ratios per pixel for these spectra are listed in Table 1. We made use of the program FOURFIT developed by van der Marel & Franx [1993], kindly made available to us by the authors. A Gaussian fit to the line-of-sight velocity distribution (LOSVD) was performed to obtain mean radial velocities and velocity dispersions. Star templates of spectral types G8III, K1IIIb, K3III and K5III, gave dispersions with rms differences around 5 km/s. We took the median value of the 4 determinations as the best estimate of the central velocity dispersions of our galaxies. Velocity dispersions results are given in column (8) of Table 1. Aperture corrections have been applied to the central velocity dispersions. We have converted a rectangular aperture (1.1 x 1.2 arcsec) to an ’equivalent circular aperture’. Then we have corrected those values to a standard aperture, in this case defined to be 1.7 arcsec at the distance of Coma (see Jørgensen et al. 1995 for more details)
The velocity dispersion errors in Table 1 are uncertainty estimates derived from simulations using FOURFIT. Simulated galaxy spectra were made by broadening a K3III star with different LOSVD, using Gaussian as well as non-Gaussian profiles, and adding white noise to yield S/N of 25, 33, 50 and 100. These simulated spectra were analyzed with three star templates of types G8III, G9VI and K3III. For each S/N we define the dispersion error as the rms of all the velocity dispersions coming from all templates as well as all LOSVDs. The error estimate thus includes contributions from S/N, template mismatch and non-Gaussian LOSVD. A complete report of the simulations that we performed will be given in a forthcoming paper that presents the full LOSVDs of the galaxies.
2.2.3 Derivation of Mg2,0
2.2.4 Derivation of distances
Distances to the galaxies were derived from optical recession velocities given in RC3 [1991], corrected to the centroid of the Local Group [1996], and assuming a uniform Hubble flow. Distance errors are therefore significant, due to the Virgocentric flow and the possible influence of the Great Atractor. We have taken 150 km/s as the error in the radial velocity. We have taken this value from the work of Aaronson et al. [1982] who studied the influence of bulk motions on a sample of spiral galaxies at distances comparable to our sample.
2.3 Photometric Parameters
2.3.1 Derivation of structural parameters in K-Band
The derivation of the structural parameters in K-band was done as follows. The -band effective radii in arcsec were obtained from APB95. These therefore were derived from Sérsic fits to -band bulge profiles after an ellipticity-based bulge-disk decomposition (see APB95 for details). The APB95 major-axis values were scaled to the geometric mean radius for direct comparison with other authors (B92, J96, P98) using ellipticity profiles from the -band ellipse fits published in PB97.
2.3.2 Derivation of structural parameters in B-Band
For the -band FP, our goal is to minimize the effects of dust extinction on
the photometry. An derived from a direct ellipse fit to the -band
image is likely to be affected by the copious dust present on one side of the
galaxy, and also in the nuclear area [1999]. We opt therefore to
derive the dust-corrected -band effective radius from
the effective radius in and the colour gradient determined on the
minor axis. The conversion was done in the following way:
We assume that our profile is of the form:
| (1) |
with [1993]. Differentiating with respect to log(r) gives:
| (2) |
Working this expression out, we get the relation between the effective radii in the two bands as:
| (3) |
where is the colour gradient taken from PB97 and . The ratio does not depend much on the power law used and depends mainly on the value of the colour gradient. Values of used in this paper are derived from eqn. 3.
Once the major and minor axis effective radii in both bands are known, we can determine the value of from the -band surface brightness at re,major,B and the colour at on the dust-free minor axis. This is valid since colour gradients on the minor axis are small (PB97). To convert from to the mean surface brightness within an effective radius we have used the relation:
| (4) |
for an r1/n law [1993].
2.4 Presentation of the Data
In Table 1 we present the data used in the analysis of the FP. In column (1) we give the New General Catalogue number [1988]. Column (2) lists the recession velocity of each galaxy in km/s, corrected to the Local Group [1996], from optical heliocentric velocities given in the RC3. Column (3) corresponds to the scale in kpc/arcsec. Column (4) gives the -band geometric effective radius in arcsec. Column (5) gives the -band central surface brightness in mag/arcsec2 within , also from APB95, the photometric errors were assumed to be 0.05 (PB97). Column (6) gives the -band effective radius, in arcsec, from eqn. 3. Column (7) is the -band mean central surface brightness within in mag/arcsec2, the photometric errors were assumed to be 0.08 (PB97). Column (8) is the logarithm of the aperture corrected central velocity dispersion in km/s and its error (see Section 2.2.2). Column (9) is the S/N per pixel of the spectrum used to determine the central velocity dispersion. Column (10) shows the parameter of the Sérsic profile and its error from APB95. Column (11) is the morphological type from the RC3. Column (12) is the disk ellipticity of the galaxy as given by APB95. Finally we tabulate in column (13) the aperture corrected central Mg2,0 index in the Lick System [1994], in magnitudes.
3 Bulges on the Fundamental Plane
We determine the FP by means of an orthogonal fit to the function,
| (5) |
We minimise the sum of the absolute deviations of the points orthogonally to the relation, using the program GAUSSFIT [1987]. We have chosen this method since it is relatively insensitive to the presence of outliers (J96, P98) and is more robust than minimizing the sum of the squares of the absolute deviations of the points.
Because of the reduced size of our bulges sample, we are not obtaining a FP solution for our objects alone. Rather, we perform fits to various combinations of our sample and other samples in the literature, namely those of J96 in the -band, and that of P98 in the K band. In order to avoid errors due to distance uncertainties between clusters, we take only a subsample of the galaxies of J96 and P98: the Es and S0s in the Coma cluster. FP differences when including our objects provide then a measure of the deviation of our bulges with respect to the FP of ellipticals and lenticulars. We minimise any dependency on the fitting method by performing our own fits to the data published by B92, J96 and P98, rather than using their FP solutions.
The results of the fits for and band data are given in Table 2. We list each parameter, its error, the number of objects employed, the rms of the solution and the rms of our bulges in each fit. We have also included in the last column the dispersion expected from observational errors; the latter is computed as described in Section 3.1. Uncertainties in the coefficients have been calculated by performing a bootstrap analysis with 1000 iterations.
| Sample | Band | N | rms | ||||
| rmsBulges | |||||||
| B92 | 1.63 | 0.27 | -8.84 | 103 | 0.185 | ||
| (0.09) | (0.02) | 0.168 | |||||
| J96(Coma) | 1.20 | 0.34 | -9.08 | 28 | 0.061 | ||
| (0.12) | (0.02) | 0.150 | 0.061 | ||||
| Common | 1.15 | 0.31 | -8.37 | 46 | 0.098 | ||
| fit | (0.15) | (0.02) | 0.136 | 0.060 | |||
| P98(Coma) | 1.38 | 0.32 | -7.85 | 64 | 0.083 | ||
| (0.20) | (0.03) | 0.128 | 0.060 | ||||
| Common | 1.30 | 0.30 | -7.31 | 82 | 0.092 | ||
| fit | (0.15) | (0.01) | 0.125 | 0.063 |
For the band, the fit corresponding to the B92 sample excludes the dwarf spheroidals. “Common Fit” denotes the fit to the 28 galaxies of the Coma cluster from J96 [hereafter J96(Coma)] and our sample. Our fitted parameters agree well with the ones given by J96 , with slightly higher uncertainties due to to the smaller number of points used.
The Coma cluster data from P98 [hereafter P98(Coma)] have been used to study the FP in the -band. We performed a new FP fit to all 64 galaxies in P98, instead of the 60 used by the authors, given the lack of information about which ones had been excluded by P98. Our P98(Coma) FP is identical to that given by P98, including the errors in the fit. The “Common fits” to the FP have the added value of extending the FP of galactic spheroids to low log(re) objects.
3.1 Error Determination
The FP fits are shown in figures 1 and 2. As usual, the errors in log() and are highly anticorrelated, with a linear correlation coefficient r of about 0.97 [1995], which implies that the error in the combination that enters the Fundamental Plane are much smaller than the individual errors in log() and . For this reason those errors are not plotted. The error in the combination was derived from a comparison with other authors (A. Graham, private communication). This gives us a mean value of =0.036. The same value has been applied for both bands. The observational error on the FP, including the uncertainties in and distance is then
| (6) |
and the intrinsic scatter can be determined as
| (7) |
Observational errors are listed in column 8 of Table 2.
An independent estimate of the measurement errors comes from comparing our data with the literature. Unfortunately we have no objects in common with P98(Coma) and J96(Coma), and only one object in common with B92: NGC 7332. For this object, while the ’s are very similar, we measure log()=0.260.042 whereas B92 give log()=0.010. For the surface brightness the values are 16.91 and 18.30 respectively. The difference in between these measurements, 0.70, is much larger than the measurement errors in either our or B92’s data. Since the effective radius of the bulge of NGC 7332 is small, one might think that a difference in seeing might have caused the difference. However, our sample contains several smaller bulges, which are lying very close to the FP, indicating that differences in seeing will not move objects away from the FP.
We decided not to consider NGC 7332 in any of the common fits since it seems to be a very peculiar object and its observational errors are not big enough to explain such deviation from the different FP relations. It hasn’t been included either in the studies of residuals of the FP with other parameters presented in following sections. This galaxy will be addressed again using, among other techniques, integral field spectroscopy in future papers.
3.2 The -band Fundamental Plane
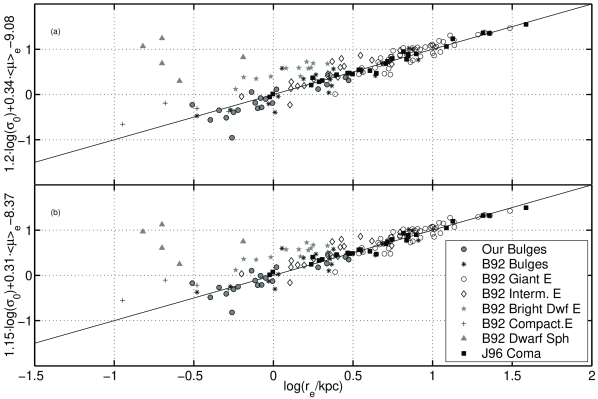
The distribution of galaxies in -band FP space is shown in Fig. 1. Two projections are given. Fig. 1a shows the view orthogonal to the J96(Coma) FP solution. Fig. 1b shows the view orthogonal to the Common Fit FP (J96(Coma) plus this work minus NGC 7332). Substantial differences are found between the two distributions. Figure 1(a) shows that our bulges fall slightly below the relation defined by the Es and S0s of J96(Coma). Other classes of objects also show global displacements with respect to the FP, resulting in the apparent thickening of the galaxy distribution as we move on to smaller sizes. To analyse the behaviour of the different classes of galaxies we have computed the mean separation from the FP for each of the object groups, by measuring the mean deviation along the log() direction (), as well as the error in the mean (). Deviations from the FP are listed in Table 3 for each of the groups in Fig. 1, and for the two FP solutions (J96(Coma), and Common). Aperture corrections are essential to the determination of the offset. Earlier determinations by us of the FP offset of bulges, which did not include aperture corrections for , yielded an insignificant offset of bulges wrt. J96(Coma) [2002].
Table 3 shows that our bulges show a 2-sigma deviation with respect to the J96(Coma) FP. The lower values for our bulge sample require a significant extrapolation of the J96(Coma) FP. The offset from the Common fit is insignificant, as expected since the bulge data are included in this fit. Interestingly, the bulges of B92 show insignificant deviations with respect to the J96(Coma), in apparent contradiction with B92’s conclusion that bulges preferentially lie below the FP. We can trace the origin of this difference to the fact that the FP of B92, while very similar to the fits shown in this paper, is slightly above the J96(Coma) FP.
The decoupling of the bright dwarf ellipticals from the rest of galaxies (a 15 result) is remarkable. This behaviour was noticed by B92 who referred to the degree of anisotropy as the trigger of the observed offset. The structural parameters of these objects are probably intermediate between larger ellipticals and dwarf spheroidals. The latter are known to be structurally different from ellipticals or bulges [1998].
We have computed the intrinsic scatter of our sample around the Common fit, along the log() direction using equation 7. We find = 0.122, which is larger than what can be accounted for by observational errors (0.060); see Table 2). This supports the idea of the existence of intrinsic scatter, not just for ellipticals, but also for bulges. We discuss clues on the origin of the intrinsic scatter in Section 5.1.
| Group | J96(Coma) | Common fit | ||
|---|---|---|---|---|
| Our Bulges | 0.074 | 0.033 | -0.008 | 0.032 |
| B92 Bulges | 0.015 | 0.049 | -0.026 | 0.045 |
| B92 Es | -0.049 | 0.018 | -0.060 | 0.018 |
| B92 DwfEs | -0.413 | 0.027 | -0.406 | 0.026 |
| B92 DwfSph | -1.423 | 0.217 | -1.340 | 0.206 |
| J96(Coma) | -0.003 | 0.012 | -0.013 | 0.012 |
Notes: is the mean deviation in the log() direction (). is the error in the mean.
3.3 The -Band Fundamental Plane
We have obtained the position of bulges on the -band FP following the same procedures used for the -band FP. Our reference elliptical and S0 sample here is the Coma sample of P98 (P98(Coma)). The distribution of galaxies in FP space is shown in Fig. 2. As for the -band FP, two projections are shown, one orthogonal to the P98(Coma) elliptical FP (Fig. 2a), and one orthogonal to the Common fit FP (P98(Coma) plus our bulges minus NGC 7332; Fig. 2b).
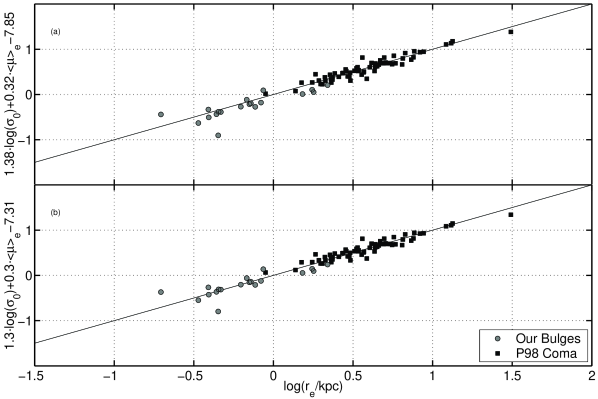
Figure 2 shows that our bulges define a slightly displaced sequence with respect to the -band FP of Coma ellipticals, extending the FP almost one decade in radius toward low-mass spheroids. The most deviant point is NGC 7332. Its offset with respect to the FP is unexplained by measurement errors.
The FP offsets of our bulges with respect to the P98(Coma) and the Common FP’s, computed as described in Section 3.2, are given in Table 4. The deviations again are significant when using the P98(Coma) FP solution. These results highlight the displacement of bulges to cluster ellipticals in the band.
Again, the scatter of our sample around the Common fit in the -Band, along the log() direction turns out to be larger (0.125) than the dispersion of our bulges on the FP due to uncertainties in the observational parameters (0.063) (see Section 3.1), implying that we find an intrinsic scatter in the -band of 0.108. The fact that our intrinsic scatter in both bands is almost equal implies that for our sample stellar population differences are not responsible for most of the scatter, since this would lead to much larger scatter in . We would like to remark that there is a strong paucity of FP data for low velocity dispersion galaxies ( km/s), also ellipticals and S0s, and especially in the field, a likely consequence of the relatively recent arrival of large-format IR detectors. Measuring the intrinsic scatter of the FP in the -band as well as better constraining any offsets of bulges with respect to the FP of ellipticals will require data for significantly larger samples.
| Group | P98(Coma) | Common fit | ||
|---|---|---|---|---|
| Our Bulges | 0.054 | 0.029 | -0.006 | 0.029 |
| P98(Coma) | 0.002 | 0.010 | -0.007 | 0.010 |
Notes: The mean separation () has been determined by measuring the mean deviation along the log() direction (). is the error in the mean.
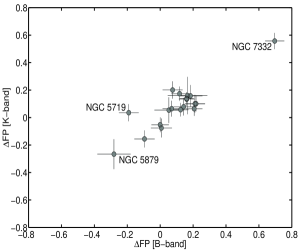
In Figure 3 we have plotted the residuals of the fundamental plane in the -band against the residuals in the -band for the J96(Coma) and P98(Coma) fits. Residuals are correlated, something which we expect from the way these quantities were calculated. The most extreme objects are NGC 7332 and NGC 5879. A third outlier is NGC 5719. If a deviation from the plane is caused by dust, the object in this diagram will lie on the left of the origin. Based on previous work, we don’t think that dust extinction is affecting either of these 2 galaxies. The reason is the way that our fundamental plane parameters have been determined. Instead of measuring the effective radius and the surface brightness in we used the values in and corrected them using the colour at re,K and a constant colour gradient (see Section 2.3.2), determined in the region where we decided, based on the flatness of the colour profile, that extinction was not important. In PB97 this region was determined to be the region outside 3′′ for NGC 5719 and outside 1.5′′ in NGC 5879. This method should in principle work as long as re,K would lie outside the dusty region. In fact, re,K = 2.77′′ for NGC 5719 and 1.90′′ for NGC 5879, both at the border of the dustfree regions, showing that the FP parameters for these 2 galaxies are barely affected. If the deviation is due to young stellar populations, the object would lie right of the origin. The fact that there are no objects situated here shows that the sample does not contain object within significant amounts of young stars in the bulge. The fact that for NGC 7332 the deviations are so similar shows that the deviations might be related to the details of the stellar distribution, non-homology, or other factors. For NGC 5879, a small galaxy, the error in its velocity dispersion is so large that little can be concluded. (Section 2.2.2).
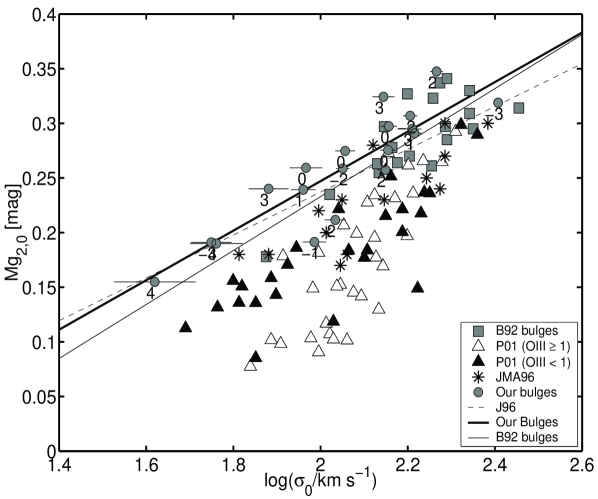
4 The Mg2,0 - () Relation
It is well known that the absorption line index Mg2,0 correlates strongly with velocity dispersion [1981, 1993]. This relation can be interpreted as a mass-metallicity dependence (e.g. Schweizer & Seitzer 1992, Prugniel & Simien 1996). Since, according to them, in early-type systems deviations are generally attributed to the presence of young stars, this relation can identify young stellar populations as producers of the scatter around the FP. We have determined this relation for our sample of bulges as well as for a number of samples in the literature (Fig. 4).
The thick solid line corresponds to a least squares fit to our points, while the thin solid line is a standard least squares fit to the bulges of B92 (solid squares). The dashed line is the fit given by J96 for Es and S0s. The coefficients of the fits are given in Table 5. We have also included the data of Prugniel, Maubon & Simien (2001, hereafter P01), a sample of 89 bulges, mostly of spiral i.e. non-S0 galaxies. These bulges can be split into 2 subsamples: open triangles are bulges with EW(OIII)1, filled triangles are bulges with EW(OIII)1. Finally we have also added the bulges from Jablonka, Martin & Arimoto (1996, hereafter JMA96) (asteriscs).
We first try to explain the difference between the position of our bulges and the ellipticals and S0s of J96. In the picture that the Mg2 – relation describes the dependence of metal enrichment on the depth of the gravitational potential, the position of bulges above the relation of ellipticals may be taken as a horizontal offset to the left – underestimating the binding energy by not including the rotation. The contribution of rotation to may be estimated as [1994]. An offset of 0.014 in Mg2 can be brought back onto the J96 relation by an offset of 0.071 in . A mean V/ of 0.5 suffices to bring the points back on the Mg2 - relation. We conclude that non-inclusion of the rotation alone could explain the offset of our bulges sample from the Mg-sigma relation of old ellipticals.
Fig. 4 also shows that there are significant differences between the various samples of bulges. To establish the nature of them we have compared the observables for objects in common with these authors (see Table 6). For Mg2 the average differences are 0.010 0.006 (RMS) for B93, –0.013 0.013 for T98 and –0.024 0.006 for Golev et al. The first 2 are consistent with the systematic error of the Lick system of 0.008 (Worthey et al. 1994). We conclude that the Mg2 values of P01 might be underestimated, leading to an offset in Fig. 4. One should note that, although the data of Golev et al. (1999) and Simien & Prugniel (1997), used in Table 6, were calculated in the large Lick-aperture, the data of Fig. 4 have been corrected to the much smaller physical aperture of 0.4 kpc, so that the real difference between our sample and P01 in Fig. 4 is probably larger. Subtle differences in sample selection may contribute to the differences in Mg2 , despite the similar Hubble-type distributions and the ranges in in our and P01’s bulges. Our sample selection did exclude very dusty bulges (Balcells & Peletier 1994, Peletier et al. 1999). This might have biased our sample toward bulges without ongoing star formation. On the other hand, our sample is less affected by dust optical depth effects on Mg2 and on , as well as from disk contamination, which probably affected the measurements of P01. Thus our sample allows more accurate measurements of stellar population diagnostics, but at the price of potentially excluding the youngest objects. We note nevertheless that our two Sbc bulges, at the low- end of the distribution, fall right on the relation of old ellipticals; these objects are moderately dusty. For log() the average differences are 0.066 0.013 (RMS) for B92, 0.084 0.074 for T98 and 0.070 0.025 for Golev et al. It appears that our velocity dispersions are consistently lower that the values in the literature. We think this might be due to the fact that our dispersions were calculated using minor axis spectra, while all others used major axis spectra. This means that in our case we did not suffer from possible rotation, which would tend to broaden the spectra. The shift of 0.07 in the direction proposed above to bring the bulges onto the J96 relation would bring our datapoints toward those of P01, but a much larger shift would be required to explain the whole difference. The data of Jablonka et al. (1996) fall in between us and P01, and could be considered consistent with us (given the uncertainties in the zero point of the Lick system and the above mentioned shift of 0.07 in the log() direction).
Another important point to see from Fig. 4 is that the slope of all three bulge samples is steeper than that of J96 for Es and S0s. The traditional way to explain this is that low velocity dispersion galaxies contain a larger fraction of young stellar populations (P01). This can be confirmed if, e.g., the galaxies furthest away from the FP of ellipticals have the latest morphological type. For our sample the answer is not clear. While the 2 galaxies with type 4 are situated the most below the FP, no trend is visible for the others. For the bulges of P01, the Mg2,0 deficit with respect to ellipticals is very pronounced, especially so for galaxies with strong [OIII] emission, indicating significant amounts of ionised gas. If one assumes that ionised gas traces ongoing star formation one can understand their position in the Mg2 relation as due to young stars diluting the Mg2 index. For this reason P01 called the Mg2,0 – relation a mass-metallicity relation for bright ellipticals, becoming gradually a mass-age relation as one goes to fainter objects. Under this view of the Mg2 relation, Figure 4 is interpreted as indicating that the young-star contents of our bulges is much lower than in the P01 sample, and comparable to that of S0’s of B92. If indeed low Mg2 values are due to dilution by a young stellar continuum, the Mg2 distribution for our bulges argues against a mass-age relation for small objects.
| Group | a | a | b | b |
|---|---|---|---|---|
| J96 | 0.196 | 0.016 | 0.257 | |
| B92 Bulges | 0.247 | 0.045 | 0.258 | 0.008 |
| Our Bulges | 0.237 | 0.030 | 0.271 | 0.006 |
| P01 (OIII1) | 0.447 | 0.060 | 0.183 | 0.007 |
| P01 (OIII1) | 0.238 | 0.033 | 0.201 | 0.006 |
Notes: Different fitting coefficients of the Mg2,0 - log() relation, defined as Mg2,0=a [() 2.1]+b
| Galaxy | Parameter | Us | B93 | T98 | G99/SP97 |
|---|---|---|---|---|---|
| NGC 5422 | Mg2 | 0.307 | 0.323 | ||
| NGC 5854 | Mg2 | 0.191 | 0.160 | 0.174 | |
| NGC 7332 | Mg2 | 0.259 | 0.263 | 0.253 | 0.225 |
| NGC 7457 | Mg2 | 0.191 | 0.189 | 0.171 | |
| NGC 5422 | log() | 2.205 | 2.258 | ||
| NGC 5854 | log() | 1.986 | 2.170 | 2.017 | |
| NGC 7332 | log() | 2.051 | 2.130 | 2.114 | 2.117 |
| NGC 7457 | log() | 1.749 | 1.756 | 1.863 |
Notes:
B93: Bender, Burstein, & Faber 1993.
T98: Trager et al. 1998.
G99: Golev et al. 1999 [for Mg2]
SP97: Simien & Prugniel 1997 [for log()]
5 Discussion
In the past bulges of spirals have been difficult galactic components to study. This has been due to the presence of dust, the accompanying disk, and the fact they are generally small, so that very often ground-based observations are affected by lack of resolution. The appearance of the Hubble Space Telescope in the 1990s has vastly improved the situation. Peletier et al. [1999] performed a detailed study of galactic bulges using NICMOS observations, giving as a result a much more detailed insight of ages and dust in these objects than was known before. The main conclusions from this work are that early-type bulges (S0-Sb) behave like ellipticals and seem to be as old as cluster Es with very little spread in age ( 2 Gyr). This supports the hypothesis of an early formation for bulges and ellipticals, via either dissipational collapse or early mergers. Late-type bulges (Sbc onwards) show hints of youth with respect to the early-types and could belong to a class of objects formed or transformed by secular disk evolution. In general they are smaller, younger and have lower central surface brightness. The question then is whether they fall on the same Fundamental Plane decribed by Es and S0s.
We have measured the mean separation of our bulges with respect to the FP of Es and S0s (as defined by the Es/S0s of J96(Coma)) and found a small but non-negligible offset of 0.074 0.033 in the -band and 0.054 0.029 in the -band. In agreement with other authors (J96,P98) we find that the FP has intrinsic scatter, not explained by observational uncertainties.
The strong proximity of bulges to the FP of ellipticals and S0s reinforces the conclusions of Peletier et al. [1999] that early-to-intermediate bulges are homogeneously old and structurally similar to elliptical galaxies. It is useful in any event to investigate the origin of the intrinsic scatter and the offset. We first analyse the intrinsic scatter by showing the FP residuals with respect to various galaxy observables. Then, we discuss the roles of populations, kinematics and homology in creating the offset with respect to Coma ellipticals.
5.1 Analysis of the Residuals
The existence of this intrinsic scatter has been a matter of debate for the last decade. For ellipticals, Mobasher et al. [1999] have proposed the population of AGB stars as one of the sources of the intrinsic scatter of the FP in the K-band. Structural and dynamical non-homology may be responsible, at least in part, for the intrinsic scatter [1997]. Recent studies suggest that the intrinsic scatter is probably a combination of age/metallicity variations and dynamical deviations from homology (P98 and references therein). For bulges differences in stellar populations might account for even larger scatter (e.g. Prugniel et al. 2001).
To obtain clues on the origin of the intrinsic scatter of our bulges in the FP, we analyse correlations between the residuals of the FP, defined as -fit, using the Common fits, and different observables for our sample of bulges: , Galaxy Type, inclination of the galaxy and Sérsic index . These correlations should give us ideas whether the distribution of our bulges along the sequence described by Es and S0s depends on the presence of young stars [], homology or light profile shape [ - Galaxy Type, - Index of the Sérsic profile (n)] or the degree of anisotropy of the object [ - Inclination of the galaxy (i)].
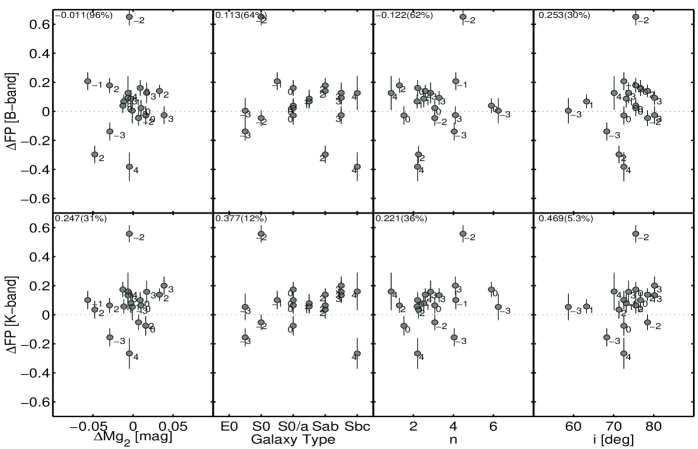
We perform this study for the 2 bands using the Spearman rank order correlation coefficients in each case. We find that there is no correlation between the residuals of the FP and any of the 3 FP parameters in either B or K, as can be expected from Section 3. Figure 5 shows the distributions of FP residuals as a function of global galaxy parameters in the and -band. Points are labeled with the morphological type of the galaxy T. The probability of a null correlation is given within parenthesis in each panel, next to the correlation coefficient. The point labeled ”-2” near the top of each panel corresponds to NGC 7332. This point is not included in the computation of correlation coefficients (see Section 3).
No signs of correlations are found of and (96% and 31%, in and band respectively). The same is true if the deviations are taken from the fit of J96. If the deviations, both to the FP and the Mg2 – relation, are due to young stellar populations, or even to non-inclusion of rotational support, a correlation is expected (P01). However, for our sample the deviations from both relations are small, and this fact combined with the relatively small size of the sample makes us not see the correlation.
Weak trends are found with galaxy type (64% and 12%) in both bands. While weak, the distribution of galaxy types (within our bulges) gives a suggestion that the FP residuals may depend on galaxy type, in the sense that late type bulges tend to be below the FP, and early types above.
We don’t find a relation between and , the Sérsic index. The same conclusion was reached by Graham & Colless [1997] for Virgo cluster galaxies studied in the V band at high S/N. Such a correlation, however, could be hidden, in part, by stellar populations effects. Prugniel & Simien [1997] found a correlation between the residuals of the FP and after removing the scatter indiced by the stellar populations. Here again think the small size of the sample prevents us from seeing this correlation.
Next we analyse possible correlations between and the inclination of the galaxy (i). Projection effects and the presence of disks are both likely sources of scatter in the FP [1993]. Despite the limited range in ellipticities, we find that the probability for a significant correlation is 70% and 95%, in the and bands respectively. J96 found that galaxies with a large ellipticity (presumably edge-ons) have a slight tendency to lie below the FP. The residual, for = 0.6 - 0.8 0.10 in log(), similar to ours. The dependence on inclination can contribute to the global offset of our inclined sample w.r.t. the J96(Coma) FP. We address this in Section 5.2.
5.2 Offsets with respect to ellipticals
Population age/metallicity differences, internal kinematics and non-homology each can in principle shift bulges with respect to the FP of old ellipticals. We discuss each in turn.
The position of bulges below the FP of ellipticals could have been produced if bulges are on average younger than elliptical galaxies [1992, 1996]. Taking the models of Vazdekis et al. (1996) one finds that for solar metallicity a decrease in age from 12.5 to 10.0 Gyr gives a shift in the log(re) direction of 0.06 in and 0.04 in , consistent with the results presented here. This means that possibly the offset could be explained if our sample on the average would be about 2.5 Gyr younger than the Coma cluster samples used by J96 and P98.
The effect of rotational support, although small, has been detected by other authors [1992, 1994]. Following Prugniel & Simien [1994], the rotational kinetic energy may be introduced in the FP via a ’rotational support term’ to be added to . Using our definition of FP and after accounting for the inclination range for our sample, we approximate as
| (8) |
with is from Eqn. 5. Since our spectra were obtained along the minor axis of the galaxies, we have not been able to measure for our sample. We can nevertheless estimate the amount of rotation needed to generate the observed offset. Non-inclusion of the rotation term offsets points downward on the FP diagram. A sample average of produces the observed FP offset. Within this model, the observed offset of our bulges sample with respect to Coma ellipticals can be explained by the non-inclusion of rotation data for our bulges.
The effect of non-homology, i.e. that bulges do not all follow the law, has not been found in our data, given that does not correlate with , the Sérsic index. As noted in Section 5.1, Prugniel & Simien [1997] did find such a correlation once the scatter by population effects had been taken into account.
Finally, in Section 5.1 we have identified galaxy inclination as a potential origin for FP offsets. J96 model the inclination effect by considering the effect of rotation on the measurement of the central velocity dispersion. This effect is independent of the rotation support term described above.
The previous analysis suggests that any combination of age and kinematics contribution to the FP can explain the offsets of our sample with respect to Coma ellipticals, whereas we fail to identify the effects of non-homology. Most plausibly, not a single one of the two processes is responsible for the entire offset. The latter probably results from a combination of the two. Nevertheless, we note that, while the population contribution rests on a model determination of ages, the kinematic offset is sure to be there; indeed, bulges rotate and our sample is selected to be inclined.
6 Conclusions
We have analysed the position of bulges of early-type spirals (type S0-Sbc) on the Fundamental Plane of early-type galaxies. A few conclusions can be drawn from our study:
-
•
We find that our sample of bulges early-type spirals lies slightly below the FP, as defined by E and S0 galaxies, both in the and bands. The fact that bulges lie so close to the FP of ellipticals and S0s implies that their formation epoch must have been similar to that of cluster Es and S0s.
-
•
Both age and the unaccounted rotation effects are likely to contribute to the offset observed. Any single one of these effects can account for the observed offset, by assuming either an age on average 2.5 Gyr younger than the cluster ellipticals and S0s, or by assuming an average . Because rotation must contribute to the FP offset, the age differential between bulges and cluster ellipticals must be significantly smaller than the mentioned 2.5 Gyr.
-
•
We find that there is a hint that bulges of later morphological type are situated below the other bulges in our sample, indicating that they have slightly younger ages, again consistent with our results from HST colours.
-
•
We confirm the result of Prugniel et al. (2001) that bulges have a steeper Mg2,0 – log() relation than ellipticals or S0s. Contrary to current lore, the Mg2,0 – is not a mass-metallicity relation only, at least for bulges: Younger objects seem to increase the slope of the relation (P01). For our sample, however, the slope is shallower than for P01, much closer to that of the ellipticals.
The William Herschel Telescope is operated on the island of La Palma by the Isaac Newton Group in the Spanish Observatorio del Roque de los Muchachos of the Instituto de Astrofísica de Canarias. We acknowledge the professional help of the observatory staff in the operation of the WHT and the ISIS spectrograph. Dr. Inger Jørgensen is thanked for giving us data in computer readable form. We are indebted to the anonymous referee for very useful comments that have help us to improve this paper.
References
- [1982] Aaronson, M., Huchra, J., Mould, J., Schechter, P.L., Tully, R.B., 1982, ApJ, 258, 64
- [1995] Andredakis, Y.C., Peletier, R.F., Balcells, M., 1995, MNRAS, 274, 874 (APB95)
- [1994] Balcells, M., & Peletier, R., 1994, AJ, 107, 135
- [2002] Balcells, M. 2002, in ”Disk of Galaxies: kinematics, dynamics and perturbations”, Eds. E. Athanassoula & A. Bosma, ASP Conf. Ser., in press
- [1992] Bender, R., Burstein, D., & Faber, S.M., 1992, ApJ, 399, 462 (B92)
- [1993] Bender, R., Burstein, D., & Faber, S.M., 1993, ApJ, 411, 153 (B93)
- [1997] Busarello, G., Capaccioli, M. Capozziello, S. Longo, G. & Puddu, E., 1997, A&A, 320, 415
- [1993] Caon, N., Capaccioli, M., & D’Onofrio, M., 1993, MNRAS, 265, 1013
- [1999] Cardiel, N., 1999, Ph.D. thesis, Universidad Complutense de Madrid, Spain.
- [1999] Carollo, C. M. 1999, ApJ, 523, 566
- [1996] Ciotti, L., Lanzoni, B., & Renzini, A. 1996, MNRAS, 282, 1
- [1996] Courteau, S., de Jong, R.S., & Broeils, A.H. 1996, ApJ, 457, 73
- [1991] de Vaucouleurs, G., de Vaucouleurs, A., Corwin, H.G., Buta, R.J., Paturel, G., & Fouqué, P., 1991, ”Third Reference Catalogue of Bright Galaxies”, Springer Verlag, New York
- [1987] Djorgovski, S., & Davis, M., 1987, ApJ, 313, 59
- [1987] Dressler, A., Lynden-Bell, D., Burstein, D., Davies, R.L., Faber, S.M., Terlevich, R.J., & Wegner, G., 1987, ApJ, 313, 42
- [1988] Dreyer J.L.E., 1988, ”NGC 2000.0, The Complete New General Catalogue and Index Catalogue of Nebulae and Star Clusters”, edited by Sinnott, R.W., Sky Publishing Corporation and Cambridge University Press.
- [1976] Faber,S.M., & Jackson, R.E., 1976, ApJ, 204, 668
- [1999] Golev, V.K., Prugniel, Ph., Simien, F., & Longhetti, M., 1999, A&ASupp 136, 519
- [1997] Graham, A., Colless, M., 1997, MNRAS, 287, 221
- [1993] Guzman, R., Lucey, J.R., & Bower, R.G., 1993, MNRAS, 265, 731
- [1996] Jablonka, P., Martin, P., & Arimoto, N., 1996, AJ, 112, 1415
- [1987] Jefferys, W.H., Fitzpatrick, M.J., McArthur, B.E., and McCartney, J.E, 1987, ”GaussFit: A System for Least Squares and Robust Estimation”, The University of Texas at Austin
- [1995] Jørgensen, I., Franx, M., & Kjærgaard, P., 1995, MNRAS, 273, 1097 (J95I)
- [1995] Jørgensen, I., Franx, M., & Kjærgaard, P., 1995, MNRAS, 276, 1341 (J95II)
- [1996] Jørgensen, I., Franx, M., & Kjærgaard, P., 1996, MNRAS, 280, 167 (J96)
- [1996] Karachentsev, I.D., & Makarov, D.A., 1996, AJ, 111,794
- [1986] Kent, S.M., 1986, AJ, 91, 1301
- [1985] Kormendy, J., 1985, ApJ, 295, 73
- [1998] Mateo, M., 1998, Annual Rev. Astron. Astrophys., 36, 435
- [1999] Mobasher, B., Guzman, R., Aragon-Salamanca, A., & Zepf, S., 1999, MNRAS, 304, 225
- [1999] Mori, M., Yoshii, Y., & Nomoto, K., 1999, AJ, 511, 585
- [1990] Oke, J.B., 1990, AJ, 99, 1621
- [1983] Oke, J.B., & Gunn, J.E., 1983, ApJ, 266, 713
- [1998] Pahre, M.A., Djorgovski, S.G., de Carvalho, R. 1998, AJ, 116, 1591 (P98)
- [1996] Peletier, R.F., & Balcells, M., 1996, AJ, 111, 2238
- [1997] Peletier, R.F., & Balcells, M., 1997, New Astronomy, 1, 349 (PB97)
- [1999] Peletier, RF., Balcells, M., Davies, R.L., Andredakis, Y., Vazdekis, A., Burkert, A., & Prada, F., 1999, MNRAS, 310, 703
- [1994] Prugniel, Ph., & Simien, F., 1994, A&A, 282, L1
- [1996] Prugniel, Ph., & Simien, F., 1996, A&A, 309, 749
- [1997] Prugniel, Ph., & Simien, F., 1997, A&A, 321, 111
- [2001] Prugniel, Ph., Maubon, G., & Simien, F., 2001, A&A, 366, 68
- [1968] Sérsic, J.L., 1968, ”Atlas de galaxias australes”. Observatorio Astronomico, Cordoba
- [1993] Saglia, R.P., Bender, R., & Dressler, A., 1993, A&A, 279, 75
- [1992] Schweizer, F., & Seitzer, P., 1992, AJ, 104, 1039
- [1995] Scorza, C. & Bender, R., 1995, A&A 293, 20
- [1996] Seifert, W., & Scorza, C. 1996, A&A, 310, 75
- [1997] Simien, F., & Prugniel, Ph. 1997, A&A, 126, 519
- [1981] Terlevich, R., Davies, R.L., Faber, S.M., & Burstein, D., 1981, MNRAS, 196, 381
- [1998] Trager, S.C., Worthey, G., Faber, S.M., Burstein, D., & Gonzalez, J.J., 1998, ApJS, 116, 1
- [1996] Vazdekis, A., Casuso, E., Peletier, R.F., & Beckman, J.E., 1996, ApJS, 106, 307
- [1997] Vazdekis, A., Peletier, R.F., Beckman, J.E., & Casuso, E., 1997, ApJS, 111,203
- [1994] Worthey, G., Faber, S.M., Gonzalez, J.J., & Burstein, D., 1994, ApJS, 94, 687
- [1997] Wyse, R.F.G., Gilmore, G., & Franx, M., 1997, ARA&A, 35,637
- [1993] van der Marel, R.P., & Franx, M., 1993, ApJ, 407, 525