HI 21cm absorption beyond the epoch of re-ionization
Abstract
We explore the possibility of detecting HI 21cm absorption by the neutral intergalactic medium (IGM) toward very high redshift radio sources. The epoch considered is between the time when the first ionizing sources form and when the bulk of the neutral IGM becomes ionized. Due to the extreme Ly opacities of the neutral IGM, objects within this ’gray age’ can only be observed at wavelengths longer than about 1m. We use the latest simulations of the evolution of the IGM in the context of CDM structure formation models constrained by observations of the highest redshift QSOs to predict the optical depth as a function of frequency of the neutral IGM due to the HI 21cm line. We then simulate radio spectra assuming observational parameters for future large area radio telescopes. These spectra show that HI 21cm absorption studies could be a powerful probe of the rich structure of the neutral IGM prior to the epoch of reionization, including absorption by the mean neutral IGM, plus deeper, narrow lines ( and a few km s-1). Most of the variations in transmissivity are due to the mild density inhomogeneities with typical values of the cosmic overdensity , precisely the structures that at later times give rise to the Ly forest. We also consider sensitivity limits and the evolution of radio source populations, and conclude that it is reasonable to hypothesize the existence of an adequate number of high- radio sources against which such absorption studies could be performed.
keywords:
cosmology: intergalactic medium, structure formation – galaxies: active, radio, radio linesto appear in the Astrophysical Journal 2002
1 Introduction
After recombining at , the intergalactic medium (IGM) remains neutral until the formation of the first luminous objects. Standard CDM structure formation models suggest that the first objects with sufficient mass to ionize substantially the IGM form at (Gnedin & Ostriker 1997). It is currently not known whether these first luminous objects are active star forming galaxies or accreting massive black holes, but given the current observations of both galaxies and luminous AGN at (Hu et al. 2002; Fan et al. 2001), it seems likely that a mixture of sources exists. Reionization of the IGM proceeds slowly at first, with each object essentially contained within its own Stromgren sphere. Eventually these spheres overlap such that ionizing photons from a given object contribute to multiple spheres, resulting in a run-away process. This overlap phase is known as ’fast’ reionization, and in the discussion below we call this phase the ’epoch of reionization’ (Loeb & Barkana 2001; Gnedin 2000; 2002).
The recent detection of Ly absorption by the neutral IGM in two QSOs, as predicted by Gunn & Peterson (1965), has revolutionized our understanding of cosmic reionization by placing constraints on the epoch of reionization (Becker et al. 2002; Djorgovski et al. 2002; Pentericci et al. 2002). Using these constraints in the context of CDM structure formation models, Gnedin (2002) fixes the redshift of fast reionization at , although admittedly the possibility of cosmic variance makes this estimate uncertain (Hu et al. 2002).
The picture then is one of a ’gray-age’ between the epoch of formation of the first luminous objects and the epoch of fast reionization. During the gray-age the IGM is predominantly neutral, with pockets of ionized gas around the first luminous objects. The neutral IGM is opaque at rest wavelengths shorter than Ly such that study of objects, and the IGM, during this age will be limited to observations at wavelengths longer than about 1m. One method for studying structures during this gray-age is through the HI 21cm line of neutral hydrogen. Many groups have considered observations of HI 21cm emission from the neutral IGM during the gray-age, or absorption against the microwave background (depending on the HI excitation temperature; Scott & Rees 1990; Bagla, Nath, & Padmanabhan 1997; Tozzi et al. 2000; Shaver et al. 1999; Iliev et al 2002; Bharadwaj & Sethi 2002). However, even in the most optimistic case of thermal noise limited observations, the sensitivity of large area future radio telescopes, such as the Square Kilometer Array (SKA), implies that such studies will be limited to large scale structure (M(HI) M⊙). Including systematic errors, such as source confusion (di Matteo et al. 2001), could degrade substantially this limit.
In this paper we consider studying the neutral IGM during the gray-age via HI 21cm absorption studies toward discrete radio sources. The important point is that while the IGM is opaque to the Ly line, the weakness of the magnetic hyperfine transition makes the IGM translucent to HI 21cm absorption. Column density sensitivity for absorption studies is set only by the surface brightness of the background source, thereby allowing absorption studies to probe to orders-of-magnitude lower masses than can be detected in emission.
We use models of structure formation and cosmic reionization to predict the HI 21cm optical depth () of the IGM during the gray-age. We then address the questions: Are future radio telescopes adequate to detect these signals? And are there high redshift radio sources of sufficient luminosity to permit these studies? In a future paper we will consider in more detail the physical information about the rich structures in the pre-reionization IGM that can be obtained through HI 21cm absorption observations. We assume = 70 km s-1 Mpc-1, , and .
2 Models for the HI 21cm optical depth of the IGM during the gray-age
Our analysis relies on the simulations of Gnedin (2000, 2002). These simulations include the three main physical ingredients required to model neutral hydrogen absorption in the redshifted 21 cm line: inhomogeneous small-scale structure of the universe, radiative transfer, and accurate treatment of the level populations in atomic hydrogen. The dynamics of gas and dark matter is followed in a quasi-Lagrangian fashion (i.e. with high resolution) with the Softened Lagrangian Hydrodynamics (“SLH”) code (Gnedin 1995, Gnedin & Bertschinger 1996). The radiative transfer is modeled with the newly developed Optically Thin Variable Eddington Tensor (OTVET) approximation (Gnedin & Abel 2001). Finally, we include all the effects that couple gas kinetic temperature to the spin temperature of the atomic hydrogen: Ly pumping and collisions with electrons and neutral atoms. The simulations are normalized in such a way as to reproduce both the observed star formation rate at (Steidel et al. 1999) and the observed evolution of the mean transmitted flux in the spectra of two quasars (Becker et al. 2001; Djorgovski et al. 2001; Pentericci et al. 2002; Fan et al. 2002). We can therefore expect that these simulations are at least representative of the physical processes involved, with the caveat that some of the details, such as the exact redshift of fast reionization, remain uncertain due to the paucity of constraints.
Figure 1 shows the evolution of the volume averaged kinetic and spin temperatures and the CMB temperature over a range of interesting redshifts. Tozzi et al. (2000) showed that during the gray-age the excitation temperature of the HI (the ’spin temperature’, ), is likely to be in excess of the CMB temperature due to the standard Wouthuysen-Field effect, i.e. resonant scattering of the ambient Ly photons emitted by the first ionizing sources (at higher densities collisions with electrons and neutral atoms also play a role). As the structure develops, the kinetic temperature increases both due to shock heating of the gas in high density regions and Ly heating in low density regions. However, as the Ly excitation rate does not increase very fast with redshift, the spin temperature
| (1) |
(here is the so-called “thermalization “ rate, Madau, Meiksin, & Rees 1997, Tozzi et al. 2000) increases at a slower rate, because the spin temperature becomes independent of the kinetic temperature when the latter gets very large.
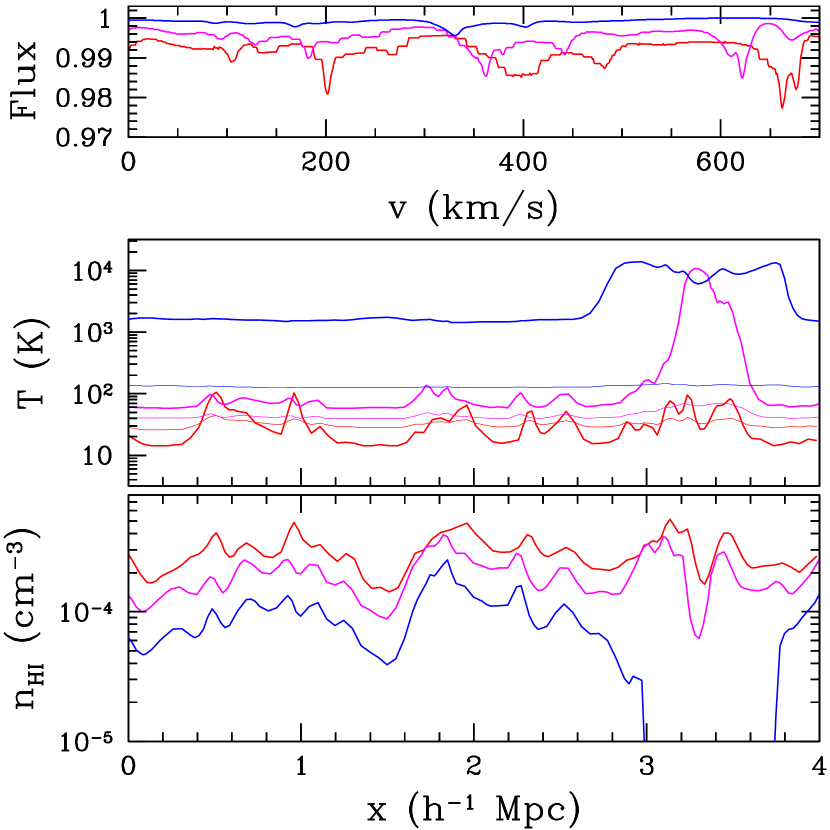
Figure 2 shows physical quantities along a representative line of sight through the simulation box at three different redshifts (), with redshift indicated by the line color. The top panel shows the HI 21cm transmissivity of the neutral IGM at high velocity resolution (0.5 kHz km s-1 at 150 MHz). The abscissa for this panel is velocity. The middle panel shows the kinetic and spin temperatures of the gas. The bottom panel shows the neutral hydrogen density structure. The abscissa in these two cases is the corresponding comoving physical scale. Most of the variations in transmissivity are due to the mild density inhomogeneities with typical values of the cosmic overdensity , precisely the structures that at later times give rise to the Ly forest. Because these structures are typically filamentary, they are at first shock-heated to about 100 K. At resonant Ly scattering further increases the gas temperature to several hundred degrees. At the same time the first HII regions start to appear - one of them manifests itself in the sharply lower neutral hydrogen density at the right edge of the bottom panel at .
The optical depth, , of the neutral hydrogen to 21cm absorption for our adopted values of the cosmological parameters is
| (2) |
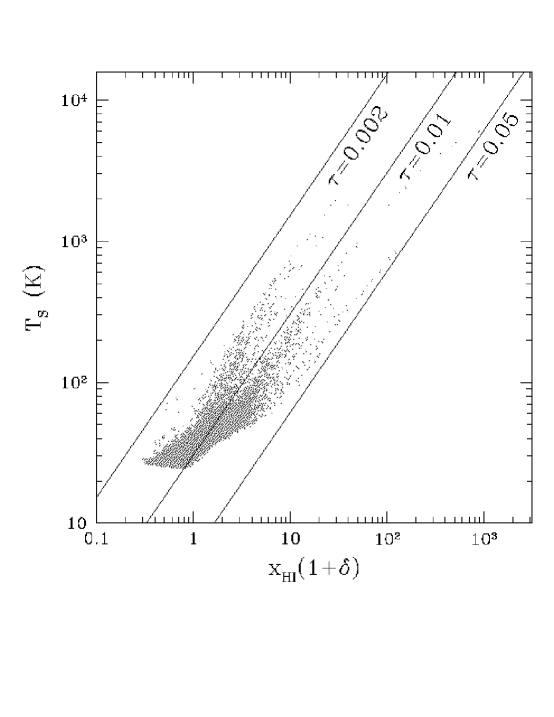
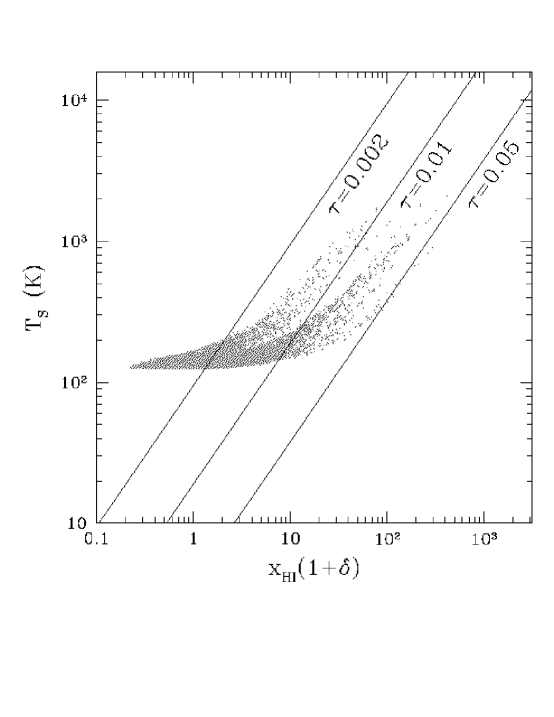
where is the neutral hydrogen fraction, and is the cosmic overdensity (Tozzi et al. 2000). Figure 3 shows in two panels the joint distribution of the spin temperature, , and neutral hydrogen density (in units of the mean hydrogen density), , of gas along random lines of sight at two redshifts: and . These parameters, plus , dictate the HI 21m optical depth via equation 2. The solid lines in Figure 3 are iso- curves, for , 0.01, and 0.05. At most of the IGM has , and some of the high density regions reach and above (a finite size of the computational box limits our ability to trace the high tail of the distribution). These higher points typically have relatively narrow velocity widths, as low as a few km s-1 (Figure 2), implying HI column densities of order 1019 to 1020 cm-2. By , Ly heating of the low density gas increases the mean spin temperature to above 100 K and the mean IGM optical depth has dropped to . However, narrow, higher absorption lines that form in the still neutral filaments are still easily identifiable.
The deeper, narrow lines occur over the entire redshift range from 6 to 15, but are more prevalent at higher redshift. The redshift density of lines with at is about 50 lines per unit redshift, while at this decreases to about 4 lines per unit redshift. We note that at , well below the epoch of reionization, the redshift density of high column density absorption line systems (ie. the damped Ly systems with N(HI) cm-2) is about 0.3 per unit redshift (Storrie-Lombardi & Wolfe 2000). These latter systems are thought to arise in gas associated with (proto-) galactic disks and/or halos (Wolfe & Prochaska 2000).
In general, the spectra shown in Figure 2 show that the structure of the neutral IGM during the gray-age is rich in both temperature, density, and velocity structure. Studying this structure via HI 21cm absorption lines will offer important clues to the evolution of the IGM at the very onset of galaxy formation.
3 Simulated spectra of high redshift radio sources
3.1 Telescope parameters
Plans for future large radio telescopes involve building an aperture synthesis array with roughly a square kilometer of collecting area, namely a ’square kilometer array’ (SKA111http://www.skatelescope.org). The detailed design and specifications for such an array are currently being considered. In the analysis below we assume an effective area of m2 at 200 MHz, two orthogonal polarizations, and a system temperature of 250 K (100 K from the receiver and 150 K from diffuse Galactic emission222The contribution to system temperature from diffuse Galactic nonthermal emission behaves as frequency-2.75 in this frequency range.). We also make the simplifying assumption that the ratio of effective area to system temperature remains roughly constant down to 100 MHz, as could arise in the case of a low frequency array composed of dipole antennas, and hence that the sensitivity is constant across the frequency range of interest (100 MHz to 200 MHz). We adopt a long, but not unreasonable, integration time of 10 days (240 hours). These parameters lead to an expected rms noise level of 34Jy in a 1 kHz spectral channel. In section 3.3 we assume thermal (ie. Gaussian) noise limited spectra. A Gaussian noise generator based on algorithms in the AIPS software and using the standard FORTRAN random number generator is used, normalized to an rms level of 34Jy.
We assume that the correlator will provide at least 104 spectral channels over a 10 MHz band, implying a channel width of 1 kHz = 2 km s-1. We also assume that the spectral bandpass determination will be at least as good as current telescopes, and presumably considerably better. Current telescopes such as the VLA and the WSRT can attain spectral dynamic ranges of up to 104 over 10’s of MHz of radio spectrum with proper attention to bandpass calibration (Dwarakanath, Carilli, & Goss 2002). This dynamic range is adequate to detect the absorption signals discussed below.
Screening and excision of terrestrial interference is also critical to these observations. Much work is being done in this area in preparation for future large area radio telescopes (Fisher 2001). We assume that effective techniques will be available for RFI mitigation to the required levels.
The parameters adopted above are within the scope of what is being considered for the SKA. Indeed, analyses of scientific issues such as those presented herein are fundamental to defining the requirements for future large area radio telescopes. An interesting point to keep in mind is that at the low frequencies considered herein, the major cost for an SKA is not likely to be collecting area. Hence, one might consider building an even larger telescope, thereby pushing to even fainter sources.
3.2 Source spectra
The sources being considered correspond to powerful radio galaxies for which the emission mechanism is non-thermal (synchrotron) radiation from a relativistic plasma of electrons and magnetic fields. In most such sources the spectrum can be described well by a power-law over the frequency range of interest (0.6 GHz to 3 GHz in the rest frame). At the worst the spectra are slowly curving (in log space) over hundreds of MHz (de Breuck et al. 2000).
In the analysis below we adopt the spectrum of the powerful radio galaxy Cygnus A. Cygnus A was included in the initial determination of the absolute celestial radio flux density scale by Baars et al. (1977), and has accurate absolute flux density measurements at many frequencies over the frequency range of interest. Figure 4 shows the spectrum of Cygnus A from 500 MHz to 5000 MHz. The solid line corresponds to a first order polynomial fit to the data in the log plane, corresponding to a power-law of index . The dashed line corresponds to a second order polynomial. We use this second order polynomial in the analysis below.
3.3 Simulated spectra for sources at and 10
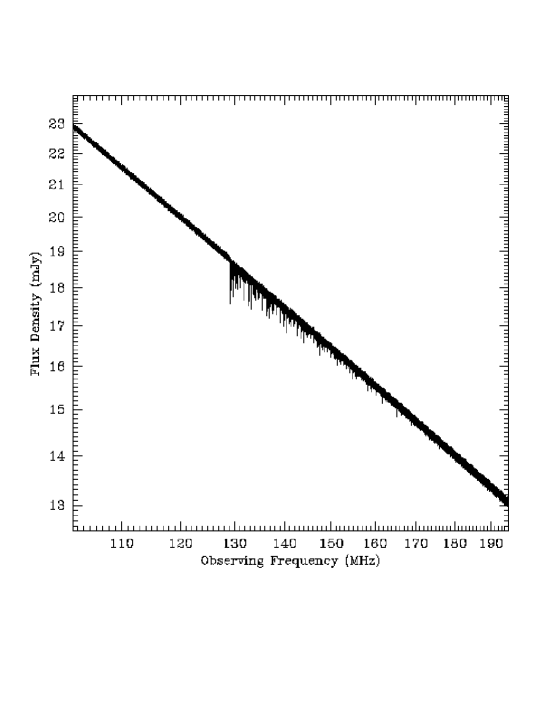
Figure 5 shows a simulated spectrum at 1 kHz resolution of a radio source with a flux density of 20 mJy at an observing frequency of 120 MHz (S120). The implied luminosity density at a rest frame frequency of 151 MHz is then erg s-1 Hz-1. Figure 5a shows a spectrum covering a large frequency range (100 MHz to 200 MHz, or HI 21cm redshifts of 13 to 6). Figure 5b shows an expanded view of the frequency range corresponding to the HI 21cm line at the source redshift (129 MHz).
The on-set of HI 21cm absorption by the neutral IGM is clearly seen at 129 MHz. The general continuum level drops by about 1 at this frequency due to the diffuse neutral IGM. Deeper narrow lines are also visible to frequencies as high as 170 MHz. Again, the narrow lines decrease in redshift-density with increasing frequency. At around 130 MHz there are roughly 5 narrow lines with per unit MHz, while at 160 MHz the redshift-density has decrease by a factor of 10 or so.
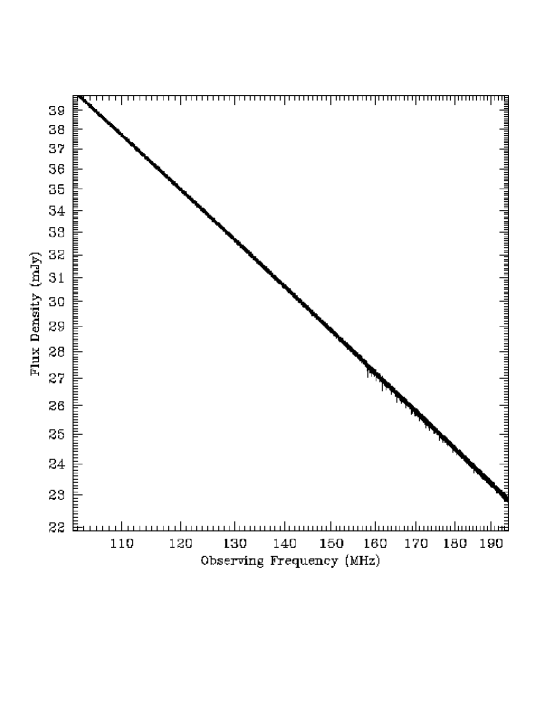
Figure 6 shows a simulated spectrum at 1 kHz resolution of a radio source with S120 = 35 mJy, again corresponding to erg s-1 Hz-1. The depression in the continuum due to absorption by the diffuse IGM is much less evident than at higher redshift, with a mean value of %. The deep narrow lines are still easily seen, but, again, at lower redshift-density than is found at higher redshifts.
3.4 Limits to detection
We next consider the detection limit of the absorption signal using statistical tests. The challenge is greater at lower redshifts due to the decreasing strength and redshift-density of the absorbing signals, so we consider the simulated spectrum of the source.
We first consider detection of the deeper narrow lines. The line density with redshift is such that we expect about two to three narrow lines of in the range to 8. In order to detect such lines at 5 at the sensitivity levels considered herein requires a continuum source of S120 = 11 mJy.
A second method for detecting absorption by the neutral IGM is to look for a change in the rms noise level in the spectrum as a function of frequency. Figure 7 shows the running rms over a spectral region of 1 MHz width at 1 kHz resolution for the simulated spectrum shown in Figure 6 (S120 = 35, ). A sharp increase of the rms noise level above the system noise is seen starting at 157.7 MHz, corresponding to the HI 21cm line at the source redshift. The noise then gradually decreases back to the system value by about 185 MHz (). As a measure of the detection limit for the increased rms due to the on-set of HI absorption by the IGM we consider a measurement of the ’noise-on-the-noise’, ie. the rms deviations, , of the calculated noise values below 157.7 MHz in Figure 7. We derive Jy. These results suggest we should be able to detect the on-set of HI 21cm absorption by the IGM at the 5 level toward a source with S120 = 6.5 mJy at .
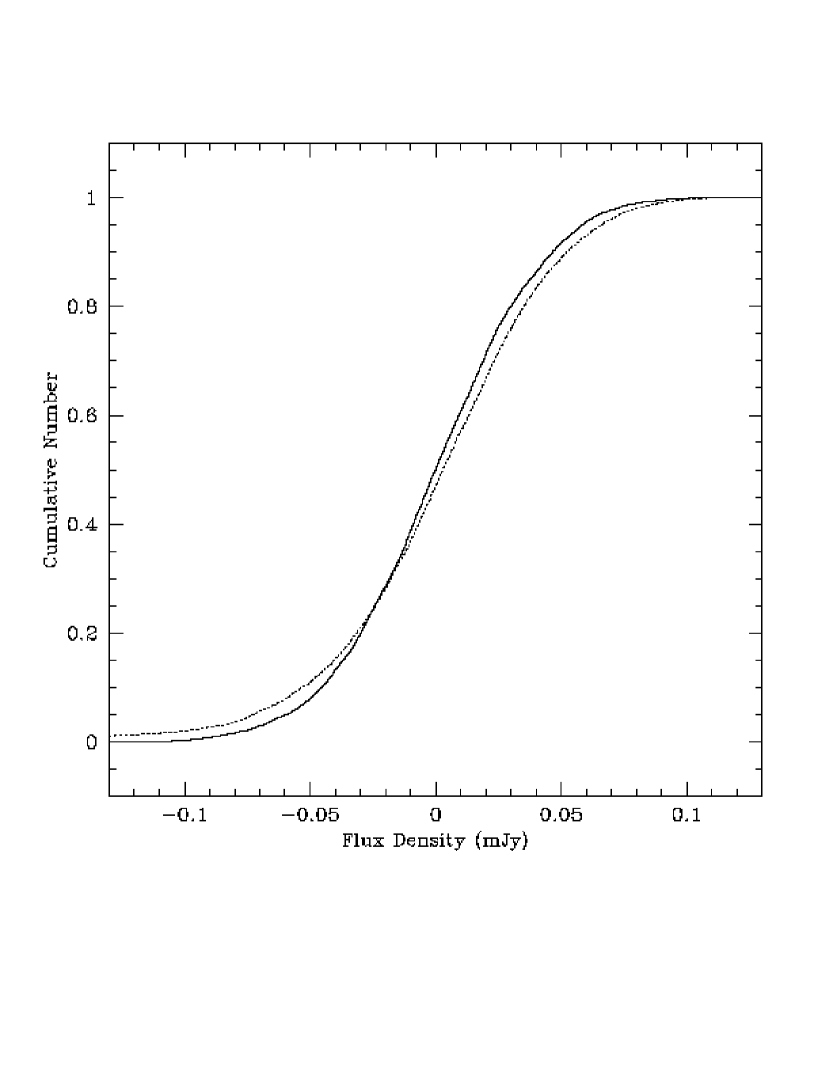
The third statistical test we consider is a non-parametric Kolmogorov-Smirnov (KS) test using cumulative distributions of the noise. Figure 8 shows an example for the spectrum shown in Figure 6 (, S120 = 35 mJy). We calculate the noise histograms over a 10 MHz band at 1 kHz resolution. The solid line is the cumulative distribution based on the system noise, ie. at frequencies below 157.7 MHz. The dotted line is the distribution at frequencies just above 157.7 MHz, ie. after the on-set of HI 21cm absorption by the IGM. A standard KS test shows that these two distributions differ to high significance ( quantile). Simulations for sources with lower flux densities show that the limit to detectability (90 quantile) occurs for sources with S120 = 12 mJy.
These statistical tests are certainly not an exhaustive analysis of the possibilities, only representative, and the detection limits should be considered at best order-of-magnitude.
4 Radio source populations
The evolution of the luminosity function for powerful radio sources is reasonable well quantified for sources with erg s-1 Hz-1 out to (Jarvis et al 2001). In the analysis below we must extrapolate to higher redshift, and lower luminosity, hence the results are necessarily speculative.
Jarvis et al (2001) derive a comoving (CM) space density of Mpc-3 for sources with erg s-1 Hz-1 at . Beyond this redshift existing surveys are consistent with either a flat CM number density, or a steep decline. We consider two possibilities. The most optimistic is the flat CM number density evolution. The second is a steep decline in the number density with increasing which follows the evolution of luminous optical QSOs as derived by Fan et al. (2001). Fan et al. (2001) find that the CM number density of optically luminous QSOs falls by a factor 2.5 or so per unit redshift beyond to 4. While not selected as radio sources, these optical QSOs likely correspond to accreting massive black holes (M; Zoltan & Loeb 2001), and hence should represent the evolution of the massive black hole population. But even for optical QSOs the CM number density evolution is poorly constrained beyond redshift 6.
The luminosity function for powerful radio galaxies obeys a power-law in luminosity of index (Jarvis et al. 2001). The analysis in section 3.4 showed that we should be able to detect HI 21cm absorption toward sources as faint as S mJy at , corresponding to erg s-1 Hz-1, or a factor 14 below the fiducial value used by Jarvis et al. (2001). The implied CM number density of these sources at is then Mpc-3. Dunlop et al. (2002) have suggested a gross relationship between radio luminosity and black hole mass for powerful radio galaxies. While admittedly highly uncertain, their relationship would imply a black hole mass of order 109 M⊙ for sources with erg s-1 Hz-1.
Figure 9 shows the number of sources in the entire sky with erg s-1 Hz-1 per unit redshift from to 15 based on the two models discussed above and normalized to the Jarvis et al. (2001) value at extrapolated to lower luminosity. For a flat CM number density evolution it is clear that there will be many sources ( sources between and 15) in the sky at large enough redshift such that HI 21cm absorption during the gray-age could be observed. In this case the surface density of sources is a slowly decreasing function of redshift. Even in the case of a steeply declining source population there will still be a reasonable number of sources (2240 sources between and 15) toward which absorption experiments can be performed. In this case the number of sources is strongly weighted to the lower redshifts.
5 Discussion
A simple argument in favor of very high- radio sources is that a radio galaxy with a luminosity more than an order of magnitude larger than the values discussed herein ( erg s-1 Hz-1) has already been found with a spectroscopically confirmed redshift of (van Breugel et al. 1999). Extrapolating to seems a relatively small step in cosmic time, and below we show that there are no obvious physical reasons to preclude radio galaxies at these high redshifts. The analysis in section 4 showed that current radio surveys are at least consistent with the existence of luminous radio sources beyond the epoch of reionization. Indeed, de Breuck et al. (2002) have identified a number of candidate powerful radio galaxies in the range to 8, based on the relation for radio galaxies. More generally, Zoltan & Loeb (2001) show that the formation of massive black holes ( M⊙) starting at is plausible in the context of hierarchical models of structure formation. Perhaps most compelling is the simple fact that models of reionization require ionizing sources. Given the already known mix of galaxies and AGN at (Hu et al. 2002; Fan et al. 2001), it seems likely that some of the ionizing structures are massive accreting black holes, of which some may power radio jets.
While the existence of massive black holes at high redshift seems plausible, are there other physical reasons to preclude radio jets beyond the epoch of reionization? One obvious environmental difference is the higher density of the IGM. It is unclear if this is relevant, at least on scales kpc around the black hole, since we are then dealing with the local environment of a structure that has already separated from the Hubble flow. And even if it were relevant, higher density environments have been hypothesized to increase radio luminosities by increasing the conversion efficiency of jet kinetic luminosity to radio luminosity (Barthel & Arnaud 1996).
The second obvious environmental difference at very high- is the higher CMB temperature. Higher CMB energy densities will lead to increased inverse Compton losses by the synchrotron emitting relativistic electrons in the radio source. The energy density of the CMB increases as: erg cm-3. The magnetic energy density in a typical extended radio structure in high- radio galaxies is of order , with B being the field strength in G. Hence, energy losses by IC emission off the CMB are comparable to synchrotron losses at . But radio galaxies should be considered in the context of a ’closed box’ model for relativistic particles including active particle acceleration (Pacholcyzk 1970). In this case one expects a steepening of the radio spectra due to IC/synchrotron losses, not an exponential cut-off. In other words, the sources will have steeper spectra, but will not be completely snuffed-out until particle acceleration ceases. For example, the IC/synchrotron lifetime of a relativistic electron radiating at 1.4 GHz in a 100 G field at is of order 1 Myr. The radio emission at this, and higher, frequencies will then be dominated by source structures where active particle acceleration has occurred within this timescale.
Even if luminous radio sources exist during the gray-age, will we be able to identify them? An obvious method would to color-select radio-loud sources in the near-IR, eg. R-band drop-outs at or H-band dropouts at . This could be done using near-IR observations of mJy radio samples or radio observations of near-IR samples. However, this method requires the objects be bright at (rest-frame) UV to blue wavelengths, thereby limiting the sample to dust-poor, optically luminous sources. A potentially more fruitful method is to use the radio data itself. For instance, the running-rms test could be used to detect sources with anomalously large noise values in the relevant frequency range of 100 MHz to 200 MHz. The initial identification could be made by comparing the rms for a given source to the typical rms derived from all the field sources. Once a potential high- candidate is identified, then a second test could be done to see how the noise behaves as a function of frequency in the candidate source spectrum. In this way one might also derive the source redshift from the on-set of HI 21cm absorption by the neutral IGM, ie. the radio Gunn-Peterson effect.
What survey area is required, and how many sources need to be considered in order to find a radio source in the gray-age? For the most optimistic model (flat comoving number density evolution), the analysis of section 4 showed that there should be about 3 sources deg-2 at with sufficient radio flux density to detect HI 21cm absorption by the IGM using the SKA. The redshift cut-off model based on luminous QSO evolution leads to 0.05 sources deg-2. The counts of celestial sources with S mJy have been determined by a number of groups, and all values are consistent with: arcmin-2, with the 1400 MHz flux density, S1400, in mJy (Gruppioni et al. 1999; White et al. 1997; Windhorst et al. 1985). At the relevant flux density limits (S mJy), the surface density of all celestial radio sources is then about 72 sources deg-2. The implied ratio of sources beyond the epoch of reionization to foreground sources is then about in the flat evolution model and in the QSO cut-off model. In either case it appears to be a tractable sifting problem.
It is important to emphasize that the structures giving rise to HI 21cm absorption prior to the epoch of reionization are qualitatively different than those seen after the universe reionizes. After reionization the HI 21cm lines arise only in rare density peaks () corresponding to (proto)galaxies, ie. the damped Ly systems. Prior to the epoch of fast reionization the bulk of the IGM is neutral with a measurable opacity in the HI 21cm line. The absorption seen in Figure 2 arises in the ubiquitous ’cosmic web’, as delineated after reionization by the Ly forest (Bond, Kofman, & Pogosian 1996). The point is simply that the Ly forest as seen after the epoch of reionization corresponds to structures with neutral hydrogen column densities of order cm-2 to cm-2, and neutral fractions of order to 10-4 (Weinberg et al. 1997). Before reionization these same structures will then have neutral hydrogen column densities of order cm-2 to cm-2, and hence may be detectable in HI 21cm absorption.
We conclude by emphasizing a few of the important differences between studying the neutral IGM via HI 21cm absorption against discrete radio sources versus via HI 21cm emission (or absorption against the microwave background). The structures probed by absorption extend down to galaxy scales, as opposed to the strictly large (ie. cluster) scale structures being probed in emission. Also, absorption features can be much narrower in frequency than is expected for the emission signal (a few kHz vs. 100’s of kHz, respectively). Narrow lines are much easier to detect in the presence of broad spectral baseline errors, as might arise from bandpass calibration errors or from confusion due to the frequency dependent sidelobes from the plethora of cosmic sources at low frequency. The sidelobe confusion problem is exacerbated by the fact that emission studies must be done at arcminute resolution in order to have enough material in the beam to make a detection, while absorption studies are preferably done at high angular resolution. On the down-side, absorption studies only probe isolated lines-of-sight, or at best a few lines of site in the case of an extended background source, and the derivation of column density is modulo the spin temperature. The analysis in section 2 suggests that judicious comparison of the observed absorption spectra with models of reionization will provide significant insight into the physics of cosmic structure formation during the gray age. We will address this issue in more detail in a future paper.
The National Radio Astronomy Observatory (NRAO) is operated by Associated Universities, Inc. under a cooperative agreement with the National Science Foundation. We thank Carlos de Breuck for useful conversations concerning this paper.
References
- [1]
- [2] Baars, J.W., Genzel, R., Pauliny-Toth, I.I., & Witzel, A. 1977, A& A, 61, 99
- [3]
- [4] Bagla, J.S., Nath, B., & Padmanabhan, T. 1997, MNRAS, 289, 671
- [5]
- [6] Barthel, P.D. & Arnaud, K.A. 1996, MNRAS, 283, 45
- [7]
- [8] Becker, R.H., Fan, X., White, R.L. et al. 2001, AJ, 122, 2850
- [9]
- [10] Bharadwaj, S. & Sethi, S.K. 2002, ApJ, in press (astroph 0203269)
- [11]
- [12] Bond, J.D., Kofman, L., & Pogosian, D. 1996, Nature, 380, 603
- [13]
- [14] de Breuck, C., van Breugel, W., Röttgering, H.J., & Miley, G. 2000, A& A (Supp), 143, 303
- [15]
- [16] de Breuck, C., van Breugel, W., Stanford, S.A., Röttgering, H.J., Miley, G., & Stern, D. 2002, AJ, 123, 637
- [17]
- [18] Di Matteo, Tiziana, Perna, R., Abel, T., & Rees, M.J. 2002, ApJ, 564, 576
- [19]
- [20] Djorgovski, S.G., Castro, S., Stern, D., & Mahabal, A. 2001, ApJ, 560, L5
- [21]
- [22] Dwarakanath, K.S., Carilli, C.L., & Goss, W.M. 2002, ApJ, 567, 940
- [23]
- [24] Dunlop, J.S., Mclure, R.J., Kukula, M., Baum, S.A., O’Dea, C.P., & Hughes, D.H. 2002, MNRAS, in press, astro-ph/0108397
- [25]
- [26] Jarvis, M.J., Rawlings, S., Willott, C.J. et al. 2001, MNRAS, 327, 907
- [27]
- [28] Fan, X., Narayanan, V., Strauss, M.A. et al. 2002, AJ, in press, astro-ph/0111184
- [29]
- [30] Fan, X., Narayanan, V., Lupton, R.H. 2001, AJ, 122, 2833
- [31]
- [32] Fisher, J.R. 2001, in ’IAU Symposium 196: Preserving the Astronomical Sky’, eds. R. Cohen & W. Sullivan, p. 389
- [33]
- [34] Gnedin, N.Y. 2002, MNRAS, submitted, astro-ph/0110290
- [35]
- [36] Gnedin, N.Y. 2000, ApJ, 535, 530
- [37]
- [38] Gnedin, N.Y. & Ostriker 1997, ApJ, 486, 581
- [39]
- [40] Gruppioni, C., Ciliegi, P., Rowan-Robinson, M., Cram, L. et al. 1999, MNRAS, 305, 297
- [41]
- [42] Gunn, J.E. & Peterson, B.A. 1965, ApJ, 142, 1633
- [43]
- [44] Hu, E.M., Cowie, L.L., McMahon, R.G. et al. 2002, ApJ (letters), in press, astro-ph/0203091
- [45]
- [46] Iliev, I.T., Shapiro, P.R., Ferrara, A., & Martel, H. 2002, ApJ (letters), in press, astro-ph/0202410
- [47]
- [48] Loeb, A. & Barkana, R. 2001, ARAA, 39, 19
- [49]
- [50] Madau, P., Meiksin, A., & Rees, M.J. 1997, ApJ, 475, 429
- [51]
- [52] Pacholczyk, A.G. 1970, ’Radio Astrophysics’, (Freeman: San Francisco)
- [53]
- [54] Pentericci, L., Fan, X., Rix, H.W. et al. 2002, AJ, in press, astro-ph/0112075
- [55]
- [56] Richards, E.A. 2000, ApJ, 533, 611
- [57]
- [58] Scott, D.H. & Rees, M.J. 1990, MNRAS, 247, 510
- [59]
- [60] Shaver, P.A., Windhorst, R.A., Madau, P., & de Bruyn, A. 1999, A& A, 345, 380
- [61]
- [62] Storrie-Lombardi L.J. & Wolfe, A.M. 2000, ApJ, 543, 552
- [63]
- [64] Tozzi, P., Madau, P., Meiksin, A., & Rees, M.J. 2000, ApJ, 528, 597
- [65]
- [66] van Breugel, W., de Breuck, C., Standford, S.A., et al. 1999, ApJ, 518, L61
- [67]
- [68] Weinberg, D.H., Miralda-Escude, J., Herquist, L., & Katz, N. 1997, ApJ, 490, 564
- [69]
- [70] White, R.L. Becker, R.H., Helfand, D.J. & Gregg, M.D. 1997, ApJ, 475, 479
- [71]
- [72] Windhorst, R.W., Miley, G.K., Owen, F.N., Fron, R.G., & Koo, D.C. 1985, ApJ, 289, 494
- [73]
- [74] Wolfe A.M. & Prochaska J.X. 2000, ApJ, 545, 603
- [75]
- [76] Zoltan, H. & Loeb, A. 2001, ApJ, 552, 459
- [77]
Figure Captions
FIG. 1.— Evolution of the kinetic temperature of the gas (solid line), the spin temperature of neutral hydrogen (dashed line), and the CMB temperature (dotted line) in the simulation.
FIG. 2.— The upper panel shows the transmitted radio flux density over a relatively narrow velocity range (700 km s-1) assuming HI 21cm absorption by the neutral IGM. Three different redshifts are displayed: (red), (violet), and (blue). The abscissa for the upper panel is velocity, while that for the middle and lower panels is the corresponding comoving physical scale. The middle panel shows the kinetic (bold lines) and the spin (thin lines) temperature of the the neutral IGM over the range of distances that contribute to the velocity range indicated on the top panel. The bottom panel shows the neutral hydrogen density.
FIG. 3.— The joint distribution of the spin temperature, TS, and neutral hydrogen density, xHI(1 + ) (in units of the mean hydrogen density) of gas along random lines of sight at two redshifts: (a) (upper panel) and (b) (lower panel). The solid curves indicate constant HI 21cm optical depth, , as labeled.
FIG. 4.— The radio spectrum of the powerful radio galaxy Cygnus A at ( erg s-1 Hz-1; Baars et al. 1977). The dash line is a first order polynomial fit to the (log) data, corresponding to a power-law of index . The solid line is a second order polynomial fit.
FIG. 5a.— The simulated spectrum from 100 MHz to 200 MHz of a source with S120 = 20 mJy at using the Cygnus A spectral model and assuming HI 21cm absorption by the IGM. Thermal noise has been added using the specifications of the SKA and assuming 10 days integration with 1 kHz wide spectral channels. 5b.— The same as 5a, but showing an expanded view of the spectral region around the frequency corresponding to the redshift HI 21cm line at the source redshift (129 MHz). The solid line is the Cygnus A model spectrum without noise or absorption.
FIG. 6a.— The simulated spectrum from 100 MHz to 200 MHz of a source with S120 = 35 mJy at using the Cygnus A spectral model and assuming HI 21cm absorption by the IGM. Thermal noise has been added using the specifications of the SKA and assuming 10 days integration with 1 kHz wide spectral channels. 6b.— The same as 6a, but showing an expanded view of the spectral region around the frequency corresponding to the redshift HI 21cm line at the source redshift (157.8 MHz). The solid line is the Cygnus A model spectrum without noise or absorption.
FIG. 7.— The rms noise of the spectrum shown in Figure 4a ( source) measured in bands of 1 MHz width with 1 kHz channels.
FIG. 8.— The cumulative distribution of channel values for a 10 MHz wide band using 1 kHz channels for the spectrum in Figure 4a ( source). The solid line shows the noise distribution at frequencies just below 157.8 MHz, ie. just before the on-set of HI 21cm absorption by the neutral IGM, while the dotted line shows the distribution just above 157.8 MHz, ie. just after the on-set of HI 21cm absorption by the IGM.
FIG. 9.— The predicted number of radio sources with erg s-1 Hz-1 over the entire sky per unit redshift vs. redshift using the two models described in section 4. The normalization is set at by Jarvis et al. (2001) extrapolated to lower luminosity.