The spatial distribution of the far-infrared emission in NGC 253
Abstract
We study the far-infrared emission properties of the nearby starburst galaxy NGC 253 based on IRAS maps and an ISOPHOT map at 180 m. Based on the analysis of the light profiles, we have been able to identify three main structural components: an unresolved nuclear component, an exponential disk, and a kiloparsec scale bar. In addition, we also found a ring structure at the end of the bar that is particularly conspicuous at 12µm. The Spectral Energy Distribution (SED) of each morphological component has been modeled as thermal dust emission at different temperatures. The unresolved nuclear component is dominated by cold dust emission (T K), whereas the disk emission is dominated by very cold dust (T K) plus a contribution from cold dust (T K). The bar emission corresponds mainly to cold dust (T K) plus a warm component (T K). We detect an extension of the disk emission due to very cold dust, which contributes a large fraction (94%) of the total dust mass of the galaxy. The estimated total dust mass is .
1 Introduction
Much of our knowledge about the infrared (IR) emission from galaxies comes from their total emission fluxes. Models of the spectral energy distribution (SED), from UV to radio wavelengths have been successful in reproducing the observations in a variety of galaxies, from normal to starburst types (Devriendt, Guiderdoni, & Sadat, 1999; Silva et al., 1998; Efstathiou, Rowan–Robinson, & Siebenmorgen, 2000). Nevertheless, there are still some controversial aspects which need to be addressed, such as:
-
Whether heating of dust by ultraviolet photons from young stars is the dominant source of the far-IR (FIR) emission (Devereux et al., 1994), or if there is a noticeable contribution from non-ionizing photons from bulge and disk stars (Walterbos & Schwering, 1987; Xu & Helou, 1996; Mayya & Regaradjan, 1997).
-
The inner gas-to-warm dust mass ratios in external galaxies result in about 5–6 times the local Galactic value (Devereux & Young, 1990), implying a deficit of cold dust. This can be attributed to a lack of data beyond 100 m, yielding both an overestimate of the dust temperature and an underestimate of cold dust masses hidden by other, more energetically important, components.
-
The extension of dust disks as compared to stellar disks observed in the optical bands. Engargiola (1991) and Engargiola & Harper (1992) found that the scalelength of stellar disk is similar or larger than the observed at 160µm continuum. However recent work seems to support dust disks larger than the stellar ones by factors from 1.4 up to 2 (Davies et al., 1997; Alton et al., 1998; Xilouris et al., 1999).
-
What is the opacity of the disk in spiral galaxies? Disney, Davies & Phillipps (1989) suggested that the spiral galaxies could be optically thick. However, more recent works indicate only moderately opaque disks (Xilouris et al., 1999). This feature has relevant cosmological implications, giving different degrees of extinction to be accounted for in the cosmic background.
Adding spatial resolution to the study of the far-IR emission from galaxies certainly helps resolving most of these controversial points. This has been possible only in a limited number of nearby galaxies thanks to the instruments on board the NASA–Kuiper Airborne Observatory (KAO) and to the improved resolution ( arcmin) of maps obtained with the Infrared Astronomical Satellite (IRAS) and processed by the HiRes algorithm (Aumann, Fowler, & Melnyk, 1990; Rice, 1993). Engargiola (1991) has studied the FIR continuum distributions of NGC 6946 from 60 to 200 m, using IRAS and NASA–Kuiper Airborne Observatory data, showing that the light distribution reveals discrete sources coinciding with giant H ii regions superimposed on an unresolved exponential dust emission background. The brightness profiles were separated into a nuclear starburst plus an exponential disk. Both the nuclear and the disk SEDs were described as modified blackbody sources at 40 K and 15 K, respectively. Far IR maps of the quiescent spiral galaxies M 31 and NGC 4565 have been studied by Xu & Helou (1996) and Engargiola & Harper (1992), respectively. In both cases they could distinguish warm dust tracing the spiral arms superimposed on a diffuse cool dust emission corresponding to the disk. They also found that old stars contribute an important fraction of the heating of the dust.
More recently, with the launch of ISO with its on-board instrument ISOPHOT, maps of similar or better resolution have been obtained up to 200 µm, allowing more detailed studies of various physical quantities related to the FIR emission of galaxies. Questions concerning the dust and temperature distributions, the structural components followed by the dust distribution, the existence of very cold dust emission, and the physical extent of the disks can all be addressed. Haas et al. (1999) have mapped the FIR emission of M 31 at 175 µm using ISOPHOT data, showing the importance of the contribution of cold dust to the total mass of the galaxy.
Relevant advances also come from the theoretical front. Most current models are able to reproduce the main features of the far IR emission from different types of galaxies consistently with other wavelength ranges dominated by the stellar radiation. For instance, Devriendt, Guiderdoni, & Sadat (1999) developed successful models which take into account the evolution of the stellar population as well as extinction and emission of dust in a self consistent way. On the other hand, Bianchi, Davies, & Alton (2000) constructed bidimensional models to predict the dust-reprocessed FIR output in spiral galaxies corresponding to different stellar and dust geometries. These models could explain the observed far IR spectral energy distribution from spiral galaxies only when dust disks are optically thick. However they failed to reproduce the large far IR scale lengths suggested by recent far IR observations (Alton et al., 1998).
Because of its proximity, NGC 253 is a good candidate for detailed studies at any wavelength range. Its angular size in the visible range is 27.5′ 6.8′. It is classified as a spiral galaxy of type SAB(s)c and is seen almost edge–on. Throughout this paper, we adopt a distance of Mpc (Sandage & Tammann, 1975), implying a scale of 16.5 pc/arcsec. NGC 253 is considered as a prototype nuclear starburst galaxy, exhibiting strong IR emission (L), being an ideal target for IR studies. In this paper, we analyze maps of NGC 253 from 12 µm to 180 µm. We are able to separate the far IR emission into its morphological components. The SED of each component was been modeled in terms of blackbodies emission.
2 Mid and Far IR maps.
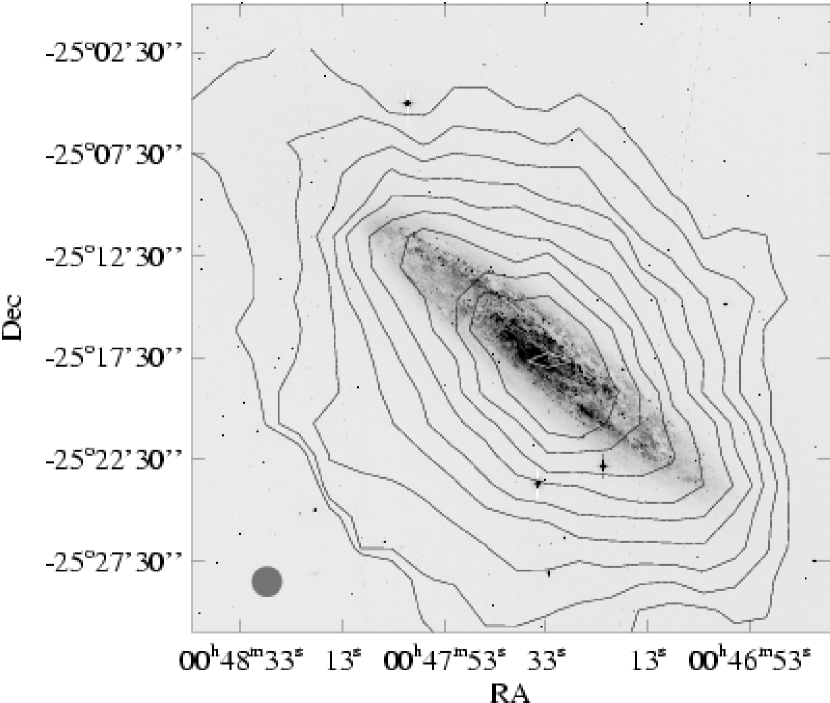
The ISOPHOT (Lemke et al., 1996) data at 180 m were retrieved from the ISO111Based on observations with ISO, an ESA project with instruments funded by ESA Member States (especially the PI countries: France, Germany, the Netherland and the United Kingdom) and with the participation of ISAS and NASA. Data Archive. The map was performed in undersampled raster mode with a step of 180 arcsec, using the C200 camera, which consists of a 2 2 pixel array (the pixel size is 89 arcsec). The data were reduced using PIA v9.1 (Gabriel et al., 1997), and the following corrections were applied: ramp linearization, deglitching at the ramp and signal levels, and dark signal subtraction. Only the last 60% of the signal at each raster position was retained in order to minimize transient effects. The flux calibration was done using the internal calibration lamps, although the final calibration was determined by comparing the sky background measurement in the 180 m ISOPHOT map with background measurements from COBE/DIRBE maps. A scaling factor of 1.48 has to be applied to the ISOPHOT data in order to match both numbers. Two pixels of the C200 array were saturated when crossing the nucleus of the galaxy. The values at these map positions were obtained by interpolation from the neighbourings . This fact may produce a broadening of the light profile at the center of the galaxy, and probably underestimate the nuclear contribution. The map reconstruction was performed within PIA using the trigrid algorithm. We estimate the actual resolution of this map to be arcsec, due to the poor raster sampling. The isocontours of the 180 µm image overlaid on a band (MPG/ESO 2.2 m + WFI optical image222Obtained with the WFI (full field) at the MPG/ESO 2.2 m telescope and retrieved from the ESO archive.) are presented in Fig. 1. The main features present in the optical image can also be recognized in the 180 µm map. However, the morphology at 180µm is slightly different than that observed in the other IR bands. The emission along the minor axis extends up to 10 Kpc from the nucleus. This extended emission can be associated with a cold dust halo. Addittional evidence was found in our analysis of the strip maps perpendicular to the disk (Pérez García et al., 2001) The same conclussion has been reached by Radovich, Kahanpää, & Lemke (2001). A similar morphology has been reported from ROSAT X-ray observations by Pietsch et al. (2000).
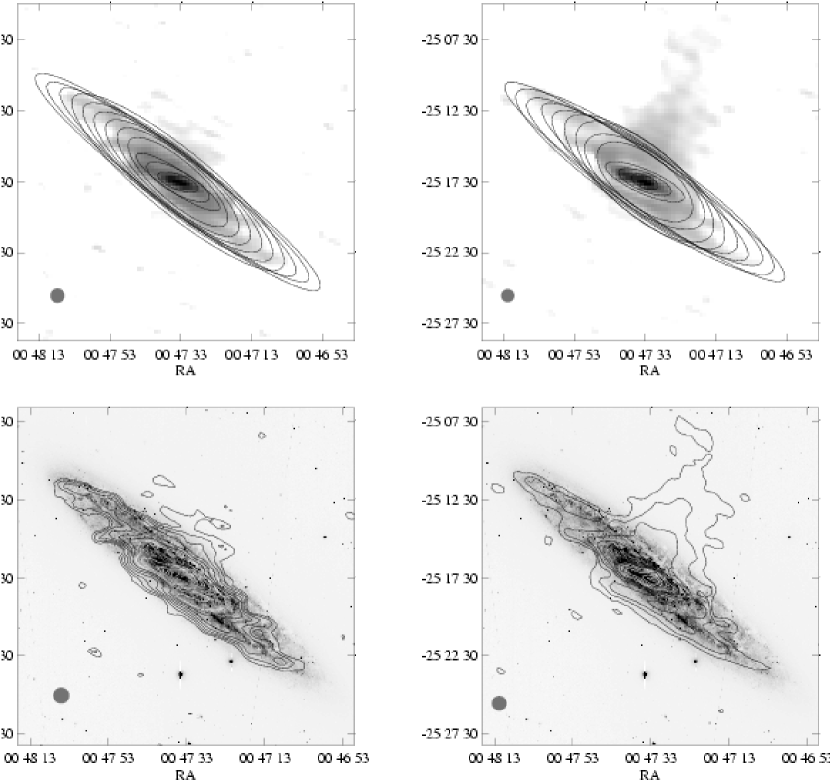
We retrieved IRAS maps at 12, 25, 60, and 100m from the Infrared Processing and Analysis Center at Caltech (IPAC). The data retrieved were processed using HiRes algorithm, which is based on the Maximum Correlation Method (Aumann, Fowler, & Melnyk, 1990) to produce images with improved spatial resolution. The resolution of these IRAS maps ranges from 1 arcmin at 12 and 25 µm to 1.7 arcmin at 100µm. Unfortunately, the low level emission seen in the IRAS maps cannot be used due to the spurious structures caused at 12 and 25 µm (see Fig 2) by detector hysteresis after crossing the bright nucleus, and at 60 and 100 µm by reflected emission off the IRAS secondary spider (Rice, 1993).
Very recently, Radovich et al. (2001) have studied the far IR emission of NGC 253 using IRAS and ISO data, as well as a numerical radiative transfer model. Their main aim war detecting FIR emission above the disk that might be connected with outflows and/or supergalactic winds. These authors have also shown the need for an extended dust disk.
3 Results
3.1 IR luminosity profiles
For all maps, we obtained surface brightness profiles by azimuthally averaging over elliptical annuli. We fitted the isocontours of surface brightness with the ELLIPSE task in IRAF333IRAF is the Image Reduction and Analysis Facility, a general purpose software system for the reduction and analysis of scientific data. IRAF is written and supported by the IRAF programming group at the National Optical Astronomy Observatories (NOAO)., which uses the algorithm described in Jedrzejewski (1987). The spatial interval between two consecutive isophotes is equal to the pixel size in each filter, but averaged over an annulus of width close to the resolution in each filter. Figure 2 shows the family of ellipses fitted for two filters, 12 and 25 µm. At first glance, it can be noticed how the isophotal twisting delineates the presence of a bar and a ring at the circumnuclear region (discussed below). The brightness profiles, ellipticities (), and position angles (PA) in all filters as a function of radial distance from the galaxy center are shown in Fig. 3. Fig. 4 shows the light profiles normalized to the central peak to facilitate the comparison at the different wavelengths. The brightness profiles show similar behavior in all the IR filters, with the exception of the 180 µm profile. Two different slopes are clearly distinguished, a steep profile from the central peak out to about 2–4 arcmin, and from there on the profile flattens sampling the disk of the galaxy (see Fig. 4). The IR emission concentrates at different radii depending on the wavelength: the sharpness of the luminosity profiles from 12 to 100 µm reflects the predominance of the warm dust emission associated with the starburst activity at the galaxy center. In the outer parts the disk is the dominant structure. In contrast, the luminosity profile at 180 µm appears flatter than the other profiles, following an exponential disk profile behavior at all radii. No central region can be distinguished in the 180µm profile. The absence of a central peak at 180µm is probably a consequence of the lower prominence of the nucleus at that wavelength, although the saturation problems mentioned above likely blur the central peak. Remarkably, the extension and the decay of the light profile at 180 µm is comparable to that measured in the B band (Pence, 1980) (see Fig 4), although the slope beyond 15 kpc is slightly flatter at 180 µm than at the B band. This fact may indicate an extended disk of very cold dust (Radovich et al., 2001).
More structures can be distinguished in the brightness profiles. At a distance of kpc, there is a shoulder in the 12 µm profile, which is also evident in the 25 µm profile; this feature coincides with the end of the inner disk detected by Scoville et al. (1985), which we have also identified as a ring structure (discussed in section 3.2). There are other findings which support this identification: an excess of millimeter CO emission at 3.5 kpc along the semi–major axis, reported by Scoville et al. (1985), and more recently by Sorai et al (2000); and a H image shows a remarkable ring structure with radius of 2.7 arcmin (Hoopes et al., 1996). The prominent hump observed in the B band at a distance between 6 and 12 arcmin along the semi–major axis is marginally present in the 100 m profile. The hump at the B band has been attributed to young stars and Hii regions in the spiral arms (Pence, 1980). Note that in the other IRAS filters we cannot see the hump, probably because of noise introduced by spurious structures at low flux levels.
The position angle and the ellipticity also vary considerably with galactocentric distance. In particular, the 12 µm light profile shows drastic changes in both ellipticity and position angle at radii between 2 and 3.5 kpc. The ellipticity increases from the center up to a maximum value of 0.8 at a distance of 3.5 kpc, where it suddenly decreases to a value of 0.5; from there outwards, the ellipticity approaches the disk value of 0.75. Simultaneously, the position angle changes from 70∘ to 60∘ at 2 kpc falling to the outer disk average value of 52.3∘ at a distance of 3.5 kpc. The 25 m profile show a similar behavior to that at 12 m, although the position angle remains constant at 70∘ up to 3.5 kpc. We identify these features with the presence of a bar, whose existence has been reported previously by other authors (Pence, 1980; Scoville et al., 1985; Forbes & DePoy, 1992). Both the orientation and the extension match well the values reported in the near IR: Scoville et al. (1985) found in a 2.2 µm map an elongated barlike structure with a radius kpc, oriented at PA = 68∘, within an inner disk which extends out to kpc; Forbes & DePoy (1992) found in an band image a bar oriented at and extending 2.48 kpc. The barred nature of this galaxy is obvious in the near IR (Scoville et al., 1985) and also quite evident in the 2MASS Atlas Image Gallery mosaic of this galaxy444This image (J,H & Ks composite) is available electronically at: http://www.ipac.caltech.edu/2mass/gallery/images_galaxies.html.. Moving outwards, the position angle and ellipticity reach the same asymptotic limiting values for the different filters, within the errors. We obtain for the ellipticity the average value 0.79 0.10, which corresponds to a galaxy inclination of , and position angle , representing the disk. These values are in good agreement with those obtained by Pence (1980) using optical data (PA = 51∘, ). As the resolution decreases—moving to longer wavelengths—details of the isophotes at the inner part become less representative. At 180 m, the position angle reaches similar values in the outer parts to those at 12, 25, 60, and 100 m. However the ellipticity remains lower, the isophotes being rounder. This is consistent with the detection of a cold dust halo. This halo is not detected at other wavelengths except at 100 µm which shows a slight lower ellipticity. This is consistent with the work by Alton et al. (1998) who fail to detect dust emission above the disc using IRAS images from edge-on galaxies.
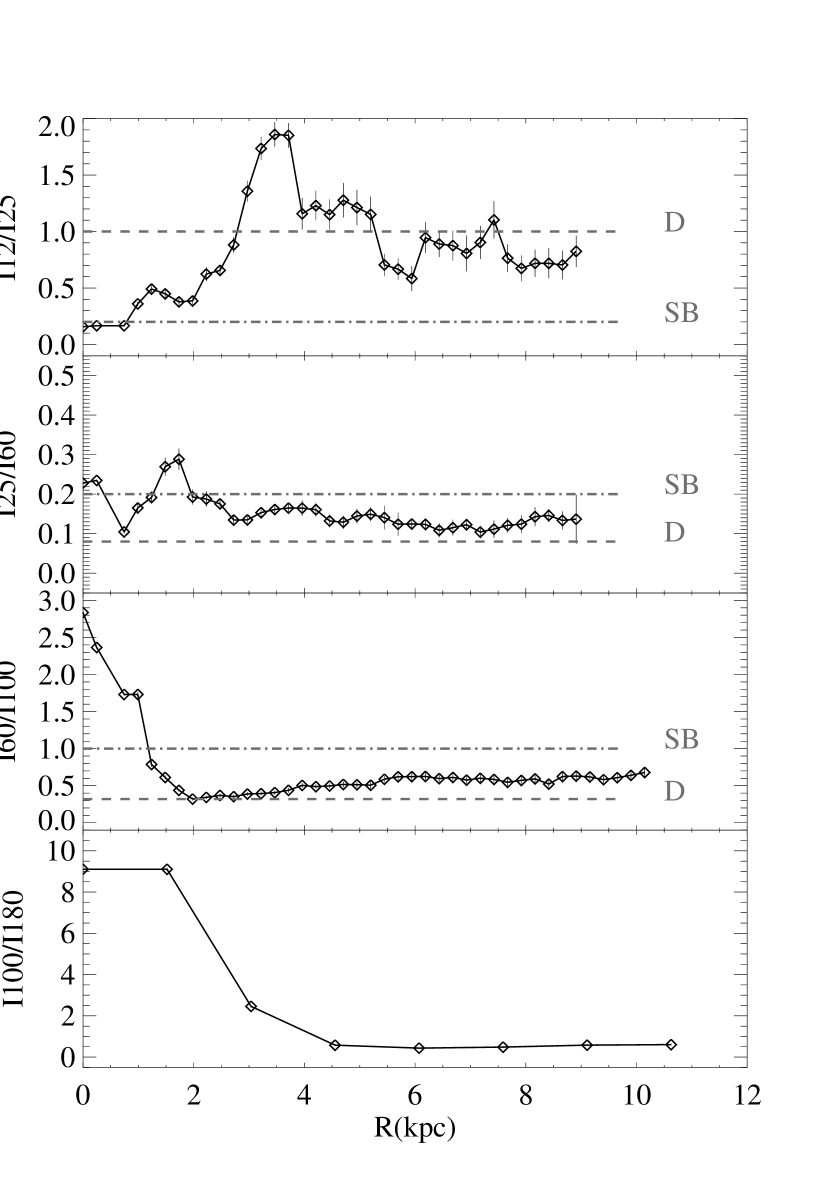
We have also looked at the variation of the IR colors with galactocentric distance (see Fig. 5). The mid- and far-infrared color ratios approximately describe the origin of the dust emission at these wavelengths (Helou, 2000; Telesco, 1993). In a simplified scenario, the IR emission of a relatively normal galaxy can be described as a composite of two spectral components (Helou, 1986): blackbody emission from classical grains in temperature equilibrium heated by the interstellar radiation field dominating in the far IR; and very small grains and PAH molecules transiently heated to high temperatures by the absorption of single energetic photons produced in star forming regions. As a result starbursts have warmer 60/100 µm color temperatures and cooler 12/25 µm color temperatures. The more active starbursts exhibit bluer 25/60 µm and 60/100 µm colors corresponding to warmer dust in high temperature equilibrium. As a guide, we have superposed for all colors the typical values of two model components—the disk (D) and the starburst (SB). These models were used to synthesize the observed far-infrared spectra of many IRAS galaxies by Rowan-Robinson & Crawford (1989). The first thing to notice is that in the outer regions all colors are typical of disk emission. The 12/25 µm color index shows a strong peak, coincident with well identified morphological features (described in next section). In the innermost regions, this color matches that of typical starburst galaxies. Around 3–4 kpc there is a strong color increase slightly beyond the end of the bar at the location of the ring detected in our profile separation (as described below). The origin of this color enhancement can be related to an intense PAH emission associated with the ring of molecular gas mentioned above (Scoville et al., 1985; Sorai et al, 2000). The 25/60 µm color index shows a smoother trend. An interesting feature appears around 2 kpc, coincident with the head of the barlike structure, that might be another indication that star formation is taking place there. The 60/100 µm and 100/180 µm color indexes have an absolute maximum at the center of the galaxy, as corresponds to the central starburst activity. The 60/100 µm color index shows a small increase coincident with the beginning of the spiral arm. This is interpreted as an increase in dust temperature due to star formation in large HII regions, as observed by Engargiola (1991) in NGC 6946.
3.2 Surface brightness profile decomposition
The best fit structural components to the radial light profiles at 12, 25, 60, 100 & 180m are shown in F. 6. Initially, we tried a morphological separation of the profiles into two components: an unresolved source corresponding to the PSF (for the IRAS maps we use gaussian functions and for the ISOPHOT map a model PSF) and an exponential disk that mainly accounts for the external regions of the galaxy. The resolution of the 180 µm map is not sharp enough to separate any other components than the exponential disk. A bulge component was not included because it cannot be sampled with the limited resolution of our maps. Forbes & DePoy (1992) found an effective radius (10′′) for the bulge which is well below our resolution limit, so its contribution will be implicitly included in the unresolved component. The analytic profiles were convolved using the corresponding PSF function for each filter before performing the fit. A third component was introduced to improve the matching of the models with the observed profiles following the indications of the presence of a bar discussed in Section 3.1. For this latter component we have taken a flat bar profile (Prieto et al., 1997):
where is the amplitude, is the length and is the downward gradient.
| IPSF | Idisc | rdisc | Ibar | rbar | lbar | Iring | rring | lring | |
|---|---|---|---|---|---|---|---|---|---|
| MJy/sr | MJy/sr | kpc | MJy/sr | kpc | kpc | MJy/sr | kpc | kpc | |
| 12 | 10020 | 182 | 3.20.3 | 28040 | 0.730.08 | 0.260.03 | 8.50.9 | 3.00.3 | 0.690.11 |
| 25 | 1950200 | 192 | 3.70.4 | 19020 | 1.340.14 | 0.280.03 | 0.30.4 | 3.00.3 | 0.690.11 |
| 60 | 7880790 | 9910 | 4.30.4 | 13020 | 2.10.2 | 0.350.12 | 0.23.9 | 3.00.3 | 0.690.11 |
| 100 | 2760280 | 23020 | 3.50.4 | 55070 | 1.90.2 | 0.370.04 | 4.8e-42.4e-4 | 3.00.3 | 0.690.11 |
| 180 | … | 550170 | 3.10.9 | … | … | … | … | … | … |
In addition, the 12 m luminosity profile shows a conspicuous maximum around 3.5 arcmin, at the position where a strong decrease in the ellipticity and a noticeable variation in the position angle are found. We identify this feature with a ring at the end of the bar, which also coincides with the maximum extent of the inner disk identified by Scoville et al. (1985). This structure can be related to the molecular and H rings detected by(Sorai et al, 2000) and (Hoopes et al., 1996). A ring structure can be described by a Gaussian profile (Buta, 1996), as follows:
where is the amplitude, is the center and is the width.
The ring can still be recognized in the intensity profile at 25 µm, but it disappears at 60, 100 and 180 µm. Nevertheless, we have introduced this morphological component in the decomposition of the 25 and 60µm profile, although the radial distance () and the width () are fixed to that at 12µm, in order to obtain a meaningful fit. We have checked that introducing this component at the other wavelengths (60 and 100 µm) the fit results do not change, being compatible with a very low amplitude for it. The uncertainty of the amplitude of the ring at 60µm is compatible with non–detection (see Table 1) the seeing ring.
The resulting parameters for the different morphological components and filters are given in Table 1. During the fitting process all parameters were allowed to vary freely, except for the radial distance and width of the ring, as mentioned above. The uncertainties in the parameter values were computed using a bootstrapping technique. This procedure is based on a Monte Carlo simulation: new light profiles are obtained by perturbation of each measured profile value, using a normal distribution of the same width as the error of that point. New fit parameters are determined for each simulated profile (usually 50 simulations) and the uncertainty of each parameter is taken as the standard deviation of the resulting values.
The disk scale lengths obtained in all the examined maps are very similar and have a mean value of 3.63 kpc. This is very close to the value of 3.32 kpc obtained in the band by Pence (1980). Puche & Carignan (1991) found in H i observations a disk scale length of 3.41 kpc. However, Forbes & DePoy (1992) obtained in the band a disk scale length of 2.65 kpc along the semi-major axis. The smaller scale length observed in the band, if confirmed at and , could be attributed either to high extinction at the inner parts or to the presence of very high temperature small dust grains emitting in the near IR. An important result is that both the stars scale length (Pence, 1980) and the dust scale length are similar, which is not in agreement to the results finding of Radovich et al. (2001) based on radiative transfer models of this galaxy.
3.3 Spectral energy distributions of the structural components
The IR spectral energy distribution (SED) of the morphological components, namely, the unresolved nucleus, the disk, and the bar found in the previous section, are displayed in Figure 7. For each filter and each morphological component we represent the emission integrated over the galaxy. The uncertainty of the emission from any component is determined from the uncertainty of the amplitude. The global emission of each morphological component has been modeled as the combination of the emission from emissivity–weighted blackbody components (Hildebrand, 1983). An emissivity index of 2 has been adopted. The best fitting blackbody temperatures are compiled in Table 2. The uncertainties in the temperature and scaling factor of each blackbody were computed using the bootstrapping technique, similar to what was done for the profile decomposition.
The SED of the unresolved nuclear component can be modeled as a cold ( K) component. The cold component has a temperature typical of dust heated in star forming regions. This component is present in nearly all classes of galaxies, including normal, starburts, and even active galaxies (Knapp et al., 1996; Chini, Kruger, & Kreysa, 1992; Klaas et al., 1997; Pérez García & Rodríguez Espinosa, 2001). There is an excess at 12µm which is likely due to a combination of PAH and very small grains emission. In fact, PAH emission has been detected at the central regions of NGC 253 (Pérez García et al., 2001; Dudley & Wynn-Williams, 1999; Keto et al., 1999)
The SED of the disk component is explained by a combination of a cold ( 55 K) and a very cold ( 15 K) component. The origin of the warm component is again due to dust heated in H ii regions and OB associations populating the arms of the disk. The temperature of the very cold component is typical of dust heated by dilute interstellar radiation. This very cold dust has been observed in normal galaxies (Walterbos & Greenwalt, 1996; Walterbos & Schwering, 1987; Cox, Kruger, & Mezger, 1986) and in the disks of starbursts and active galaxies (Radovich et al, 1999; Pérez García & Rodríguez Espinosa, 2001).
The SED of the bar component can be modeled as the sum of two modified blackbodies, a warm one at K and a cold one at K. The origin of the warm component is related to regions of very intense star formation Klaas et al. (1997); Lutz et al. (1996). Instead, the temperature of the cold component indicates an origin at a quiescent interstellar gas region, where star formation activity is low.
Most of the emission from the ring is concentrated in the mid-IR range, from 12 to 25 µm; beyond this wavelength the emission cannot be reliably determined. The characteristics of the ring emission seems to indicate a dominant contribution of PAH and very small grains, as already mentioned in Section 3.1, indicative of photodissociation regions.
4 Derived physical properties
4.1 IR luminosities
We have computed the IR luminosities between 1 and 1000 µm for each morphological component (except for the ring because of the reasons mentioned in the previous section). The luminosity for each morphological component can be easily computed after the blackbody model is found. The resulting values are compiled in Table 2, the total values are obtained as the sum over all structural components.
| Component | T(K) | FIR | LIR | Dust mass | SFR |
|---|---|---|---|---|---|
| (K) | [10-8 erg s-1 cm-2] | [109 L⊙] | [106 M⊙] | (M⊙/yr) | |
| PSF | 49.40.9 | 3.50.3 | |||
| DISK | 5515 | 0.70.2 | |||
| 15.92.1 | |||||
| BAR | 14874 | 1 | |||
| 2312 | 0.80.6 | ||||
| TOTAL GALAXY | 51 |
The nuclear unresolved component is the most important contributor to the total IR luminosity, accounting for about half of the total emission. The disk accounts for % of the total, of which 2/3 corresponds to the very cold component. The remaining % comes from the bar structure, in which the cold component dominates. The contribution of the ring to the total luminosity is very small.
4.2 Star formation rate
Star formation rates (SFRs) were calculated following Kennicutt (1998) for both the warm and cold components using the following expression:
This relationship applies only to relatively young starbursts, which implies that it only produces meaningful results when K. The resulting values are compiled in Table 2. As expected, the maximum star formation activity is taking place in the nuclear region at a moderate rate yr. Furthermore, star formation activity at a lower rate is taking place in both the disk and the bar. The total SFR in the galaxy is 5.0 /year. This value is 20% lower than that found by Radovich et al. (2001) who give a total SFR value of 6.1 /yr (after correcting their value for the different distance used herein). Notice that Radovich et al. (2001) include the 20 K dust emission to complete the global SFR. We therefore consider the value here provided as a rather more precise value. If we compare this value (4.97 /year) with that obtained from the H emission, SFR = 0.6192 /yr by Hoopes et al. (1996), we estimate that the H emission must be obscured by a factor of , in good agreement with the value estimated by Hoopes et al. (1996).
4.3 Dust masses
Dust masses were estimated following Hildebrand et al. (1977) for the emissivity index () used here, assuming dust grain properties as in Hildebrand (1983):
The computed values for each component are shown in Table 2. The total dust mass of the galaxy is computed as the sum of all contributions. The most important contribution (about 94%) to the total mass comes from the very cold dust present in the disk. The mass estimate depends on the emissivity law adopted; we have checked that for the emissivity index 1, the resulting mass varies by a factor 0.7 to 2 for dust temperatures in the range 18 to 65 K, respectively. We have also investigated the radial distribution of the dust mass by integrating over elliptical annuli at a given radius. The cumulative distribution per component is plotted in Figure 8. It can be noticed that about half of the total dust mass of the galaxy is contained in the first 4–5 arcmin.
The total dust mass value thus estimated gives a more reliable value than that obtained from the global SED. As an exercise, we have computed the mass using the integrated emission of the galaxy. For that purpose, the SED have been modeled as dust emission from a cold ( 54 K) and a very cold ( 20 K) component. In this way, we derive a total luminosity of [] and total dust mass of [] , which are in agreement with the total values obtained for the whole galaxy by Radovich et al. (2001) (once the difference in distance has been allowed for). Note that this value is times smaller that the dust mass obtained with the multiple-component approach.
We have also computed the gas–to–dust mass ratio for different galactocentric distances using gas mass data from the literature (Scoville et al., 1985). The result is plotted in Figure 9. The mass ratio decreases strongly towards the outer part of the galaxy approaching the canonical value of our Galaxy. In our Galaxy the gas-to-dust mass ratio is 160 (Sodroski et al., 1994). Devereux & Young (1990) obtained a value of 1070 for the inner disk (the inner half of the optical disk, 6.8 kpc) of NGC 253 using IRAS data. They concluded that this value is too high and would indicate that 80–90% of the dust mass in spiral galaxies is radiating at 100 m. At 5.2 kpc from the center, using our dust mass estimate, we obtain a value of Furthermore, Houghton et al. (1997) provided values for molecular and atomic hydrogen for 5.6 kpc, the total hydrogen mass being . We find that the global gas-to-dust mass ratio is , which is close to the outermost value in Figure 9.
Summarizing, we find that the gas–to–dust mass ratio varies greatly along the galaxy, from a value of 300 at 1 kpc to in the outermost part. The dust mass appears to be distributed towards the outer parts of the galaxy, and is rather difficult to detect at 100m due to the very low temperature. The gas to dust mass ratio seems to indicate little excess of dust as compared to the canonical value in our Galaxy.
5 Summary and conclusions
We have used ISOPHOT at 180m and IRAS maps to study the spatial distribution of the far-infrared emission in NGC 253. We have performed an analysis of the radial brightness profiles in terms of morphological components, reaching the following conclusions:
-
•
The radial light profiles show different extensions for the emission at the different wavelengths. The profiles from 12 to 100 µm show a central peak, reflecting the nuclear concentration of warm dust due to the starburst activity. On the outer parts the profiles correspond to an exponential disk. At 180 µm the slope is rather flat, and corresponds to exponential disk. The decay of the light profile at 180 µm is comparable to that seen in the optical (B band). An extended cold dust halo is revealed in the 180µm map. Marginal evidence is also found at 100µm.
-
•
We have identified three main structures: an unresolved nuclear component which corresponds to the central starburst, a bar, and an exponential disk. In addition we have identified a ring at 12 and 25µm.
-
•
The scale length of the disk is about 3.6 kpc and is very similar in all the bands studied. In all filters (12, 25, 60, and 100 m) we obtained the same asymptotic limiting values for the ellipticity and the position angle: and PA . These values are in good agreement with those derived from optical images. We conclude that the scale lengths of both the stars and the dust are similar.
-
•
The disk can be characterized by dust emission at two temperatures: a warm component with dust temperature of K and a very cold component with temperature of K. The first component results dust heated by star forming regions in the galaxy disk, while the very cold dust is heated by the interstellar radiation field. This work confirms the presence of a large amount of cold dust in the disk of NGC 253, which contains of the overall dust mass. The estimated total dust mass is
-
•
We could identify in all the light profiles a nuclear unresolved source, which was modeled as the PSF of the corresponding filter. The SED of this component could be modeled as blackbody emission at K. The dust is heated by the intense radiation field produced in the nuclear starburst.
-
•
A far IR bar has also been detected and characterized. This bar had been previously detected in the near IR. The bar position angle (69.5∘) and its extent are in agreement with the near-IR bar. The SED of the bar could be modeled with two components, a warm dust component at 148 K and a cold dust component at 23 K.
-
•
In the light profiles at 12 and 25 µm, we could identify a ring structure, showing at 3 kpc coincident with the end of the bar. The IR color profiles indicate the presence of PAHs at the end of the bar and coincident with the position of the ring. The detection of the ring had been previously claimed from both molecular gas (CO) and H imaging.
-
•
The total IR luminosity computed for NGC 253 is . About half of the total luminosity corresponds to the central unresolved component, 31% from the disk and 17% comes from the bar.
-
•
The total star formation rate in NGC 253 is about 5.0 /yr. About 70% comes from the nuclear starburst and the rest comes from the disk and the bar. Estimates of the star formation rates derived from H photometry are a factor below our estimate, which is consistent with previous estimates for optical extinction.
-
•
The gas–to–dust mass ratio varies appreciably throughout the galaxy from a value 300 in the inner part to 60 in the outermost part. Globally NGC 253 seems to be a dust rich galaxy, contrary to what was found in previous studies.
Acknowledgements. We thanks an anonymous referee for his very helpful and detailed report that greatly improved our paper. This proyect has been partly funded by the spanish DGI (AYA2001-3939-C03-03). We express our thanks to Antonia María Varela for her comments and fruitful discussions. Thanks are due to Prof. John Beckman for reading of the text. We also acknowledge the Scientific Editorial Service of the IAC for corrections.
IPAC is operated by the Jet Propulsion Laboratory (JPL) and California Institute of Technology (Caltech) for NASA. IPAC is funded by NASA as part of the IRAS extended mission program under contract to JPL/Caltech.
The COBE datasets were developed by the NASA Goddard Space Flight Center under the guidance of the COBE Science Working Group and were provided by the NSSDC.
References
- Alton et al. (1998) Alton, P. B., Trewhella, M., Davies, J. I., Evans, R., Bianchi, S., Gear, W., Thronson, H., Valentijn, E., Witt, A., 1998, A&A, 335, 807
- Alton et al. (1998) Alton, P. B., Davies, J. I. & Trewhella, M., 1998, MNRAS, 296, 773
- Aumann, Fowler, & Melnyk (1990) Aumann, H. H., Fowler, J. W., & Melnyk, M. 1990, AJ, 99, 1674
- Bianchi, Davies, & Alton (2000) Bianchi, S., Davies, J. I., & Alton, P. B. 2000, A&A, 359, 65
- Buta (1996) Buta, R., 1996, in Barred Galaxies, IAU. Symp. 157, eds Buta, R., & Crocker, D.A., 11
- Chini, Kruger, & Kreysa (1992) Chini, R., Kruger, E., & Kreysa, E. 1992, A&A, 315, 75
- Cox, Kruger, & Mezger (1986) Cox, R., Kruger, E., & Mezger, P. G. 1986, A&A, 155, 380
- Dahlem et al. (1998) Dahlem, M., Weaver, K.A., Heckman, T., 1998, ApJS, 118, 401
- Davies et al. (1997) Davies, J.I., Trewhella, M., Jones, H., et al., 1997, MNRAS, 288, 679
- Devereux et al. (1994) Devereux, N. A., Price R., Wells, L. A., & Duric, N. 1994, AJ, 108, 1667
- Devereux & Young (1990) Devereux, N. A., & Young J. S. 1990, ApJ, 359, 42
- Devriendt, Guiderdoni, & Sadat (1999) Devriendt, J.E.G., Guiderdoni, B., & Sadat, R., 1999 1990, A&A, 350, 381
- Disney, Davies & Phillipps (1989) Disney, M.J., Davies, J.I., Phillipps, S., 1989, MNRAS 239, 939
- Dudley & Wynn-Williams (1999) Dudley, C.C., Wynn-Williams, C.G., 1999, MNRAS 304, 549
- Efstathiou, Rowan–Robinson, & Siebenmorgen (2000) Efstathiou, A., Rowan-Robinson, M.& Siebenmorgen, R., 2000, MNRAS, 313, 734
- Engargiola (1991) Engargiola, G. 1991, ApJS, 76, 875
- Engargiola & Harper (1992) Engargiola, G., Harper, D.A., 1992, ApJ, 394, 104
- Forbes & DePoy (1992) Forbes, D. A., & DePoy, D. I. 1992, A&A, 259, 97
- Gabriel et al. (1997) Gabriel. C., Acosta–Pulido. J. A., Heinrichsen I. in ASP Conf. Ser.. Vol. 125, Astronomical Data Analysis Software and Systems VI, ed. G. Hunt & H. E. Payne, (San Francisco: ASP), 108
- Haas et al. (1999) Haas, M., Lemke, D., Stickel, M., Hippelin, H., Kunkel, M., Herbstmeier, U., & Mattila, K. 1999, in The Universe as seen by ISO, ed. P. Cox & M. F. Kessler (Nordwijk: ESTEC), 885
- Helou (1986) Helou, G. 1986, ApJ, 311, L33
- Helou (2000) Helou, G. 2000, in Infrared Space Astronomy, Today and Tomorrow, ed. F. Casoli, J. Lequeux, & F. David (Les Houches:NATO ASI), 337
- Hildebrand (1983) Hildebrand, R.,H. 1983, QJRAS, 24, 267
- Hildebrand et al. (1977) Hildebrand, R.,H., Whitcomb, S.,E., Winston, R., Stiening, R.,F., Harper., D.,A., Moseley, S.,H., 1977, ApJ, 216, 698
- Hoopes et al. (1996) Hoopes, C. G., Walterbos, R. A. M., & Greenwalt, B. E. 1996, AJ, 112, 1429
- Houghton et al. (1997) Houghton, S., Whiteoak, J. B., Koribalski, B., Booth, R., Wiklind, T. & Wielebinski, R. 1997, A&A, 325, 923
- Jedrzejewski (1987) Jedrzejewski, R. I. 1987, MNRAS, 226, 747
- Kahanpää, Radovich, & Lemke (2000) Kahanpää, J., Radovich, M., & Lemke, D. 2000, in Proc. 232, WE-Heraeus-Seminar, The Interestelar Medium in M31 and M33, ed. E. M. Berkhuijsen, R. Beck, & R. A. M. Walterbos (Aachen: Shaker), no. 89
- Kennicutt (1998) Kennicutt, R. C. 1998, ARA&A, 36, 189
- Keto et al. (1999) Keto, E., Hora, J.L, Fazio, G.G., Hoffmann W., Deutsch, L., 1999, ApJ, 518, 183
- Klaas & Elsäesser (1993) Klaas, U., & Elsäesser, H. 1993, A&A, 280, 76
- Klaas et al. (1997) Klaas, U., Haas, M., Heinrichsenm, J., & Schulz, B. 1997, A&A, 325, L21
- Knapp et al. (1996) Knapp, G. R., Rupen, M. P., Fich, M., Harper, D. A., & Wynn-Williams, C. G. 1996, A&A, 315, L75
- Lemke et al. (1996) Lemke, D. et al. 1996, A&A, 315, L64
- Lutz et al. (1996) Lutz, D., Genzel, R., Sternberg, A., Netzer, H., Kunze, D., Rigopoulou, D., Sturm, E., Egami, E., Feuchtgruber, H., Moorwood, A. F. M., & de Graauw, T. 1996, A&A, 315L, 137
- Mayya & Regaradjan (1997) Mayya, Y.D., Regaradjan, T.N., 1997, AJ, 114, 946
- McCarthy, Heckman & van Breugel (1987) McCarthy, P.J., Heckman, T., & van Breugel, W. 1987, AJ, 92, 264
- Pence (1980) Pence, W. D. 1980 ApJ, 239, 54
- Pérez García & Rodríguez Espinosa (2001) Pérez García, A. M., & Rodríguez Espinosa, J. M. 2001, ApJ, 557, 39
- Pérez García et al. (2001) Pérez García, A. M., Melo V.P., Acosta-Pulido, J.A., Muñoz-Tuñón, & Rodríguez Espinosa, J. M. 2001, A&AS, 277, 347
- Prieto et al. (1997) Prieto, M., Gottesman S. T., Aguerri J. A. L., & Varela, A. M. 1997, AJ, 114, 67
- Pietsch et al. (2000) Pietsch, W., Vogler, A., Klein, U., Zinnecker, H. 2000, å360, 24
- Puche & Carignan (1991) Puche, D., & Carignan, C. 1991, ApJ, 378, 487
- Radovich, Kahanpää, & Lemke (2001) Radovich, M., Kahanpää, J., & Lemke, D. 2001, A&A, 377, 73
- Radovich et al. (2001) Radovich, M., Kahanpää, J., & Lemke, D. 2001, A&A, 377, 73
- Radovich et al (1999) Radovich, M., Klaas, U., Acosta-Pulido, J., & Lemke, D. 1999, A&A, 348, 705
- Rice (1993) Rice, W. 1993, AJ, 105, 67
- Rowan-Robinson & Crawford (1989) Rowan-Robinson, M., & Crawford, J. 1989, MNRAS, 238, 523
- Sandage & Tammann (1975) Sandage, A., & Tammann, G. A. 1975, ApJ, 196, 313
- Scoville et al. (1985) Scoville, N. Z., Soifer, B. T., Neugebauer, G., Young, J. S., Matthews, K., & Yerka, J. 1985, ApJ, 289, 129
- Silva et al. (1998) Silva, L., Granato, G.L., Bressan, A., Danese, L., 1998, Ap.J. 509, 103
- Sodroski et al. (1994) Sodroski, T. J., Bennett, C., Boggess, N., Dwek, E., Franz, B. A., Hauser, M. G., Kelsall, T., Moseley, S. H., Odegard, N., Silverberg, R. F., & Weiland, J. L. 1994, ApJ, 428, 638
- Sorai et al (2000) Sorai, K., Nakai, N., Kuno, N., Nishiyama, K., & Hasegawa. T. 2000, PASJ, 52, 785
- Telesco (1993) Telesco, C., 1993, IV Canary Islands Winter School of Astrophysics, Infrared Astronomy, ed. A. Mampaso, M. Prieto, & F. Sánchez (Cambridge: Cambridge University Press), 175
- Telesco & Harper (1980) Telesco, C., Harper, D. A., 1980, ApJ, 235, 392
- Walterbos & Greenwalt (1996) Walterbos, R. A. M., & Greenwalt, B. 1996, ApJ, 460, 696
- Walterbos & Schwering (1987) Walterbos, R. A. M., & Schwering, P. B. 1987, A&A, 180, 27
- Xilouris et al. (1999) Xilouris E.M., Byun Y.I., Kylafis, N.D., Paleologou, E.V., Papamastorakis, J., 1999, A&A, 344, 868
- Xu & Helou (1996) Xu ,C., & Helou, G. 1996, ApJ, 456, 163