What do HST and Chandra tell us about the jet and the nuclear region of the radio galaxy 3C 270?††thanks: Based on observations obtained at the Space Telescope Science Institute, which is operated by the Association of Universities for Research in Astronomy, Incorporated, under NASA contract NAS 5-26555.
Abstract
The HST/STIS ultraviolet image of the FR I radio galaxy 3C 270 shows the presence of a jet–like structure emerging from the position of the nucleus. This feature, which represents the first jet–like component ever detected in the UV in a radio galaxy with jets lying almost on the plane of the sky, has the same position angle as the jet in the radio and X–ray images. We propose two different scenarios for the origin of the emission: i) non-thermal synchrotron from a mildly relativistic component of the jet; ii) scattered light from the nucleus, where a BL Lac source may be hosted. Either of these pictures would have important consequences for the AGN unification schemes and for our knowledge of the jet structure. In the Chandra image a faint counter–jet is also present. From a comparative analysis of the HST images and Chandra X–ray spectrum, we find that the nucleus is only moderately obscured. The obscuring structure might well reside in the geometrically thin dark disk observed on large scales. This fits the scenario in which a standard geometrically and optically thick torus is not present in FR I radio galaxies.
1 Introduction
The unified scheme for low luminosity radio–loud active galactic nuclei associates low luminosity FR I radio galaxies with BL Lacs objects, or at least with most of them. According to the most recent studies, there is growing evidence that the non–thermal radiation produced at the base of the relativistic jet, on sub–pc scales, which dominates the overall emission in BL Lacs, is also visible in the nuclei of their misaligned counterparts. The nuclear sources observed through high resolution HST optical and UV images in the great majority of complete samples of FR I (Chiaberge et al., 1999, 2002; Verdoes Kleijn et al., 2002), tightly correlate with the radio core emission, strongly arguing for a common origin (i.e non-thermal synchrotron emission from the base of the jet). The discovery of such non-thermal nuclei imply that FR I radio galaxies represent a fundamentally different manifestation of the AGN phenomenon, as they lack at least two of the typical characteristics of other active galaxies: optically and geometrically thick tori, and thermal disk emission.
On larger (kpc) scales, jets have been observed in the optical (e.g. De Koff et al. 1996, Martel et al. 1999, Capetti et al. 2000) and in the UV band (Allen et al., 2002), in a substantial number of FR I radio galaxies. The origin for the emission of these jets is most plausibly non-thermal synchrotron radiation. Best support for this interpretation comes from detailed multiwavelength observations of the different components of the jets (e.g Perlman et al. 2001, Sparks et al. 1996), which show smooth spectra from the radio to the UV. Sparks et al. (2000) have shown that optical jets in a complete sample of 24 nearby 3CR FR I are associated with sources in which dark disks are seen presumably face-on. Their analysis strongly supports the scenario in which, as a result of relativistic beaming, optical non-thermal synchrotron emission from a jet is detected only if the jet is pointing towards the observer, forming an angle to the line–of–sight .
On the other hand, observations made with the Chandra satellite have shown that X–ray jets are common among low luminosity radio galaxies Worrall et al. (2001) and are observed in quasars as well (Chartas et al., 2000; Sambruna et al., 2002). For the X-ray emission of powerful quasars’ jets, the most plausible radiation mechanism is inverse Compton scattering (Harris & Krawczynski, 2002, for a recent analysis of the emission processes in X-ray jets). The source for the seed photons which are upscattered to X–ray energies might reside in the Cosmic Microwave Radiation. This mechanism requires high velocity bulk motion of the jet on the kpc scales, which might be present in powerful quasars (and FR II galaxies) but is not expected in lower luminosity objects. Another possible source for the seed photons, which might well apply to low luminosity radio galaxies’ jets, is their “blazar” nucleus. Celotti et al. (2001) have shown that, for large viewing angles to the jet, this can be the dominant mechanism, if the jet has a slow velocity component (which might be still relativistic but with a Lorentz factor of ). In order to discriminate between the above scenarios, a detailed modeling of the SED of such large–scale jets is required. Clearly, this is possible only if multiwavelength and co–spatial data, from radio to the X-ray band, are available.
The low luminosity radio galaxy 3C 270 is an ideal object to further investigate all of the above issues. In VLA radio maps, this nearby111We adopt a distance to 3C 270 of 41 Mpc (Faber et al., 1989) source shows an FR I morphology (Fanaroff & Riley, 1974) with symmetric jet and counter–jet (Birkinshaw & Davies, 1985). VLBA radio images show symmetric jets on the sub-pc scale, implying that the viewing angle to the jet is quite large, (Jones & Wehrle, 1997; Jones et al., 2000, 2001; Piner et al., 2001). In the HST images, the galaxy shows a large (hundreds–of–pc–scale) obscure dusty disk (Ferrarese, Ford, & Jaffe, 1996; Martel et al., 2000). The jet axis projects onto the disk minor axis and it is plausibly almost perpendicular to the disk. An unresolved nucleus is present in the IR and optical (Capetti et al., 2000; Chiaberge et al., 1999), but it is not detected in the UV (Allen et al., 2002; Chiaberge et al., 2002).
In this paper we show that the HST/STIS UV image of 3C 270 shows a further feature, which is possibly connected to the jet. As we will show in the following, such feature is unexpected in an object as 3C 270, in which the jets almost lie on the plane of the sky. The presence of this component, together with both the absence of the nucleus in the UV and the information from the Chandra X–ray data, give us a unique global picture of the nuclear structure of this object. The X–ray image also shows the presence of a jet and, more surprisingly, of a counterjet. All of these issues have important implications for the AGN unified models.
This paper is organized as follows: in Section 2 we describe the HST and Chandra observations and we show the results; in Section 3 we discuss our results and we propose different scenarios which can account for the observations; in Section 4 we present a summary of our findings and we draw conclusions.
2 Observations and results
2.1 HST observations
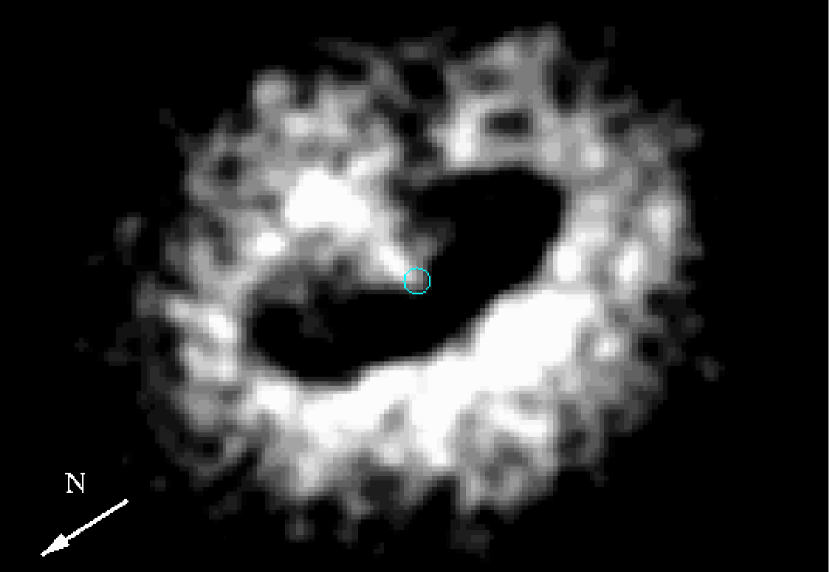
The UV HST-STIS image was taken as part of the UV Snapshot survey of 3CR radio galaxies (Allen et al., 2002, SNAP 8275), using the NUV-MAMA detector and the F25SRF2 broad band filter, whose transmission function is centered at 2320 Å. The image has been processed through the HST pipeline calibration. IRAF standard packages have been used for the analysis. In Fig. 1 (left panel) we show the central of the STIS image, which has been smoothed by convolving the original image with a 2 pixels (corresponding to ) sigma gaussian in order to improve the rather low signal–to–noise ratio ( in the center of the galaxy). The most apparent feature in the UV image is the three hundred pc–scale dark disk (Jaffe et al., 1993). Emission from the host galaxy stellar component is also clearly visible. The circle represents the position of the center of the galaxy, which has been identified by fitting ellipses to the isophotes of the galaxy, in the region outside the dark disk, between 1.5 and 2.5 arcsec from the center. Due to the relatively low signal–to–noise ratio of the UV image, the position of the center of the galaxy is known with an uncertainty of pixel.
While an unresolved nucleus is present in the near–infrared and optical HST images (Ferrarese, Ford, & Jaffe, 1996; Capetti et al., 2000), in the UV image a faint, elongated, jet–like structure appears to emerge from the center of the galaxy, and the nucleus is not detected (Allen et al., 2002). As pointed out by Ferrarese, Ford, & Jaffe (1996), the nucleus is probably not at the center of the galaxy isophotes. However, the error on the position of the center in the UV image is of the same order as the shift between the isophote center and the position of the unresolved nucleus in the optical images. Therefore such small shift ( arcsec) is not significant for our purposes.
The apparent angular dimensions of the jet–like feature (to which we will refer in the following as the “A” component) are arcsec, which correspond to pc. However, the width of the feature is consistent with being unresolved. The “A” component lies at the same position angle () as the jets observed in the radio, both on the VLBI and VLA scales (Jones et al. 2000, Birkinshaw & Davies 1985), and in the X–ray band (see below). Clumps of emission, possibly superimposed on other components aligned with the jet, are present on larger scales, across the western edge of the obscure disk, up to a distance of arcsec from the location of the nucleus.
We have measured the flux of the “A” component, by extracting the count rate from a box of pixels, and evaluating the background by averaging the counts in the pixels contiguous to such box. The background evaluation is clearly the largest source of error in the process of evaluating the flux of this component. Adopting the PHOTFLAM parameter in the image header222The HST internal calibration is expected to be accurate to . to convert from counts to flux density, we obtained erg cm-2 s-1 Å-1. At the distance to 3C 270 this corresponds to a luminosity erg s-1.
2.2 Chandra observations
We analyze a Chandra archival 34 ksec observation of 3C 270 (P.I. Birkinshaw), obtained on 2000 May 6 with the back illuminated ACIS-S3 chip. Since significant pileup effects were expected, a subarray configuration was used, which allowed to reduce the frametime to 1.8 sec and the estimated pileup fraction to . The data reduction was performed with CIAO v2.2 applying the standard corrections for bad and flaring pixels, and filtering for standard ASCA grades. An updated gain map included in the CALDB 2.8 release was used, which reduces the calibration uncertainties at low energies. We also eliminated about 12% of the exposure time where the background flux was above the average value.
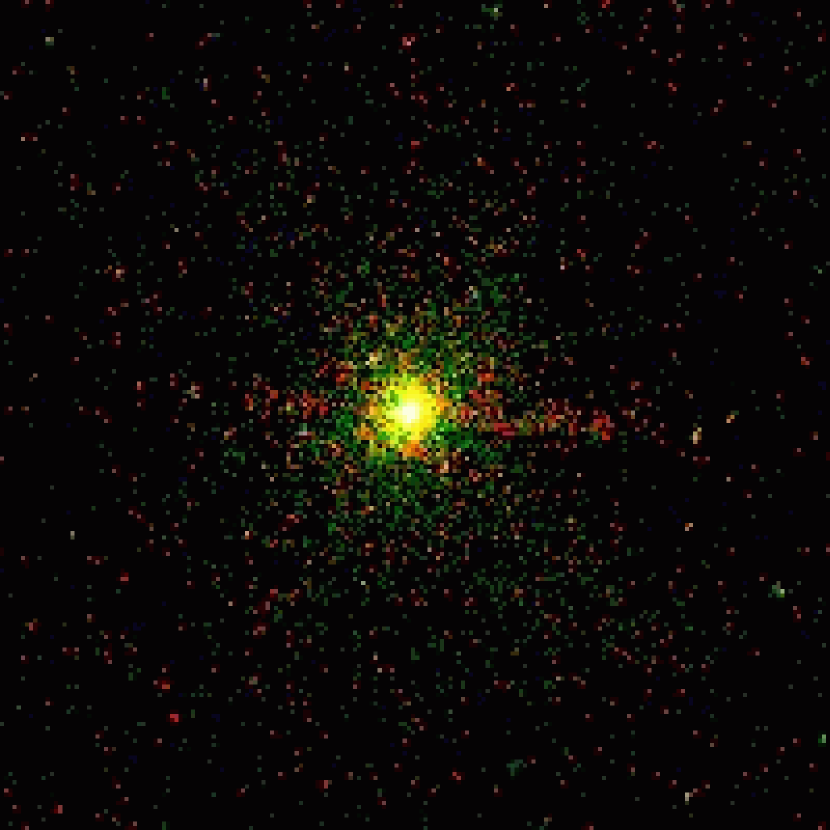
The X-ray image (Fig. 2) clearly shows the nucleus, diffuse emission from the hot corona, a kpc-scale jet (pointing westwards) and, surprisingly, a faint counterjet. The counterjet is clearly visible in the X–ray image when only the soft (0.3–0.6 keV) is displayed (Fig. 3). The jet–counterjet flux ratio is , in substantial agreement with what is observed in the radio band (Xu et al., 2000; Piner et al., 2001).
To avoid contamination from the kpc-scale jets and thermal gas, we extract the nuclear spectrum in a circle with aperture radius of 4 pixel ( arcsec), which is twice as large as the FWHM of the observed Point Spread Function. The background spectrum is measured in an external region on the same chip. The background flux is less than 1% of the source flux, therefore our results are not altered by measuring the background spectrum in a different region.
We carry out the spectral analysis using the XSPEC v11.1.0 package. We fitted the 0.3–9 keV spectrum of 3C 270 with an absorbed powerlaw (the AGN) plus a thermal plasma (mekal model in XSPEC). Since it is likely that the observed spectrum has been significantly hardened by pileup, we convolve the model with the pileup model in XSPEC (Davis, 2001). In addition to the thermal component we obtain a hard power–law333The spectral index is defined by () which is similar to what has been found in ASCA and ROSAT data (Matsumoto et al., 2001; Sambruna et al., 1999; Capetti et al., 2000).
Most importantly, and differently from the ROSAT and ASCA observations, we find evidence for a moderate amount of nuclear absorption ( cm-2). The X–ray spectrum of 3C 270 is shown in Fig. 4.
Note that the presence of moderate X–ray absorption is rather common among FR I. Sambruna et al. (1999) studied nine FR I galaxies with the ASCA satellite, finding a broad range of absorbing columns. The typical values for lie between and cm-2, and for three out of the nine FR I galaxies in their sample, they find no intrinsic absorption. Very recent work with Chandra (e.g. Hardcastle et al. 2001, 2002) basically confirms this picture. In order to check for consistency with the previous X–ray observations of 3C 270, we have reanalyzed the ASCA data. We find that a satisfactory fit can be obtained by setting the parameters for the power-law component and absorption to those we have obtained from the Chandra observation.
We also find that a keV iron line is not statistically required by our fit. However, its presence cannot be ruled out by the Chandra data, since we have no stringent upper limits on its equivalent width (380 eV at 90% c.l.). In Table 1 we summarize the parameters for the best fit (), and fluxes and luminosities of the different spectral components (errors are at 90% c.l.). Note that the 2–10 keV flux is comparable to the ASCA value, while the Chandra 0.5–2 keV flux is a factor 4 lower, since, due to the the small extraction area we adopt, we are missing most of the diffuse soft thermal emission. Instead, the total 2–10 keV flux is dominated by the (nuclear) power–law component. By subtracting the thermal component from the total flux, we obtain that the observed flux of the power–law component in the range 2–10 keV is erg s-1 cm-2.
| Total | thermal | Power-Law | P-L (de–absorbed)ccIn units of erg s-1 | |
|---|---|---|---|---|
| bbIn units of erg cm-2 s-1 | 1.29 | 1.26 | – | – |
| ccIn units of erg s-1 | 0.26 | 0.25 | – | – |
| bbIn units of erg cm-2 s-1 | 6.91 | – | 6.88 | 9.58 |
| ccIn units of erg s-1 | 1.38 | 1.37 | 1.91 | |
| P–L spectral index | ddIn units of cm-2 | kT | ||
| keV |

3 Discussion
Two are the most important questions arising from the analysis of the STIS image of the nuclear regions of 3C 270:
what is the nature of the “A” jet–like feature?
what is the role of nuclear absorption in this radio galaxy?
In the following sections, we test whether the available data are consistent with the synchrotron scenario for the jet-like feature, and we discuss the implications for the AGN unified model. Then, we consider a different scenario for the observed emission (namely scattered radiation from the “blazar” nucleus) which has again important implications for the unification schemes. Finally, we discuss the role of nuclear absorption, and we suggest future observations that may offer a definitive discrimination between the two.
3.1 A UV jet?
A fundamental tool in order to constrain the emission process of the jet–like structure in 3C 270 is the information about its spectral shape. Unfortunately, the “A” component is not detected in any other HST image, and no co–spatial observations are available either in the radio or in the X–ray bands.
The absence of a corresponding feature in the optical images is not surprising: we can predict the expected counts of such feature in the optical (F547M) image, by considering the flux density of component “A” in the UV. Assuming a spectral index , which is common among synchrotron emitting sources in the optical-UV regime, the expected flux is erg cm-2 s-1 Å-1. Using the WFPC2 exposure time calculator, this translates in a count rate of counts/sec integrated on an area of pixels, corresponding to an average value of 0.4 counts/pixel in the F547M image (which has s). This value is less than 0.3% of the background in the region of the dark disk, at the position angle of the jet. Therefore if the “A” component is a synchrotron jet, it cannot be detected in the available optical images.
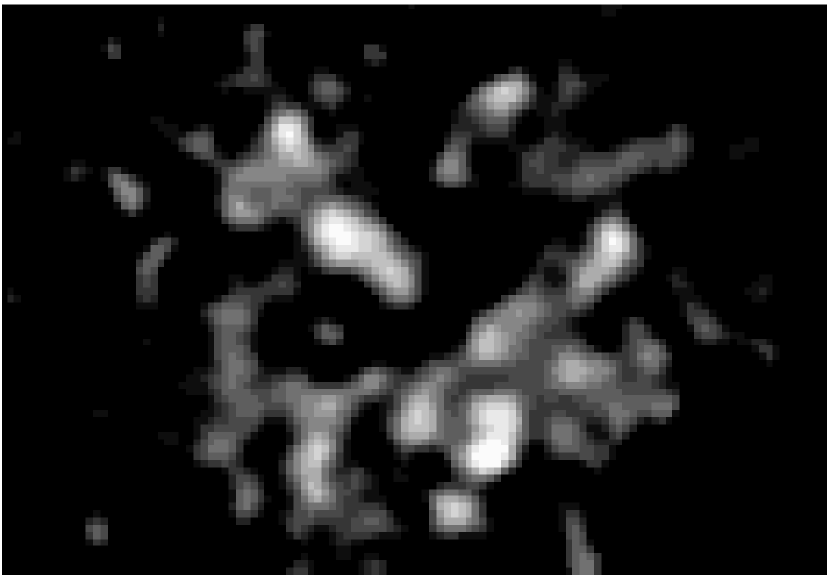
In Fig. 1 (right panel) we show a “color” image UV–V. We have chosen the V–band image since in the other optical images the PSF from the nuclear component dominates the central regions. The galaxy emission fills the field of view of both instruments, therefore the background is undetermined and the estimate of the color index of the jet is not straightforward (Sparks & Jorgensen, 1993). Such an analysis is well out of the purposes of this paper. However, a qualitative analysis of this image tells us that i) the region with similar spectral properties (the jet?) extends further than the “A” component, and its color is almost constant on a scale of ii) the “jet” is bluer than the underlying stellar emission of the host galaxy.
It is also important to compare the UV to the radio emission. As already mentioned, unfortunately no co–spatial radio observations are available in the literature. However, since the distance in frequency between radio and UV measurement is relatively high, we can roughly estimate the radio flux by subtracting the VLBI total flux (observed on the scale of mas from the nucleus) from the VLA core flux. This results in a rough estimate of the emission coming from the region between the VLA and the VLBI scales, i.e. some tenths of arcsec. Adopting the fluxes given by Xu et al. (2000), we obtain a value of the radio–UV spectral index , which is compatible with other synchrotron emitting jets (Sparks et al., 1996). Note that due to the large difference in frequency between the radio and the UV, an error of a factor two on one of the two measurements would result in a variation of only .
3.2 Synchrotron emission
The detection of synchrotron emission from a jet oriented at such a large angle to the line–of–sight is not expected at either optical or UV wavelengths, since the observed flux from relativistic jets is certainly affected by relativistic beaming. The observed flux is , where , is the bulk Lorentz factor, and is the flux observed in the comoving frame of the jet. 3C 270 has a quasisymmetric jet and counter–jet (on all scales and both in the radio and in the X–ray band), therefore, in the standard picture, the viewing angle should be quite large. This results in a small value for , and most of the jet radiation should be beamed away from our line–of sight444For a jet bulk Lorentz factor of 10, , which would reduce the observed flux by a factor , while for the flux is still reduced by a factor .. Although the extreme Lorentz factors () required in order to account for the BL Lac phenomenon are probably limited to the very innermost region of the jet (sub–pc), it is not yet clear where the jet deceleration takes place and what are the characteristics of the velocity gradients along the jet. Giovannini et al. (2001) and Xu et al. (2000) have pointed out that the low number of objects with detected VLBI counterjets in randomly oriented samples implies that motions with must be present, at least on the pc scale.
On larger scales, the study of jet asymmetries performed by Laing et al. (1999) suggest that FR I jets are still relativistic up to kpc from the core. Furthermore, the analysis of Sparks et al. (2000) of a statistically complete and randomly oriented sample of nearby FR I from the 3CR catalog, for which a set of homogeneous HST observations is available, shows that relativistic beaming plays indeed an important role in the detection of FR I optical jets on the kpc scale.
The chance of detecting a UV synchrotron jet in a highly misaligned source such as 3C 270 is significantly increased if lower speed components are present in the jet. This scenario might find support from radio observations of this object. Piner et al. (2001) have calculated that the viewing angle of the 3C 270 jet is , on the basis of the jet-counterjet ratio and the apparent jet velocity from VLBI data. According to their observations, the intrinsic velocity is . Although their estimate is only based on the motion of a single local maximum on the jet profile plots, this would corresponds to a mildly relativistic motion with a Lorentz factor , which might be expected if the jet has a velocity structure on the pc (and sub-pc) scales, for example a fast spine and a slower layer (Laing et al., 1999; Chiaberge et al., 2000)555If we assume a value of for the jet velocity, which appears to be more typical of the broad class of low luminosity radio galaxies, the jet-to-counterjet ratio (in the radio band and on the VLBI scale) implies that the viewing angle can be as large as .. In this case, the detection of synchrotron emission in highly misaligned sources ( or more) is possible, since with such low Lorentz factors the de-beaming effect does not affect dramatically the jet radiation. Note however, that if all FR I had significant emission from such a slow component, we would expect to observe optical jets in most of them, which is not the case. The probability of observing them might increase in the UV, due to the enhanced contrast between the jet emission and the underlying stellar galaxy component. However, HST/STIS UV images are available for 14 of the 24 FR I of the Sparks et al. (2000) sample. With the only possible exception of 3C 270, no “new” jets have been discovered (Allen et al., 2002). This further supports the idea that detection of jets is more strongly determined by relativistic beaming than by the contrast to the host galaxy emission.
We stress that whatever the viewing angle to 3C 270 (which however has to be rather large), the detection of a synchrotron UV jet implies that we are observing a component of the jet which moves slower than what is expected for a typical BL Lac nucleus, for which is constrained to be , at least at optical-UV frequencies (e.g. Tavecchio et al. 1998, Sikora et al. 1994). A low–velocity component must be present on larger scales, to account for the observation of X–ray emission from the kpc–scale jet (and counter–jet).
We can further test this scenario through a reverse argument, in the frame of the AGN unification schemes. We can calculate the luminosity of the “A” component as seen from an observer placed at a small angle to the axis of the jet (), under the assumption of highly relativistic motion of such a component. If we assume for the bulk Lorentz factor of the jet, for a large viewing angle () we obtain . Therefore, the luminosity , as observed on-axis would be erg s-1. We can compare this to the optical luminosity () of a BL Lac which has the same extended (unbeamed) radio power as 3C 270 ( erg s-1 Hz-1). Although there is a large scatter in the data ( dex), an average value of erg s-1 (see e.g. Chiaberge et al. 2000) represents a good estimate for its luminosity. Therefore, is at least 2 orders of magnitude higher than expected. In order for the “A” component not to outshine the inner BL Lac, we must set an upper limit for its bulk Lorentz factor (if the viewing angle to the jet in 3C 270 is , and even lower if is larger). This limit is therefore compatible with the scenario in which the UV emission observed on the scale of tens–of–pc is produced by a rather slow component of the jet.
3.3 Scattered emission from a misoriented BL Lac
Considering the potential difficulties about the synchrotron origin, we explore an alternative scenario, namely scattered radiation from the central regions. Such a phenomenon might indeed be observed only in highly misoriented sources. The observation of scattered radiation (both in the form of continuum and emission lines) from absorbed nuclei in Type 2 AGNs is the most striking confirmation of the unification schemes. The best examples of such a process can be found in spectropolarimetric data of Seyfert 2 and radio galaxies (Antonucci & Miller, 1985; Cohen et al., 1999) and in HST polarimetric images of Seyfert 2 galaxies (Capetti et al., 1995; Kishimoto et al., 2002). The observed phenomenology has been successfully interpreted as due to the presence of a hidden quasar nucleus, in which both the continuum emission from the accretion disk and the broad emission line region are seen through scattered light. The nature of the “mirrors” is still unknown, since the ambiguity between electron scattering and dust-grain scattering has not been clearly solved.
Since there are strong clues that the nuclear emission from any accretion disk is rather low in FR I (Chiaberge et al., 1999; Whysong & Antonucci, 2001; Perlman et al., 2001), the dominant nuclear source for the scattered light might reside in the base of the relativistic jet. The material responsible for scattering might be either the ISM or the jet itself. In the former case, the observed structure (i.e. component “A”) represents a direct evidence of the jet beam. Note that in such a scenario, the fact that the width of component A is unresolved at a distance of pc from the nucleus sets a limit to the half opening angle of the beam of the inner misoriented BL Lac as being . This in turn translates to a bulk Lorentz factor of the jet , which is consistent with the highly relativistic velocities required by modeling of the BL Lac overall emission (Ghisellini et al., 1998).
Let us now calculate the particle density of the scattering material. The radiation observed by any material located on the line of propagation of the jet can be estimated by considering the emission of a BL Lac object of the same intrinsic total power as 3C 270. We assume again erg s-1. Since the luminosity of component “A” is erg s-1 and it has a dimension of pc, the particle density inside the scattering cloud using , where R is the distance to the source of radiation (pc), is the particles cross section, is the particle density and is the volume of the scattering region. In case of scattering by electrons we obtain cm-3, while in case of scattering by dust we have (assuming normal dust/gas ratio) cm-3. More precisely, these values should be considered as lower limits, since the width of the “A” component might be unresolved, and therefore the volume of the jet might in turn be overestimated. Although both of them appear to be reasonable values, we stress that from the normalization of the thermal component in the X–ray spectrum666 The normalization of the thermal component is defined as , where V is the source volume in cm3, d is the distance to the source and are the electron and hydrogen density in the gas in cm-3. For a gas temperature of 0.6 keV, it is reasonable to assume . We then estimate by assuming that the gas is distributed in a sphere with radius pc (corresponding to 2 arcsec, i.e. the extraction radius for the X–ray spectrum). we obtain cm-3, which is in agreement with the value for we obtain in the electron scattering scenario.
We must point out that the presence of the jet might strongly affect the properties of the ISM, and the material might well be swept away along the line of propagation of the jet. In this case, the material responsible for scattering may reside either in an region which surrounds the jet, or inside the jet itself. In the latter scenario, the electrons of the jet, which are relativistic in their comoving frame since they emit synchrotron radiation at least in the radio band, may upscatter the nuclear emission via the inverse Compton process. Electrons with a Lorentz factor (which, assuming, as a reference value, a magnetic field Gauss emit synchrotron radiation in the radio band at GHz), can upscatter radio photons of frequency to frequencies as high as . For GHz and , we obtain Hz, i.e. UV emission. Clearly, more data at different frequencies are necessary for a detailed modeling of synchrotron and inverse Compton radiation.
Although with the available data we cannot firmly distinguish among the proposed different scenarios, either of them are consistent with the FR I–BL Lacs unification scheme. When interpreted in such a framework, these observations give us important information on the jet structure and the physical conditions in the central tens of parsecs. In particular, if the origin of the “A” component is synchrotron radiation from the jet, this implies that either a velocity structure in the jet must be present, or the whole jet has already slowed down on the scale of tens of parsecs. This provides an important “link” to the evidence for such stratification in jets which have already been found on larger (Laing et al., 1999) and smaller scales (Chiaberge et al., 2000; Giovannini et al., 1999).
We argue that the emission analogous to component “A”, with its intrinsic low surface brightness, might be visible only in a few selected objects. 3C 270 has to be considered as a special case for three main reasons: i) its low distance; ii) the presence of the dark disk; iii) the particular viewing angle, at which the “A” component is projected on the dark disk. We argue that all of these parameters combine in such way that 3C 270 represents a rather unique opportunity to observe resolved jet components in the UV regime on the scale of pc with current instruments.
The hard power–law in the X–rays obtained from the analysis of the Chandra data basically confirms the results obtained with both ASCA and ROSAT. As already argued by Capetti et al. (2000), we interpret the presence of a hard X–ray power law component in the nuclear SED as due to inverse Compton scattering, since this is indeed expected in the framework of the the AGN unification models. In particular, the presence of such spectral feature is a key characteristic of low energy–peaked BL Lac objects Giommi & Padovani (1994), to which 3C 270 should be unified.
3.4 Nuclear absorption
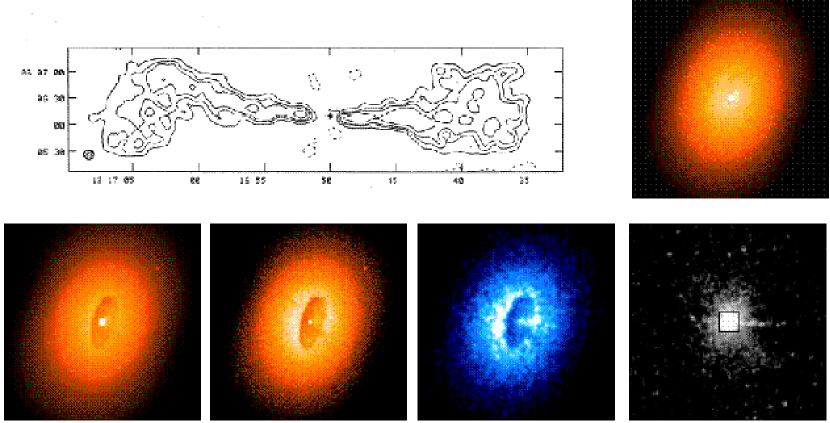
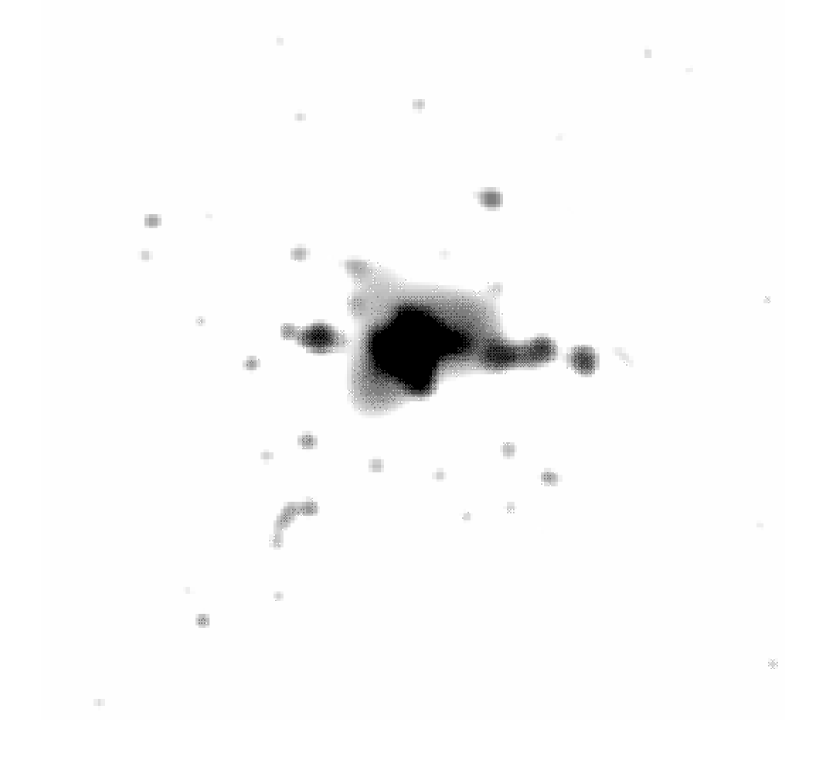
In Fig. 5 we show a “picture gallery” of 3C 270, as seen at different wavelengths. From left to right, in the upper panel, we report the radio map at 5 GHz as taken from Birkinshaw & Davies (1985), images at 1.6 m with HST/NICMOS (Capetti et al., 2000). In the lower panel: images at 6700 Å and 5500 Å with HST/WFPC2 (Ferrarese, Ford, & Jaffe, 1996), 2300 Å with HST/STIS (Allen et al., 2002), and the X–ray Chandra/ACIS archival image. The HST images are reproduced on the same scale (), which is reported for reference on the Chandra/ACIS image as a black empty square. The unresolved nucleus dominates the emission of the central region of the dark disk in the 1.6 m and 6700 Å images. For shorter wavelengths the nucleus is progressively fainter, and vanishes in the UV.
The absence of the nucleus, together with the presence of a “jet” which has its base at the location of the nucleus, is a clue that obscuration is only confined to the very innermost region (less than pc). To investigate the properties of the obscuring structure, we combine the HST data and the X–ray information obtained with the Chandra satellite. We can evaluate the absorption of the dusty disk by comparing the counts in different regions of the disk (along the semi–major axis) to the counts in a small box of pixels just outside the disk, arcsec east of the nucleus. We assume that the galaxy is optically thin to stellar light, therefore of the observed counts are produced between the disk and the observer, and are produced behind it. Along the line–of–sight to the disk, only the contribution from of the produced light is diminished by the presence of dust. Under this assumptions we obtain for both the F675W and the F547M images an optical extinction magnitudes. This has to be understood as a lower limit to the disk absorption. A lower fraction of stellar light produced in the far half of the galaxy and the presence of emission on the disk (star forming regions are commonly observed in dusty structures of nearby galaxies; e.g. Allen et al. 2002, Calzetti et al. 2001) would result in a higher value of . If the fraction of light from the back of the galaxy is only of the total, the value of increases to 2.5 (see Martel et al. 2000 for an extensive discussion on this issue).
A value of several magnitudes for the nuclear extinction is also compatible with the analysis of the spectral energy distribution of the core of 3C 270. In Chiaberge et al. (2002) we have shown that in the framework of synchrotron emission and assuming an intrinsic spectral index , the nucleus vanishes in the UV image when absorbed by a column density corresponding to . On the other hand, through the analysis of the SED of 3C 270 in the framework of the unified models, Capetti et al. (2000) have shown that 3C 270 might be well unified to the low energy peaked BL Lacs (LBL). Therefore, the intrinsic value of for this source might be higher than 1, and this would result in an even lower amount of nuclear absorption.
If we assume galactic gas–to–dust ratio to convert to (), our results seem to be in contrast to the value of as derived from the analysis of X–ray data. Our value for the X-ray absorption would result in mag. However, it is rather common to find that the determination of the absorbing column density from X–ray information differs from the results obtained with other methods. Among Seyfert galaxies, the estimate of made both using absorption features in the infrared spectrum and evaluating the reddening of optical and infrared emission lines is typically times (Maiolino et al., 2001; Granato et al., 1997). A similar result has also been recently found by Marconi et al. (2000) in the case of the closest FR I radio galaxy, Centaurus A, in which absorption towards the nucleus can well be provided by the kpc–scale dust lane. Interestingly, Maiolino, Marconi, & Oliva (2001) have proposed that the excess of X-ray absorption compared to the lower extinction in the optical and infrared can be accounted for by the presence of large grain dust which have small extinction efficiency. Another possible interpretation is that in 3C 270 the absorbing structure is “free” from dust.
Therefore, the observations of 3C 270 fit the scenario in which the nuclei of FR I radio galaxies are not obscured by the presence of optically and geometrically thick tori. The observed (rather small) amount of absorption in 3C 270 can be well provided by the extended dusty disk seen almost edge–on.
4 Summary and conclusions
We have analyzed and discussed HST and Chandra data of 3C 270. The HST/STIS UV image shows a jet–like feature (component “A”) originating from the location of the nucleus, at the same position angle as the radio and X–ray jet. The nucleus is clearly visible in the IR and optical images, and it is not detected in the UV. On the other hand, the emission of the jet-like feature is so low, that it cannot be detected in the optical images, due to the higher amount of stellar emission in that band compared to the UV. The color image UV–V shows that the jet is indeed bluer than the underlying stellar emission, while the radio–to–UV spectral index is consistent with other synchrotron jets.
We propose two basic scenarios for the origin of component “A”: i) non-thermal synchrotron emission from a slowly moving (possibly mildly relativistically) component of the relativistic jet; ii) scattered radiation. In case i), this would argue for the presence of mildly relativistic motions in the jet on the scale of tens of pc, in addition to the already achieved evidence for such motions on smaller (VLBI) and larger (VLA and X–rays jets) scales. In case ii) the ultimate origin for the emission may well reside in radiation from the base of the jet, which is scattered into our line of sight, confirming that 3C 270 is indeed a misoriented BL Lac. To test such pictures, co–spatial radio data are needed in order to identify the possible radio counterpart of the UV jet–like feature and thus constrain the broad–band spectral index and the emission mechanism. Another possible test for discriminating between the different scenarios can be provided by optical (and radio) polarimetric observations. In case of scattered radiation we expect the radiation to be polarized perpendicularly to the jet direction. In case of synchrotron emission, the polarization properties must be strictly connected to what is observed in the radio jet.
The X–ray spectrum of the nucleus shows a flat () power–law component, absorbed by a column density cm-2. The apparent discrepancy between this value and the low amount of absorption estimated in the optical, is however often found in other AGNs, such as Seyfert galaxies. The nuclear structure of 3C 270 appears to be in agreement with that of other FR I radiogalaxies: a standard optically and geometrically thick obscuring torus is not required to account for the observed properties. The origin for the discrepancy between the amount of absorption as estimated through different methods is still to be fully understood. The power–law component in the X–rays is a further indication of the presence of a BL Lac in its nucleus. We confirm that the flat slope observed for such a component can be interpreted as due to inverse Compton emission, analogously to what is observed in low energy–peaked BL Lacs.
References
- Allen et al. (2002) Allen, M. G. et al. 2002, ApJS, 139, 411
- Antonucci & Miller (1985) Antonucci, R. R. J. & Miller, J. S. 1985, ApJ, 297, 621
- Birkinshaw & Davies (1985) Birkinshaw, M. & Davies, R. L. 1985, ApJ, 291, 32.
- Calzetti (2001) Calzetti, D. 2001, PASP, 113, 1449.
- Capetti et al. (2000) Capetti, A., de Ruiter, H. R., Fanti, R., Morganti, R., Parma, P., & Ulrich, M.-H. 2000, A&A, 362, 871
- Capetti et al. (2000) Capetti, A., Trussoni, E., Celotti, A., Feretti, L., & Chiaberge, M. 2000, MNRAS, 318, 493
- Capetti et al. (1995) Capetti, A., Macchetto, F., Axon, D. J., Sparks, W. B., & Boksenberg, A. 1995, ApJ, 452, L87
- Celotti et al. (2001) Celotti, A., Ghisellini, G., & Chiaberge, M. 2001, MNRAS, 321, L1
- Chartas et al. (2000) Chartas, G. et al. 2000, ApJ, 542, 655
- Chiaberge et al. (2002) Chiaberge, M., Macchetto, F. D., Sparks, W. B., Capetti, A., Allen, M. G., Martel, A. R. 2002, ApJ, in press, astro-ph/0202035
- Chiaberge et al. (2000) Chiaberge, M., Celotti, A., Capetti, A., & Ghisellini, G. 2000, A&A, 358, 104
- Chiaberge et al. (1999) Chiaberge, M., Capetti, A., & Celotti, A. 1999, A&A, 349, 77
- Cohen et al. (1999) Cohen, M. H., Ogle, P. M., Tran, H. D., Goodrich, R. W., & Miller, J. S. 1999, AJ, 118, 1963.
- Davis (2001) Davis, J. E. 2001, ApJ, 562, 575
- de Koff et al. (1996) de Koff, S., Baum, S. A., Sparks, W. B., Biretta, J., Golombek, D., Macchetto, F., McCarthy, P., & Miley, G. K. 1996, ApJS, 107, 621.
- Faber et al. (1989) Faber, S. M., Wegner, G., Burstein, D., Davies, R. L., Dressler, A., Lynden-Bell, D., & Terlevich, R. J. 1989, ApJS, 69, 763.
- Fanaroff & Riley (1974) Fanaroff, B. L. & Riley, J. M. 1974, MNRAS, 167, 31P.
- Ferrarese, Ford, & Jaffe (1996) Ferrarese, L., Ford, H. C., & Jaffe, W. 1996, ApJ, 470, 444
- Ghisellini et al. (1998) Ghisellini, G., Celotti, A., Fossati, G., Maraschi, L., & Comastri, A. 1998, MNRAS, 301, 451
- Giommi & Padovani (1994) Giommi, P. & Padovani, P. 1994, MNRAS, 268, L51.
- Giovannini et al. (2001) Giovannini, G., Cotton, W. D., Feretti, L., Lara, L., & Venturi, T. 2001, ApJ, 552, 508.
- Giovannini et al. (1999) Giovannini, G., Taylor, G. B., Arbizzani, E., Bondi, M., Cotton, W. D., Feretti, L., Lara, L., & Venturi, T. 1999, ApJ, 522, 101.
- Granato et al. (1997) Granato, G. L., Danese, L., & Franceschini, A. 1997, ApJ, 486, 147.
- Hardcastle et al. (2002) Hardcastle, M. J., Worrall, D. M., Birkinshaw, M., Laing, R. A., & Bridle, A. H. 2002, MNRAS, 334, 182
- Hardcastle, Birkinshaw, & Worrall (2001) Hardcastle, M. J., Birkinshaw, M., & Worrall, D. M. 2001, MNRAS, 326, 1499
- Harris & Krawczynski (2002) Harris, D. E. & Krawczynski, H. 2002, ApJ, 565, 244.
- Jaffe et al. (1993) Jaffe, W., Ford, H. C., Ferrarese, L., van den Bosch, F., & O’Connell, R. W. 1993, Nature, 364, 213.
- Jones et al. (2001) Jones, D. L., Wehrle, A. E., Piner, B. G., & Meier, D. L. 2001, ApJ, 553, 968.
- Jones et al. (2000) Jones, D. L., Wehrle, A. E., Meier, D. L., & Piner, B. G. 2000, ApJ, 534, 165.
- Jones & Wehrle (1997) Jones, D. L. & Wehrle, A. E. 1997, ApJ, 484, 186.
- Kishimoto et al. (2002) Kishimoto, M., Kay, L. E., Antonucci, R., Hurt, T. W., Cohen, R. D., & Krolik, J. H. 2002, ApJ, 565, 155
- Laing et al. (1999) Laing, R. A., Parma, P., de Ruiter, H. R., & Fanti, R. 1999, MNRAS, 306, 513.
- Maiolino, Marconi, & Oliva (2001) Maiolino, R., Marconi, A., & Oliva, E. 2001, A&A, 365, 37
- Maiolino et al. (2001) Maiolino, R., Marconi, A., Salvati, M., Risaletti, G., Severgnini, P., Oliva, E., La Franca, F., & Vanzi, L. 2001, A&A, 365, 28.
- Marconi et al. (2000) Marconi, A., Schreier, E. J., Koekemoer, A., Capetti, A., Axon, D., Macchetto, D., & Caon, N. 2000, ApJ, 528, 276
- Martel et al. (2000) Martel, A. ;., Turner, N. J., Sparks, W. B., & Baum, S. A. 2000, ApJS, 130, 267.
- Martel et al. (1999) Martel, A. ;. et al. 1999, ApJS, 122, 81
- Matsumoto et al. (2001) Matsumoto, Y., Fukazawa, K., Iyomoto, N., & Makishima, K. 2001, PASJ, 53, 475
- Perlman et al. (2001) Perlman, E. S., Sparks, W. B., Radomski, J., Packham, C., Fisher, R. S., Piña, R., & Biretta, J. A. 2001, ApJ, 561, L51
- Perlman et al. (2001) Perlman, E. S., Biretta, J. A., Sparks, W. B., Macchetto, F. D., & Leahy, J. P. 2001, ApJ, 551, 206.
- Piner et al. (2001) Piner, B. G., Jones, D. L., & Wehrle, A. E. 2001, AJ, 122, 2954.
- Sambruna et al. (2002) Sambruna, R. M., Maraschi, L., Tavecchio, F., Urry, C. M., Cheung, C. C., Chartas, G., Scarpa R., Gambill, J. K. 2002, astro-ph/0201412
- Sambruna et al. (1999) Sambruna, R. M., Eracleous, M., & Mushotzky, R. F. 1999, ApJ, 526, 60
- Sikora, Begelman, & Rees (1994) Sikora, M., Begelman, M. C., & Rees, M. J. 1994, ApJ, 421, 153
- Sparks et al. (2000) Sparks, W. B., Baum, S. A., Biretta, J., Macchetto, F. D., & Martel, A. ;. 2000, ApJ, 542, 667
- Sparks et al. (1996) Sparks, W. B., Biretta, J. A., & Macchetto, F. 1996, ApJ, 473, 254.
- Sparks & Jorgensen (1993) Sparks, W. B. & Jorgensen, I. 1993, AJ, 105, 1753.
- Stark et al. (1992) Stark, A. A., Gammie, C. F., Wilson, R. W., Bally, J., Linke, R. A., Heiles, C., & Hurwitz, M. 1992, ApJS, 79, 77.
- Tavecchio et al. (2000) Tavecchio, F., Maraschi, L., Sambruna, R. M., & Urry, C. M. 2000, ApJ, 544, L23
- Tavecchio, Maraschi, & Ghisellini (1998) Tavecchio, F., Maraschi, L., & Ghisellini, G. 1998, ApJ, 509, 608
- Verdoes Kleijn et al. (2002) Verdoes Kleijn, G. A., Baum, S. A., de Zeeuw, P. T., & O’Dea, C. P. 2002, AJ, 123, 1334.
- Whysong & Antonucci (2001) Whysong, D., Antonucci, R. 2001, astro-ph/0106381
- Worrall et al. (2001) Worrall, D. M., Birkinshaw, M., & Hardcastle, M. J. 2001, MNRAS, 326, L7
- Xu et al. (2000) Xu, C., Baum, S. A., O’Dea, C. P., Wrobel, J. M., & Condon, J. J. 2000, AJ, 120, 2950