EFFECTS OF A BURST OF FORMATION OF FIRST-GENERATION STARS ON THE EVOLUTION OF GALAXIES
Abstract
First-generation (Population III) stars in the universe play an important role in early enrichment of heavy elements in galaxies and intergalactic medium and thus affect the history of galaxies. The physical and chemical properties of primordial gas clouds are significantly different from those of present-day gas clouds observed in the nearby universe because the primordial gas clouds do not contain any heavy elements which are important coolants in the gas. Previous theoretical considerations have suggested that typical masses of the first-generation stars are between several and although it has been argued that the formation of very massive stars (e.g., ) is also likely. If stars with several are most popular ones at the epoch of galaxy formation, most stars will evolve to hot (e.g., K), luminous () stars with gaseous and dusty envelope prior to going to die as white dwarf stars. Although the duration of this phase is short (e.g., yr), such evolved stars could contribute both to the ionization of gas in galaxies and to the production of a lot of dust grains if the formation of intermediate-mass stars is highly enhanced. We compare gaseous emission-line properties of such nebulae with some interesting high-redshift galaxies such as IRAS F10214+4724 and powerful radio galaxies.
keywords:
galaxies: formation - galaxies: evolution - galaxies: nuclei - galaxies: individual (IRAS F10214+4724) - galaxies: radio sources - planetary nebulae1 INTRODUCTION
In the standard big bang cosmology, the amount of heavy elements synthesized in the universe until the decoupling of matter from primordial radiation is negligibly small; i.e., where is the mass fraction of heavy elements (Wagoner, Fowler, & Hoyle 1967). On the other hand, gas clouds in the present-day galaxies have an appreciable amount of heavy elements ; e.g., the solar heavy element abundance is . This means that chemical and thermal properties of gas clouds in primeval galaxies at high redshift are significantly different from those in the present-day galaxies.
Just after the recombination of the universe, the hydrogen gas could be in atomic phase at a temperature of K. Then the formation of primordial hydrogen molecules can proceed through the gas phase reaction (e.g., Peebles & Dicke 1968). Since the rotational and vibrational transitions in hydrogen molecules can cool the gas further, the first generation stars can be born in such gas clouds at redshift - 30. Since the temperature is still much higher than a typical kinetic temperature of molecular gas clouds in the present-day galaxies (e.g., K), the initial mass function (IMF) in primeval galaxies may be different from that in the present-day galaxies; i.e., a Salpeter-like IMF (Salpeter 1955; Scalo 1986). Therefore, one of fundamental questions on the star formation in primeval galaxies is; “What kind of stars (i.e., Population III stars) were made in such extremely metal deficient gas clouds ?” [Matsuda, Sato, & Takeda 1969; Yoneyama 1972; Yoshii & Saio 1986 (hereafter YS86); Silk 1977a; Tegmark et al. 1997; Nakamura & Umemura 1999, 2001a, 2001b; Bromm et al. 1999, 2001, 2002; Coppi et al. 2001].
Applying the opacity-limited fragmentation theory [the fragmentation of gas clouds due to the gravitational instability continues until the fragments become to be optically thick to the cooling radiation (Silk 1977b, 1977c)], YS86 first derived an IMF for a hydrogen-helium gas cloud. They found that typical masses of the first-generation stars are from several to 10 . Nakamura & Umemura (1999) obtained similar results based on their one-dimensional hydrodynamical calculations together with nonequilibrium processes for hydrogen molecule formation. Abia et al. (2001) pointed out that the very large C and N enhancements observed in the extremely metal-poor stars in our Galaxy favor a Population III IMF peaked at intermediate-mass stars.
Recently, on one hand, some groups investigated the collapse and fragmentation of primordial, metal-free gas by numerical simulations (Abel, Bryan, & Norman 2000, 2002; Bromm et al. 1999, 2001, 2002; Coppi et al. 2001). They showed that the first generation gaseous clumps have masses of which corresponds to the Jeans mass of the gas with temperature a few 100 K and the density . As Bromm et al. (2002) assumed, if the clump masses are indicative of the final stellar mass, Population III stars may be more massive than . Nakamura & Umemura (2001a, 2001b) have developed their hydrodynamical simulations and found that the initial mass function of Population III stars may be bimodal with peaks of – and . The mass depends on the initial density and the initial fraction of molecular hydrogen () (Nakamura & Umemura 2001b). If is larger than for low-density ( cm-3), the effective HD cooling makes the high mass peak small to . However, if is smaller than , very massive stars with are formed preferentially.
In this way, the mass of first-generation stars is controversial. It seems also hard to examine observationally which mode is more feasible; i.e., Population III stars are either intermediate-mass star or very massive ones. If most Population III stars are as massive as , they could explode quickly and then contribute to the chemical enrichment of either galaxies or intergalactic medium or both (e.g., Madau, Ferrara, & Rees 2001 and references therein). Since usual Population II stars could be formed in cold gas clouds polluted chemically by first Population III stars, we cannot examine observationally whether or not such very massive stars were really formed in the primordial gas clouds. Furthermore, according to Nakamura & Umemura (2001a), proto-galactic clouds with a higher density tend to form intermediate-mass stars. If such proto-galactic systems are present, their evolution can be governed by evolution of the intermediate-mass stars whose lifetime is yr, being much longer than those of very massive stars. We investigate what happens and follows in such bursts of formation of intermediate-mass stars and discuss effects on the further evolution of galaxies, adopting the IMF of YS86. In particular, intermediate-mass stars experience inevitably the planetary-nebula-nucleus (PNN) phase, providing a lot of high-energy photons (e.g., Vassiliadis & Wood 1994). Therefore, it is expected that the galaxies appear to be luminous emission-line galaxies during the PNN phase. We discuss how they look and compare our model results with observations of some interesting high-redshift galaxies.
2 EVOLUTION OF POPULATION-III STARBURSTS IN FORMING GALAXIES
2.1 Initial Mass Function for Population III Stars derived by YS86
In many previous galaxy evolution models, it has been often assumed that stars are formed with a Salpeter-like initial mass function (IMF) in a galaxy;
| (1) |
where is the stellar mass in units of and is a normalization constant determined by the relation
| (2) |
which leads to
| (3) |
In this formulation, there are three free parameters; the power index (), and the upper and lower mass limits of the IMF ( and ). In order to describe the evolution of the solar neighborhood, one adopts conventionally = 1.35, , and or . However, it is highly uncertain whether or not this Salpeter-like IMF is applicable to the star formation history in primeval galaxies.
YS86 investigated the IMF for a hydrogen-helium gas cloud in detail based on the opacity-limited fragmentation theory. They found that typical masses of the first-generation stars are from several to 10 , depending on the assumed mass-luminosity relation for protostars derived by Silk (1977c); assuming that the opacity sources within the protostar is due to grains, he obtained the protostar luminosity
| (4) |
where and . Since this equation cannot be applicable to the luminosity of stars with , YS86 treated as well as as free parameters in the ranges and . Then YS86 found that the mass at the peak of the IMF is for and for . Another important conclusion in YS86 is that stars more massive than these peaks are formed less efficiently than those expected from the Salpeter IMF with . In addition, stars less massive than these peaks are also formed less efficiently than those expected from the same Salpeter IMF (see Figure 3 in YS86). Therefore, the IMFs derived by YS86 are significantly different from the Salpeter IMFs. We therefore adopt the IMFs of YS86 and investigate luminosity and spectral evolution of galaxies for various sets of the parameters.
For convenience, we present a parametric form of the YS86 IMF in the mass range between 1 and 60 for (YS86a),
| (5) |
and that for (YS86b),
| (6) |
Here the above numerical coefficients are determined by the following normalization for each case,
| (7) |
In Figure 1, we show the shapes of IMF which we use in this paper. Since the massive end slope of YS86a IMF is steepest, the number of massive stars () is smallest among the three, although the number of intermediate-mass star exceeds that of Salpeter IMF.
2.2 How Populous are Intermediate-Mass Stars ?
Prior going to investigating the luminosity and spectral evolution of galaxies using the YS86 IMFs given in equations (5) and (6), we estimate how populous intermediate-mass stars are in the YS86 IMFs with respect to those expected from usual Salpeter-like IMFs. Since it is expected that the most spectacular effect of intermediate-mass enhanced star formation is brought by a number of luminous PNNs with very high temperature K (e.g., Vassiliadis & Wood 1994). Since the mass of such high-temperature PNN progenitors lies in a range between and , we estimate how many stars within this mass range are formed.
If we adopt a Salpeter IMF, the number of stars with a mass range formed in the gas with 1 is estimated as
| (8) |
Using given in equation (3), we re-write equation (8) as
| (9) |
Taking and , we obtain the numbers for the following two cases; 1) = 1.35, , and , and 2) = 1.35, , and (see Table 1).
If we adopt a YS86 IMF, we can estimate the number of stars with a mass range by integrating equations (5) and (6) for and , respectively. The results are shown in Table 1. We also show the number if all stars have a mass of 5 ; i.e., the IMF is described as a function with .
As shown in Table 1, the number of intermediate-mass stars with – for the YS86 IMF with is nearly the same as that for the Salpeter IMF with . However, that for the YS86 IMF with is larger by a factor of 2.4 than that for the Salpeter IMF with . For both cases, the ratio of the number of intermediate-mass stars with – for YS86 IMFs to that for Salpeter IMF is within a factor of 3. If stars with mass of are only formed, the number is larger by a factor of 15 than that for the Salpeter IMF with (see section 3).
2.3 Galaxy Evolution Models
In this section, we show the evolution of bolometric luminosity, ionizing photon production rate, and emission line ratios of Population III star clusters with the YS86 IMFs. We adopt the yr burst model as the star formation history. We calculate the spectral energy distributions (SEDs) of star clusters by using the evolutionary population synthesis code PEGASE2 (Fioc & Rocca-Volmerange 1997, 2000). Although the code can be used to calculate the photometric evolution of galaxies being the effect of the chemical evolution into account, we calculate that of a single metallicity population with ; note that this metallicity is the poorest metallicity available in PEGASE2. The duration of the starburst is longer than the lifetime of the most massive star in our model (), yr (Girardi et al. 1996). Since the lifetime is a half of the starburst duration, the metallicity of a half of stars formed in the starburst is .
Figure 2 shows the SED evolution for each model: Salpeter IMF (solid lines), YS86a IMF (dotted lines) and YS86b IMF (dashed lines). We show the SEDs at 0.01 Gyr, 0.1 Gyr and 0.5 Gyr. Note that the ordinate is the flux in units of erg s-1 , corresponding to the case in which the total gas mass is . The SEDs are mainly determined by the upper main sequence stars and are not sensitive to the IMF. During the starburst, the ionizing photons are radiated from massive main sequence stars whose effective temperature is lower than about 60,000 K (Girardi et al. 1996). Therefore there is a large break at 228 Å; the photons with wavelength shorter than this are capable of ionizing the singly ionized helium. At an age of yr, hottest stars in the star cluster are not main sequence stars but post-asymptotic giant branch (AGB) stars whose progenitors are stars with a degenerate carbon core, e.g., intermediate-mass stars. The effective temperature of such post-AGB stars (i.e., PNNs) is about 200,000 K (Blöcker 1995). Therefore the break of 228 Å of such stars becomes to be small and thus the SED shape of far-UV is very hard.
The global shape of SED depends slightly on the IMF (Figure 3). During a period of the starburst, between yr and yr, colors (, , and ) become redder because of red supergiants. In this phase, the star cluster with the Salpeter IMF is reddest and that with the YS86a is bluest. This is because the number ratio of red supergiants to upper main sequence stars is highest for the Salpeter IMF () and lowest for the YS86a IMF (). On the other hand, for ages longer than yr, the star cluster with the Salpeter IMF is bluest and that with the YS86b is reddest. The reason for this is that the number ratio of redgiants to upper main sequence stars is lowest for the Salpeter IMF () and highest for the YS86b IMF ().
Figure 4 shows the evolution of bolometric luminosity of a star cluster of for various IMFs. The bolometric luminosity reaches its maximum at the end of starburst ( yr). The star cluster with the YS86b IMF is brightest while that with the YS86a IMF is faintest among the models. After that, following the death of massive stars, the bolometric luminosity of stellar systems decreases with time. The decreasing rate of the bolometric luminosity also depends on the functional form of IMF. Since the YS86a IMF has a peak at whose lifetime is about 0.15 Gyr, the decreasing rate of the bolometric luminosity is small till the time, and becomes large after that. Since the lifetime of stars with is about 5.6 Gyr, all the stars formed during the starburst have died till the time. As we show below, the dominant sources of the ionizing photons become the PNN at the age of 0.1 Gyr. The bolometric luminosity to mass ratios decrease from to during this period.
In the upper panel of Figure 5, we show the evolution of production rate of photons capable of ionizing neutral hydrogen, , which is calculated by integrating the spectra below 912 Å, and that of photons capable of ionizing ionized helium, , which is calculated by integrating the spectra below 228 Å. First, we mention how the production rate of the hydrogen ionizing photons evolves. As the bolometric luminosity increases, the ionizing photon production rate reaches its maximum at the end of starburst, because the lifetime of early B stars of is longer than yr. The evolution of depends on IMF. During the starburst, the ionizing photon production rate per unit mass is largest for the star cluster with the YS86b IMF but smallest for that with the YS86a IMF. In our calculations, we adopt the mass of most massive stars whose lifetime is about yr. When the age of star clusters reaches the lifetime of the most massive stars, the number of hydrogen ionizing photons begins to decrease with time, following the death of stars radiating hydrogen ionizing photons. At the age of yr, the intermediate-mass stars evolve to PNNs and they become dominant ionization sources for hydrogen. In the star cluster with the Salpeter IMF, the number of PNNs hardly changes and thus the production rate of ionizing photons is kept nearly constant. On the other hand, for the star cluster whose IMF is either YS86a or YS86b, the number of PNNs and the production rate of ionizing photons decrease with decreasing number of low mass stars. After the age of 1 Gyr, the ionizing photon production rate is highest for the star cluster with the Salpeter IMF and smallest for that with the YS86b IMF since it is proportional to the number of PNNs. Next, we comment on the evolution of the production rate of ionized helium ionizing photons. The lifetime of stars with is shorter than a few yr. After the massive stars have died, the remaining main sequence stars cannot ionize the neutral helium. When the age of the star cluster become yr, PNNs come into existence. The effective temperature of PNNs is very high enough to radiate He+ ionizing photons.
The lower panel of Figure 5 shows the evolution of the ratio of to which indicates the hardness of UV spectra. During the starburst, the ratio is lower than . However, after PNNs become the dominant source of UV radiation, the ratio exceeds . The stellar mass of a progenitor of PNN decreases with time. Therefore, the effective temperature of PNN decreases and thus the ratio of to also decreases (Vassiliadis & Wood 1994).
We investigate ultraviolet emission-line properties of the gaseous nebula photoionized by PNN clusters during the course of galaxy evolution. We use the photoionization code CLOUDY94 (Ferland 1997), which solves the equations of statistical and thermal equilibrium and produces a self-consistent model of the run of temperature as a function of depth into the nebula. Here we assume that a uniform density, dust-free gas cloud with plane-parallel geometry is ionized by various continuum sources. The parameters for the calculations are (1) the hydrogen density of the cloud, , (2) the ionization parameter, , where is the number of ionizing photons, is the distance from the ionizing source, and is the speed of light (Osterbrock 1989), (3) the SED of the ionizing radiation, and (4) the chemical composition. The SED of the ionizing radiation is derived as noted before using PEGASE2 (see Figure 2). We perform our photoionization calculations as a function of the ionization parameter between and with a logarithmic interval of 0.5. We adopt . We also adopt a metallicity of . The calculations were stopped when the temperature fell to 3000 K, below which little optical emission is expected.
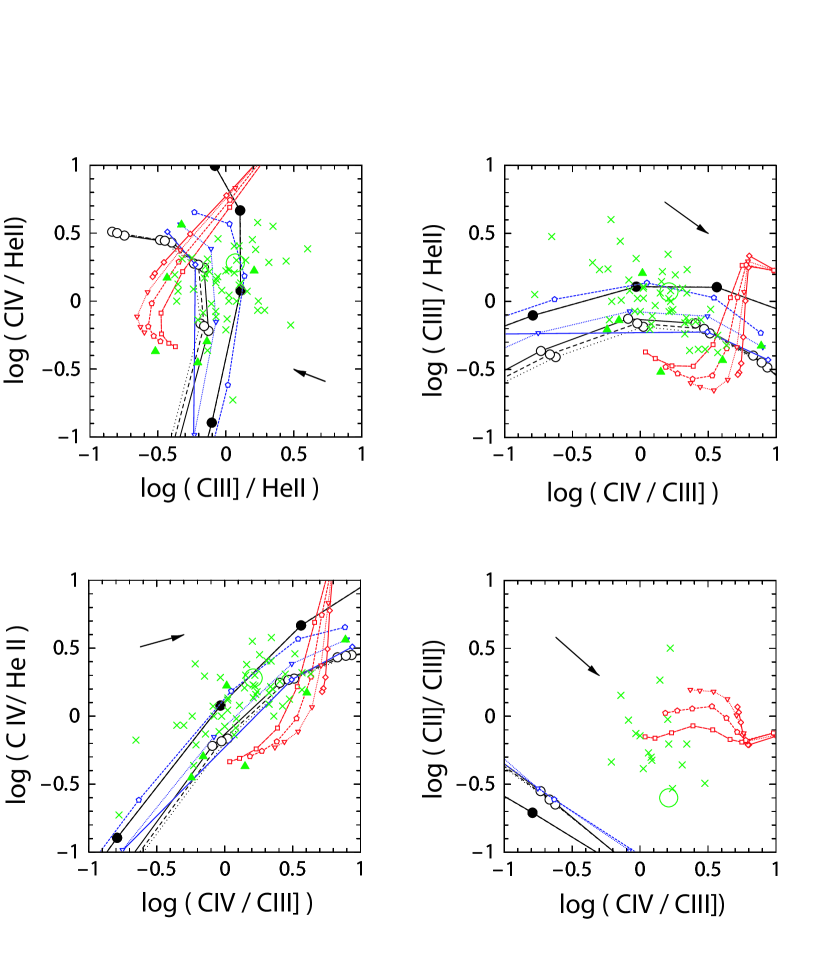
For reference, we also calculate AGN photoionization models and shock-heating models in the following ways. a) AGN photoionization models are calculated by using CLOUDY94. We adopt that the input SED has a power-law form with (). b) Shock-heating models are taken from results of Dopita & Sutherland (1996). Their models assume solar metallicities, shock velocities from to , and the magnetic parameter . The PNN photoionization model results are shown together with these models in Figure 6; the UV emission-line diagnostic diagrams proposed by De Breuck et al. (2000).
Since high-energy photons supplied from the PNN clusters can cause high-ionization lines such as C iv, the UV emission-line properties of the PNN photoionization models are quite similar to those of the AGN photoionization. In particular, the model locus predicted for yr-burst stellar populations with age of 0.5 Gyr cannot be distinguished from that for the AGN models with a power-law continuum with . This similarity has been already utilized to show that some LINERs (low-ionization nuclear emission-line regions: Heckman 1980) can be explained by photoionization by PNN clusters (Taniguchi, Shioya, & Murayama 2000). On the other hand, the shock-heating models appear to show different properties from those of the PNN and AGN models.
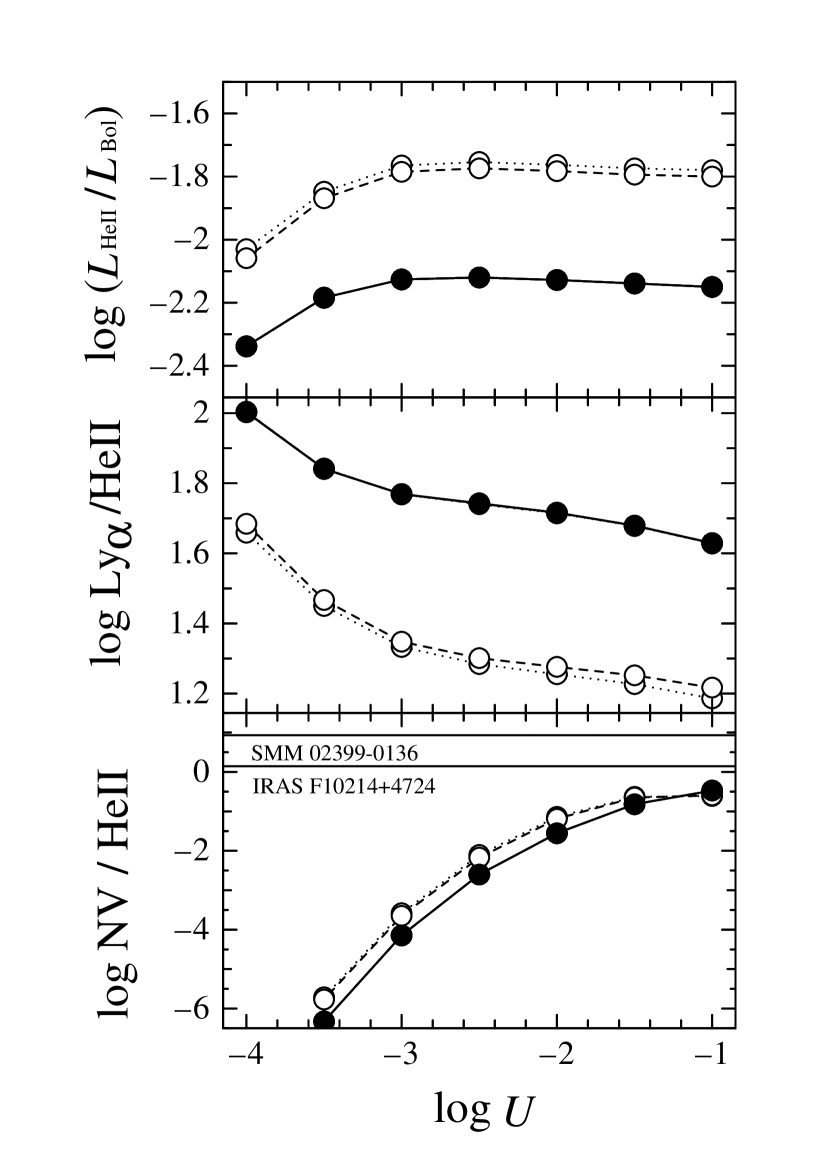
Figure 7 shows the , Ly/He ii, and N v/He ii ratios as a function of for PNN models with age of 0.1 Gyr (open circles) and 0.5 Gyr (filled circles). These ratios hardly depend on the IMF but depend on the age.
Recently, the evolutionary tracks of zero-metal stars have been published (e.g., Marigo et al. 2001). Based on these new models, Schaerer (2002) demonstrated that massive population III stars can radiate the He+ ionizing photons because of both the high effective temperature ( K) of zero-metal stars and the effect of the non-LTE stellar atmosphere (see also Tumlinson & Shull 2000). The small ratio during the starburst shown in Fig.5 is attributed to the use of the population synthesis model with metallicity of instead that with . We note, however, H ii regions around massive population III stars cannot radiate metal lines in which we are interested since the gas around massive Population III stars is still primordial.
2.4 Comparison with high-z star forming galaxies
If the star formation in some forming galaxies takes place with YS86 IMF, such galaxies could experience a PNN-dominated phase yr after the initial starburst. Therefore it seems important to look for such galaxies at high redshift. As is shown in section 2.3, the SED of star clusters in PNN-dominated phase is so hard that the emission-line properties of the gaseous nebula photoionized by PNN clusters are indistinguishable from those photoionized by AGN. Considering the stellar evolution of intermediate mass stars, the PNN phase follows the post-AGB phase when stars eject a dusty gaseous envelope. It is therefore expected that the PNN cluster is surrounded by dusty gas (see the next section). Until the PNN-dominated phase begin, dust formed in the ejecta of Type II supernovae is also present in the interstellar medium (Todini & Ferrara 2001). Therefore, a part of ionizing photons could be absorbed by such dust grains. However, we neglect this effect in the following discussion for simplicity.
The above expected features of the PNN star cluster are very interesting because the PNN star cluster may be observed as a dusty, ultraluminous infrared galaxy with high-ionization emission lines at high redshift. It is known that some high- forming galaxy candidates share nearly the same properties; e.g., IRAS F 102144724 at (Rowan-Robinson et al. 1991) and SMM 023990136 at (Ivison et al. 1998). Their observed huge luminosities () have been often considered to be powered by massive stars. However, high-ionization emission lines such as C iv 1549 Å and N v 1240 Å are also observed in them. Since these emission lines cannot be produced by photoionization by ordinary massive stars, it has been often considered that active galactic nuclei (AGNs) also reside in them (Ivison et al. 1998; Serjeant et al. 1998). In particular, the presence of hidden broad emission lines reinforces this interpretation for IRAS F102144724 (Goodrich et al. 1996). Spectropolarimetry of SMM J023990136 reveals that the polarization behavior is similar to BAL quasars (Vernet & Cimatti 2001). Even in the local universe, bursts of star formation (starbursts) are sometimes associated with galaxies hosting AGNs and thus the simultaneous presence of both starburst and AGNs may not be unusual (e.g., Taniguchi 1999; Mouri & Taniguchi 2001; Storchi-Bergmann et al. 2001). However, the evidence for AGNs in them has been obtained often by rest-frame ultraviolet and optical emission lines which are subject to misunderstanding in some cases (Taniguchi et al. 1999; Lutz, Veilluex, & Genzel 1999). Since the effective temperatures of PNNs exceed K, high energy photons are much more numerous than those from ordinary massive stars. Here we examine whether or not the PNN cluster is responsible for the formation of high-ionization emission lines.
In Figure 6, we plot the observed positions of IRAS F10214+4714 (Serjeant et al. 1998) and the high- powerful radio galaxies studied by De Breuck et al. (2000). Although the high- powerful radio galaxies have an AGN, at least some of them are considered to be very young galaxies (e.g., Eales et al. 1993). We also plot available data of planetary nebulae (Feibelman 2000). It is found that the emission line ratios of IRAS F10214+4724 as well as the high- powerful radio galaxies in these UV diagnostics can be explained either by the AGN models with or by the PNN model with an age of 0.5 Gyr. The similar behaviors between the PNN and AGN photoionization models unable us to distinguish the two models unfortunately.
It is noted that both the AGN and PNN models appear to underpredict the C ii]/C iii ratio as shown in the right-lower panel in Figure 6. This discrepancy suggests that the observed UV emission-line ratios of IRAS F10214+4714 and the high- powerful radio galaxies can be explained either by a combination between the shock heating and the AGN photoionization or by a combination between the shock heating and the PNN photoionization.
Next, we study whether or not the star clusters dominated by PNNs can explain the luminosity of high- forming galaxy candidates. As shown in section 2.2 the bolometric luminosity to mass ratio changes from to . Therefore, the mass of stellar system needed to reproduce the bolometric luminosity of IRAS F10214+4724 (), is . This value is comparable to the stellar mass of massive galaxies. It is impossible to radiate the huge luminosity from only PNNs of first generation stars for this galaxy. There are two reasons why it is hard to explain the huge luminosity by a lot of PNNs. As shown in section 2, even for the YS86’s IMF the number of intermediate-mass stars (e.g., ) is only a few time larger than that for the Salpeter IMF. The other reason is related to the difference of the lifetime of progenitor stars. The lifetime of stars with mass of is yr and that of is yr (Girardi et al. 1996). Therefore, the mass range of stars which evolve to PNNs at the same time is very small and as a result the number of those stars is very small. To solve this discrepancy, we consider an extreme model in the next section.
3 AN EXTREME MODEL
3.1 Scenario
Here, we consider an extreme case that the formation of intermediate-mass stars occurs during a period of . Most luminous forming galaxy candidates at high redshift contain a lot of molecular gas (e.g., ) and their inferred star formation rates (SFR) are of the order of yr-1 (Frayer et al. 1998, 1999). Therefore, we assume that a galaxy has a gas mass of and the initial star formation occurs at a rate of yr-1. We adopt a duration of the star formation yr. The gas mass converted to stars is estimated as . Thus in this model, the star formation efficiency is 10%. The star formation may take place in a central region (say, within a radius of 1 kpc) of galaxies. We assume for simplicity that all stars formed in this initial star formation have a mass of 5 (i.e., a typical intermediate-mass star). Therefore, the SFR adopted above means that 200 stars with are formed in a year; stars yr-1.
Here we consider the evolution of a cluster of such stars. The bolometric luminosity of each star in the main sequence phase is and the age of the star is years. The total number of stars formed in the duration is (total) = stars. Therefore, the total luminosity of the star cluster increases during the star formation period ( years) at a rate of yr-1 and reach the maximum bolometric luminosity at years. This maximum luminosity keeps as long as the stars are alive; i.e., up to years. Shortly after this age, the stars evolve from the main sequence to PNNs through AGB.
Since one PNN has a bolometric luminosity of (e.g., Vassiliadis & Wood 1994), the total PNN luminosity amounts to where yr is the lifetime of the PNN phase. Nevertheless this short lifetime, note that the PNN phase in the star cluster continues during nearly the same period as that of star formation; i.e., yr. In the PNN phase, the total luminosity of the star cluster is mostly dominated by unevolved main sequence stars while the ionizing photons are supplied mainly by PNNs.
Another important property of the PNN phase is that a lot of gas is ejected from the stars. The core mass of each star is estimated to be . Therefore, each star ejects a metal-enriched gas of . The total ejected gas mass amounts to . Since the gas-to-dust mass ratio in such gas may be 100, the star cluster can produce a lot of dust grains with a mass of .
In summary, the PNN phase of the star cluster has the following properties; 1) the bolometric luminosity is ; 2) the ionizing luminosity is ; 3) the ionizing continuum is so hard that it creates highly-ionized regions around the star cluster; 4) the dust mass is ; 5) the heavy element abundance is increased up to , and 6) this phase lasts for yr given that the duration of star formation is yr.
3.2 Emission-line properties of the PNN cluster
As shown in section 2.3, the PNN cluster is capable of the formation of the high-ionization lines such as C iv 1549 and C iii] 1909 emission lines. For example, the observed C iv/He ii ratios are 5.7 and 1.9 for SMM 023990136 and IRAS F102144724, respectively (Ivison et al. 1998; Serjeant et al. 1998). However, our models cannot explain the observed higher ratios of N v1240/He ii; 8.5 for SMM 023990136 (Ivison et al. 1998) and 1.4 for IRAS F102144724 (Serjeant et al. 1998) (see Figure 7). In our model, we have assumed that each heavy element abundance is five percent of its solar value. If only the helium burning occurs in the core of PNN, carbon could be enriched. However, if the hydrogen burning also occurs, nitrogen could be enriched because nitrogen is formed as the end product of CNO cycle in the core. If such nitrogen enrichment occurs, the observed strong N v emission may be explained. It is worthwhile noting that the overabundance of nitrogen is also suggested for the broad emission-line gas in high- quasars (Hamann & Ferland 1993, 1999).
3.3 Further Evolution of the Star Cluster
We consider the final fate of the star cluster in our model given in section 3.1. The intermediate-mass stars formed in the initial starburst will evolve to white dwarf (WD) stars with a mass of through the phases of AGB and planetary nebula. Since the evolved WD stars have a luminosity of at their ages of yr, the star cluster formed in the starburst becomes finally very faint; i.e, . Since there is no such candidate in the local universe, it is expected that further star formation could have occurred in galaxies even if starbursts with only intermediate-mass stars occurred in the galaxies. After the death of PNN stars, dust grains with a mass of are left in a galaxy. Since the galaxy has the gas with a mass of , the heavy element abundance increases at a level of after the PNN phase. Therefore, so-called Population II stars would form in the gas clouds polluted chemically by the intermediate-mass stars. In other word, galaxies with a PNN cluster may evolve to ordinary galaxies observed in the present-day universe.
3.4 Final Remarks
What we would like to propose in this section is not that some particular high- dusty galaxies are indeed the PNN galaxies but that candidates of the extreme PNN galaxies share nearly the same properties of the observed high- dusty galaxies. Recent deep surveys both at FIR and submillimeter wavelengths have discovered a significant number of hyperluminous dusty galaxies at high redshift (Rowan-Robinson et al. 1991; Kawara et al. 1998; Puget et al. 1999; Smail, Ivison, & Blain 1997; Hughes et al. 1998; Barger et al. 1998; Eales et al. 1999; Rowan-Robinson 2000). If some proto-galactic systems tend to form intermediate-mass stars preferentially as Population III stars, it is possible that candidates of the PNN galaxies may be found in some high- dusty galaxies. If present, such galaxies will be detected in future sensitive search for dusty galaxies made by Atacama Large Millimeter Array (ALMA; Kurz & Shaver 1999). Deep optical spectroscopy using new 30-m class telescopes will be also necessary to investigate detailed rest-frame UV spectra of such high- dusty galaxies.
We would like to thank Gary Ferland for making his code CLOUDY available to the public. We would like to thank Hideyuki Saio and Satoru Ikeuchi for useful discussion. We would also like to thank an anonymous referee for his/her useful comments and suggestions. This work was financially supported in part by Grant-in-Aids for the Scientific Research (Nos. 10044052, and 10304013) of the Japanese Ministry of Education, Culture, Sports, and Science. YS is JSPS fellow.
References
- (1) Abia, C., Dominguez, I., Straniero, O., Limongi, M., Chieffi, A. & Isern, J. 2001, ApJ, 557, 126
- (2) Abel, T., Bryan, G. L., & Norman, M. L. 2000, ApJ, 540, 39
- (3) Abel, T., Bryan, G. L., & Norman, M. L. 2002, Science, 295, 93
- (4) Barger, A., et al. 1998, Nature, 394, 248
- (5) Blöcker, T. 1995, A&A, 299, 755
- (6) Bromm, V., Coppi, P. S., & Larson, R. B. 1999, ApJ, 527, L5
- (7) Bromm, V., Ferrara, A., Coppi, P. S., & Larson, R. B. 2001, MNRAS, 328, 969
- (8) Bromm, V., Coppi, P. S., & Larson, R. B. 2002, ApJ, 564, 23
- (9) Coppi, P., Bromm, V., & Larson, R. B. 2001, astro-ph/0103382
- (10) De Breuck, C., Röttgering, H., Miley, G., van Breugel, W., & Best, P. 2000, A&A, 362, 519
- (11) Dopita, M. A., & Sutherland, R. S. 1996, ApJS, 102, 161
- (12) Eales, S. A., Rawlings, S., Puxley, P., Rocca-Volmerange, B., & Kuntz, K. 1993, Nature, 363, 140
- (13) Eales, S., et al. 1999, ApJ, 515, 518
- (14) Feibelman, W. A. 2000, PASP, 112, 861
- (15) Ferland, G. J. 1997, Hazy: A Brief Introduction to Cloudy 94.00 (Lexington: Univ. Kentucky Dept. Phys. Astron.)
- (16) Fioc, M., & Rocca-Volmerange, B. 1997, A&A, 326, 950
- (17) Fioc, M., & Rocca-Volmerange, B. 1999, astro-ph/9912179
- (18) Frayer, D. T., Ivison, R. J., Scoville, N. Z., Yun, M., Evans, A. S., Smail, I., Blain, A. W., & Kneib, J. -P. 1998 ApJ, 506, L7
- (19) Frayer, D. T., et al. 1999, ApJ, 514, L13
- (20) Girardi, L., Bressan, A., Chiosi, C., Bertelli, G., & Nasi, E. 1996, A&AS, 117, 113
- (21) Goodrich, R. W., Miller, J. S., Martel, A., Cohen, M. H., Tran, H. D., Ogle, P. M., & Vermeulen, R. C. 1996, ApJ, 456, L9
- (22) Hamann, F., & Ferland, G. 1993, ApJ, 418, 1
- (23) Hamann, F., & Ferland, G. 1999, ARA&A, 37, 487
- (24) Heckman, T. M. 1980, A&A, 87, 152
- (25) Hughes, D. H., et al. 1998, Nature, 394, 221
- (26) Ivison, R. J., et al. 1998, MNRAS, 298, 583
- (27) Kawara, K., et al. 1998, A&A, 336, L9
- (28) Kurz, R., & Shaver, P. 1999, The Messenger, No. 96, 7
- (29) Lutz, D., Veilleux, S., & Genzel, R. 1999, ApJ, 517, L13
- (30) Madau, P., Ferrara, A., & Rees, M. J. 2001, ApJ, 555, 92
- (31) Marigo, P., Girardi, L., Chiosi, C., & Wood, P. R. 2001, A&A, 371, 152
- (32) Matsuda, T., Sato, H., & Takeda, H. 1969, Prog. Theor. Phys., 42, 219
- (33) Mouri, H., & Taniguchi, Y. 2002, ApJ, 565, 786
- (34) Nakamura, F., & Umemura, M. 1999, ApJ, 515, 239
- (35) Nakamura, F., & Umemura, M. 2001a, ApJ, 548, 19
- (36) Nakamura, F., & Umemura, M. 2001b, astro-ph/0106009
- (37) Osterbrock, D. 1989, Astrophysics of Gaseous Nebulae and Active Galactic Nuclei (Mill Valley: University Science Books)
- (38) Peebles, P. J. E., & Dicke, R. H. 1968, ApJ, 154, 891
- (39) Puget, J. L., et al. 1999, A&A, 345, 29
- (40) Rowan-Robinson, M. M. 2000, MNRAS, 316, 885
- (41) Rowan-Robinson, M. M., et al. 1991, Nature, 351, 719
- (42) Salpeter, E. E. 1955, ApJ, 121, 161
- (43) Scalo, J. M. 1986, Fund. Cos. & Phys., 11, 1
- (44) Schaerer, D. 2002, A&A, 382, 28
- (45) Serjeant, S., et al. 1998, MNRAS, 298, 321
- (46) Silk, J. 1977a, ApJ, 211, 638
- (47) Silk, J. 1977b, ApJ, 214, 152
- (48) Silk, J. 1977c, ApJ, 214, 718
- (49) Smail, I., Ivison, R. J., & Blain, A. W. 1997, ApJ, 490, L5
- (50) Storchi-Bergamnn, T., Gonzáles Delgado, R. M., Schmitt, H. R., Cid Fernandes, R., & Heckman, T. 2001, ApJ, 559, 147
- (51) Taniguchi, Y. 1999, ApJ, 524, 65
- (52) Taniguchi, Y., Shioya, Y., & Murayama, T. 2000, AJ, 120, 1265
- (53) Taniguchi, Y., Yoshino, A., Ohyama, Y., & Nishiura, S. 1999, ApJ, 514, 660
- (54) Tegmark, M., Silk, J. Rees, M. J., Blanchard, A., Abel, T., & Palla, F. 1997, ApJ, 474, 1
- (55) Todini, P., & Ferrara, A. 2001, MNRAS, 325, 726
- (56) Tumlinson, J., & Shull, J. M. 2001, ApJ, 528, L65
- (57) Vassiliadis, E., & Wood, P. R. 1994, ApJS, 92, 125
- (58) Vernet, J., & Cimatti, A. 2001, A&A, 380, 409
- (59) Wagoner, R. V., Fowler, T. A., & Hoyle, F. 1967, ApJ, 148, 3
- (60) Yoneyama, T. 1972, PASJ, 24, 87
- (61) Yoshii, Y., & Saio, H. 1986, ApJ, 301, 587 (YS86)
| IMF | |
|---|---|
| Salpeter () | 0.0052 |
| Salpeter () | 0.0136 |
| YS86 ()(YS86a) | 0.0323 |
| YS86 ()(YS86b) | 0.0149 |
| -function () | 0.2 |