Sub-Milliarcsecond Imaging of Quasars and Active Galactic Nuclei
II. Additional Sources
Abstract
We report further results from our imaging survey at 15 GHz (=2 cm) with the Very Long Baseline Array. This paper presents single epoch images for 39 sources, bringing the total number of objects in the sample to 171. Our sample is representative of a complete unbiased sample and it will be used for statistical analysis of source properties. We compare the observed brightness temperatures derived from our VLBA observations to those derived from total intensity variations at 22 and 37 GHz. These are consistent with intrinsic brightness temperatures in the range to K. We also present three new spectroscopic redshift values: =0.517 for 0026+346, =1.591 for 0727–115, and =0.2016 for 1155+251.
Images from this VLBA 2 cm survey are available on the Internet under http://www.cv.nrao.edu/2cmsurvey.
1 Introduction
We have been using the Very Long Baseline Array111The National Radio Astronomy Observatory and the Very Long Baseline Array are operated by Associated Universities, Inc., under cooperative agreement with the U.S. National Science Foundation (VLBA; Napier 1994) since 1994 to study a sample of compact radio sources at 15 GHz ( cm). We are particularly interested in the scientific aspects related to: a) the morphology of the compact radio sources associated with quasars and radio galaxies (see Zensus 1997); this includes comparisons with results from longer-wavelength studies; b) source variability; c) statistics of internal kinematics; d) correlations of the radio results with other properties, e.g., redshift and high-energy luminosity. Our ultimate goal is to derive implications for the relationship between different classes of AGN, for their physical and cosmological evolution, and for the physics of radio jets.
The images and results of the first 132 sources of our sample were published by Kellermann et al. (1998) (hereafter Paper I). The “complete” sample includes 39 additional sources. Images of these objects and three new redshifts are presented and discussed in this paper. The results of the full project from all epochs are accessible on the Internet at http://www.cv.nrao.edu/2cmsurvey.
Throughout the paper we use a Hubble constant, =65 km s-1 Mpc-1 and the deceleration parameter, =0.5.
2 Definition of the sample
Our sample consists of 171 sources that were observed during the period 1994-2002. Our initial selection criterion included all sources from the catalog of Stickel et al. (1994) which are strong (S1.5 Jy for and S2 Jy for ), and which have a flat radio spectrum (, S) at any frequency above 500 MHz. The Stickel catalog is complete only at 5 GHz, and we have used other measurements or extrapolations to form our 15 GHz sample (see Paper I). We have now observed 93 of the 124 sources that fit the above criteria. The remaining 31 sources222The missing sources are: 0113–118∗, 0138–097, 0146+056∗, 0248+430∗, 0256+075, 0332+078, 0400+258, 0403–102∗, 0446+112∗, 0539–057, 0743–006, 0831+557∗, 0833+585, 0954+556, 0954+658, 1030+415, 1039+811, 1147+245, 1216+487, 1222+131, 1418+546, 1637+574, 1725+044, 1732+389, 1751+441, 1936–155∗, 2008–159∗, 2029+121∗, 2203–188∗, 2216–038, 2254+074. An asterisk indicates that this source was observed in as part of a separate program by Gurvits, Fomalont, & Kellermann (in preparation). were not observed for a variety of logistic and technical reasons (especially scheduling constraints due to limited observing time), however we consider the 93 sources as representative of an unbiased sample.
An additional 78 sources did not originally fit our criterion but were added because subsequent measurements, including RATAN 600 observations at 15 GHz (Kovalev et al. 1999), showed that they did. They are not in the Stickel catalogue.
Most, if not all, flat-spectrum sources are variable. Thus, at any given time, some sources with mean flux density below the flux limit of a survey will nevertheless be included because they are in a high state, and others with mean flux density above the flux limit will not make it into the sample because they happen to be in a low state. Because of the steep source count or function, there will be more sources “inappropriately” included than are missed. To the extent that the flux density that we used to determine our sample is from a single measurement, the statistical content of the sample is independent of the epochs of measurement; i.e. of the specific sources which comprise the sample (see also Drinkwater et al. 1997). In our case we have a mixture of measurements at 15 GHz and some extrapolations from lower frequencies. Although it is not possible to quantify the statistical effect of this mixture, we conclude that our list is representative of an unbiased, flux-limited sample. As such it is useful for statistical studies of strong compact radio sources.
Pearson & Readhead (1988) have presented a complete sample of 65 sources defined by 35∘; 10∘; and S1.3 Jy. 32 of these do not match either our flux density or our spectral index criterion. We have observed 31 of the remaining 33 objects. Thus there are only two sources3330831+557, 0954+556 missing from the complete sample defined by both the selection criteria of the Pearson & Readhead (1988) sample and ours.
New spectroscopic redshifts for three sources are reported here: 0026+346 with =0.517, 0727–115 with =1.591, and 1155+251 with =0.2016; details are given in Appendix A. This now leaves 9 sources out of the 171 without a redshift. Two of these sources are in empty fields (i.e., regions without compact optical features brighter than 20 mag), and identifications for the others are shown in Table 2. These identifications are taken from the literature with the aid of the NASA/IPAC Extragalactic Database (NED) and the SIMBAD Database. The radio galaxies are optical galaxies identified with sources in radio catalogs. Quasars are optically unresolved objects with broad emission lines and, in some cases, absorption lines. BL Lac objects have weak or no emission lines in their spectra.
| R.A. | Decl. | gg Flux density at 5 GHz, taken mostly from Stickel et al. (1994). | # of | |||||
|---|---|---|---|---|---|---|---|---|
| Sourceaa IAU source designation. | Namebb Alternative source name where appropriate. | (J2000.0)cc Right ascension and declination (J2000.0). | (J2000.0)cc Right ascension and declination (J2000.0). | IDdd The optical counterpart, denoted as follows: (G) galaxy, (Q) quasar, or (BL) BL Lac object | ee Optical magnitude. | ff Redshift. | (Jy) | epochs |
| Sources presented in this paper | ||||||||
| 0108388 | G | 22.00 | 0.668(1) | 1.34 | 1 | |||
| 0119115 | Q | 19.50 | 0.57(1) | 1.01 | 1 | |||
| 0201113 | Q | 19.50 | 3.56(1) | 0.84 | 1 | |||
| 0221067 | 4C 06.11 | Q | 20.00 | 0.511(1) | 1.03 | 2 | ||
| 0310013 | Q | 18.24 | 0.664(2) | 0.72 | 1 | |||
| 0405385 | Q | 18.00 | 1.285(3) | 1.09 | 1 | |||
| 0420022 | BL | 19.50 | … | 1.22 | 1 | |||
| 0723008 | BL | 17.50 | 0.127(1) | 1.11iiTaken from the UMRAO Radio Survey Flux Database (http://www.astro.lsa.umich.edu/obs/radiotel/umrao.html, see Hughes et al. 1992). | 1 | |||
| 0834201 | Q | 19.40 | 2.752(5) | 3.72 | 2 | |||
| 0836710hhDetected by the EGRET instrument on the Compton Gamma Ray Observatory (Mattox et al. 1997; Macomb et al. 1999; Hartman et al. 1999). | 4C 71.07 | Q | 16.50 | 2.172(6) | 2.59 | 1 | ||
| 0859470 | 4C 47.29 | Q | 18.70 | 1.462(7) | 1.78 | 1 | ||
| 0906015 | 4C 01.24 | Q | 17.50 | 1.018(1) | 1.04 | 4 | ||
| 1032199 | Q | 19.00 | 2.198(1) | 1.15 | 1 | |||
| 1124186 | Q | 19.00 | 1.048(1) | 1.62 | 1 | |||
| 1145071 | Q | 18.50 | 1.342(1) | 1.25 | 1 | |||
| 1148001 | 4C -00.47 | Q | 17.60 | 1.980(1) | 1.90 | 1 | ||
| 1345125 | 4C 12.50 | G | 17.00 | 0.121(1) | 2.91 | 3 | ||
| 1354152 | Q | 18.50 | 1.89(1) | 1.52 | 2 | |||
| 1354196 | 4C 19.44, DA 354 | Q | 16.02 | 0.719(1) | 1.56 | 2 | ||
| 1458718 | 4C 71.15, 3C 309.1, NRAO 0464 | Q | 16.78 | 0.905(8) | 3.39 | 2 | ||
| 1502106 | 4C 10.39 | Q | 15.50 | 1.833(1) | 2.56 | 2 | ||
| 1504167hhDetected by the EGRET instrument on the Compton Gamma Ray Observatory (Mattox et al. 1997; Macomb et al. 1999; Hartman et al. 1999). | Q | 18.50 | 0.876(1) | 1.98 | 2 | |||
| 1504377 | G | 21.20 | 0.674(1) | 1.10 | 1 | |||
| 1511100 | Q | 18.50 | 1.513(1) | 1.22 | 1 | |||
| 1514241 | AP Libræ | BL | 15.00 | 0.0486(1) | 2.00 | 1 | ||
| 1519273 | BL | 18.50 | 0.071 | 2.35 | 1 | |||
| 1538149 | 4C 14.6, 2E 3486 | BL | 15.50 | 0.605(1) | 1.96 | 1 | ||
| 1555001 | DA 393 | Q | 19.30 | 1.772(1) | 2.24 | 2 | ||
| 1622253hhDetected by the EGRET instrument on the Compton Gamma Ray Observatory (Mattox et al. 1997; Macomb et al. 1999; Hartman et al. 1999). | ROS 1 | Q | 20.60 | 0.786(1) | 2.08 | 2 | ||
| 1739522hhDetected by the EGRET instrument on the Compton Gamma Ray Observatory (Mattox et al. 1997; Macomb et al. 1999; Hartman et al. 1999). | 4C 51.37, 2E 3936 | Q | 18.50 | 1.375(6) | 1.98 | 1 | ||
| 1828487 | 3C 380, 4C 48.46, NRAO 565, CTA 79 | Q | 16.81 | 0.692(7) | 6.19 | 2 | ||
| 1954513 | Q | 18.50 | 1.223(9) | 1.43 | 2 | |||
| 2121053 | Q | 17.50 | 1.941(1) | 1.18iiTaken from the UMRAO Radio Survey Flux Database (http://www.astro.lsa.umich.edu/obs/radiotel/umrao.html, see Hughes et al. 1992). | 2 | |||
| 2128123 | Q | 15.98 | 0.501(1) | 2.07 | 3 | |||
| 2128048 | Q | 15.98 | 0.501(1) | 2.07 | 1 | |||
| 2155152 | Q | 17.50 | 0.672(1) | 1.77 | 1 | |||
| 2227088 | PHL 5225 | Q | 17.50 | 1.562(1) | 1.77 | 1 | ||
| 2255282hhDetected by the EGRET instrument on the Compton Gamma Ray Observatory (Mattox et al. 1997; Macomb et al. 1999; Hartman et al. 1999). | Q | 16.77 | 0.926(1) | 1.78 | 1 | |||
| 2318049 | Q | 19.00 | 0.623(1) | 1.13 | 2 | |||
| Sources from Table 1 in Paper I with newer parameters | ||||||||
| 0026346 | G | 20.17 | 0.517(10) | 1.27 | 4 | |||
| 0202149 | G | 22.10 | 0.405(11) | 2.47 | 5 | |||
| 0727115 | G? | 20.30 | 1.591(10) | 2.20 | 5 | |||
| 0814425 | BL | 18.50 | 0.245(12) | 1.69 | 7 | |||
| 1155251 | G | 17.50 | 0.202(10) | 1.16 | 5 | |||
| 1228126 | M87 | G | 9.60 | 0.0044(13) | 74.90 | 11 | ||
| 1302102 | Q | 14.90 | 0.278(14) | 1.17 | 5 | |||
| 1413135 | BL | 20.00 | 0.247(15) | 0.85 | 6 | |||
| 1656053 | Q | 16.50 | 0.879(16) | 2.16 | 4 | |||
| 2131021 | BL | 18.70 | 1.285(17) | 2.12 | 4 | |||
References. — (1) Kovalev et al. (1999) (2) Hewett et al. (1995) (3) Stickel et al. (1994) (4) Keel (1985) (5) Hewitt & Burbidge (1989) (6) Hutsemekers (1998) (7) Machalski (1998) (8) Nilsson (1998) (9) Polatidis et al. (1995) (10) See Appendix (11) Perlman et al. (1998) (12) Lawrence et al. (1996) (13) Smith et al. (2000) (14) Marziani et al. (1996) (15) Wiklind & Combes (1997) (16) Pravdo & Marshall (1984) (17) Drinkwater et al. (1997)
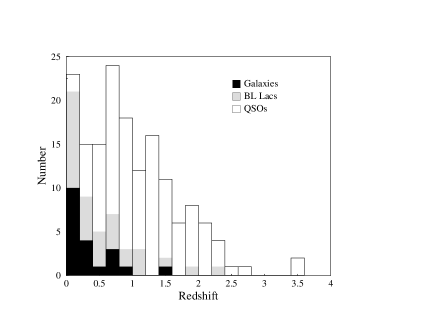
Figure 1 shows the distribution of redshifts for the sample. The galaxies and BL Lacs are concentrated at low redshift, while the quasars have a broad peak around =1. This is similar to the redshift distribution of the total Stickel et al. (1994) sample; see their Figure 1.
3 Observations
Table 2 lists the 39 additional sources and, at bottom, the 10 sources from Table 1 of Paper I for which new information has become available such as the redshift or identification. We use these new data in the discussion below.
We have continued our observing program described in Paper I with 12 additional epochs, from August 1997 to March 2001. Throughout, we observed with a bandwidth of 64 MHz using 1-bit samples and left-circular polarization. Each source was observed for 4–6 minutes once per hour, over a range of 8 hours. Three groups were observed per day with a maximum of 30 sources per day. Typical integration times on each source were 48 min.
The amplitude and phase calibration of the visibility data across the frequency channels and across time (usually refered to as a priori calibration and fringe fitting) were carried out for each source using techniques contained within aips. Initial hybrid imaging iterations and self-calibration proceeded with a standard difmap script (Pearson et al. 1994); hands-on further processing was carried out whenever obvious problems arose. More details on our data reduction methods are given in Paper I.
4 Discussion
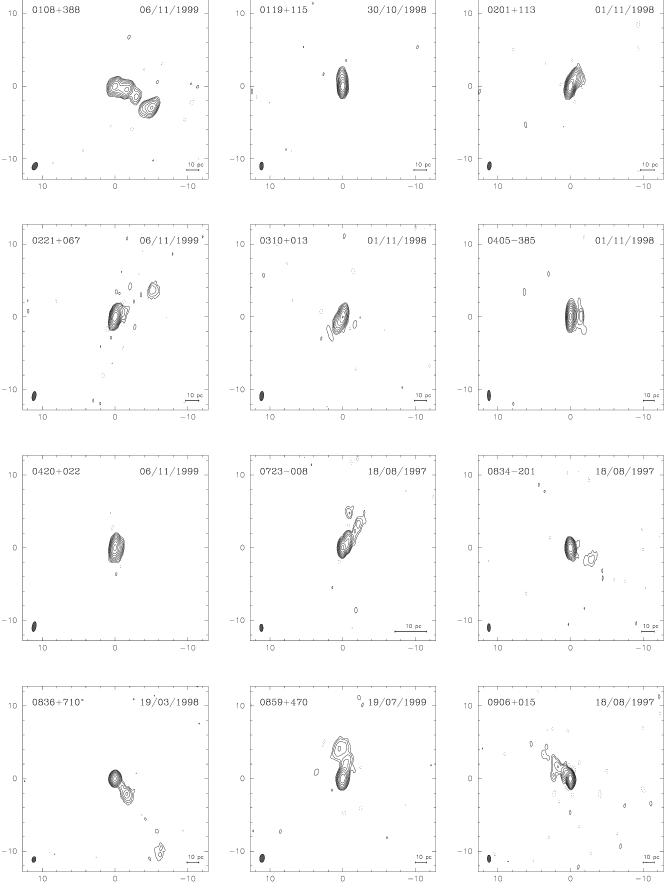
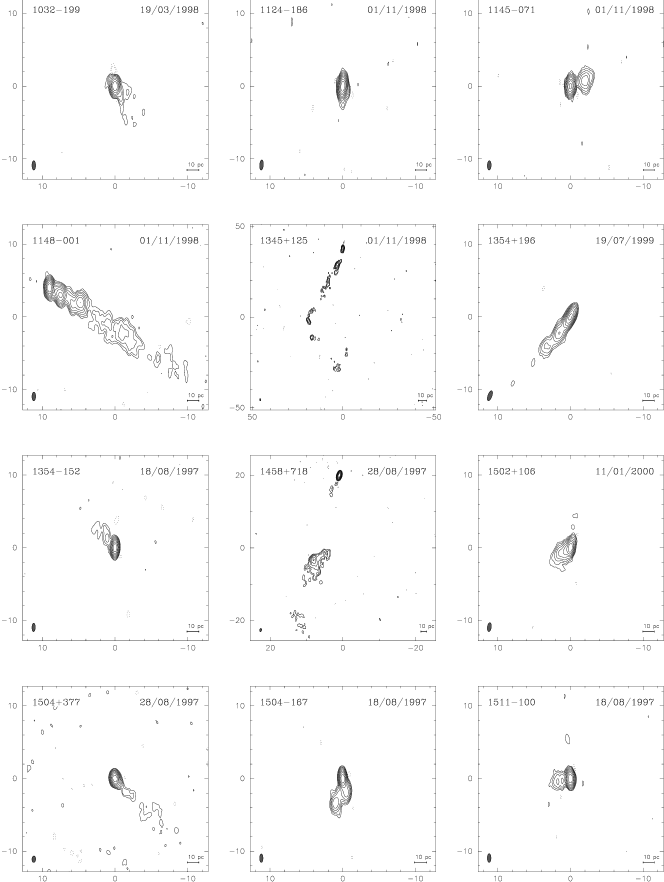
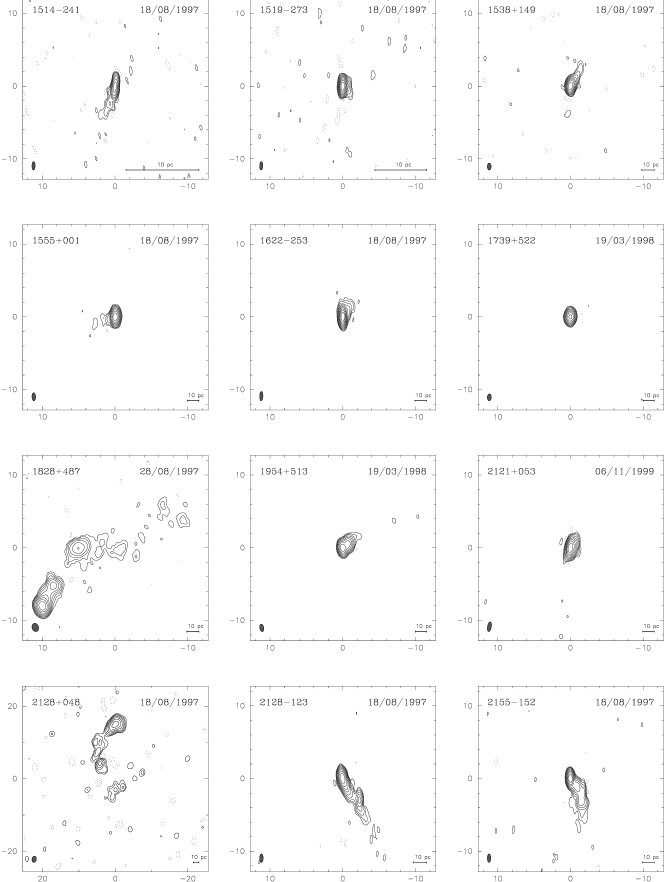
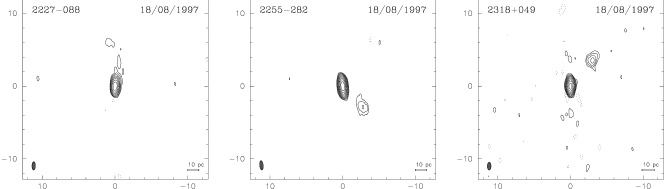
Table 2 lists the source properties derived from the contour diagrams which are shown in Figure 2. The columns are, successively, the IAU name, the total flux density at 15 GHz calculated from the VLBA images, the luminosity, the epoch, the lowest contour level shown in Figure 2 (equal to 3 times the root-mean-square noise), the major axis, minor axis, and position angle of the restoring beam, the peak brightness temperature from the images, and the morphological classification. The equation describing the brightness temperature given in Paper I contains two errors, although the entries in Table 3 (col 10) are correct. The correct expression which we have used in calculating the values of in both papers is where is the flux density in Jy beam-1 and and are the major and minor axes of the beamwidth in milliarcseconds (mas).
| Luminosity | Contour | P.A. | ||||||||
|---|---|---|---|---|---|---|---|---|---|---|
| Source | (Jy) | (W Hz-1) | Epoch | (mJy) | (mas) | (mas) | (∘) | (Jy beam-1) | (K) | StructureaaClassification of the structure, as follows: (C) compact, (SS) single-sided, or (Irr) irregular. |
| 0108388 | 0.43 | 6.11 | 06/11/1999 | 1.1 | 1.13 | 0.67 | –28.0 | 0.12 | 1.93 | SS |
| 0119115 | 1.37 | 1.40 | 30/10/1998 | 2.2 | 1.09 | 0.51 | –3.9 | 1.11 | 2.36 | C |
| 0201113 | 0.65 | 3.87 | 01/11/1998 | 0.9 | 1.15 | 0.52 | –7.6 | 0.47 | 2.73 | SS |
| 0221067 | 0.83 | 6.73 | 06/11/1999 | 1.4 | 1.29 | 0.54 | –10.3 | 0.71 | 1.17 | SS |
| 0310013 | 0.16 | 2.30 | 01/11/1998 | 0.8 | 1.29 | 0.55 | –6.2 | 0.11 | 1.91 | SS |
| 0405385 | 1.01 | 6.13 | 01/11/1998 | 2.4 | 1.43 | 0.44 | 1.4 | 0.79 | 2.20 | SS |
| 0420022 | 1.17 | … | 06/11/1999 | 2.7 | 1.37 | 0.54 | –10.6 | 0.91 | 9.31 | SS |
| 0723008 | 1.01 | 4.40 | 18/08/1997 | 1.8 | 1.03 | 0.47 | 1.1 | 0.60 | 1.06 | SS |
| 0834201 | 1.99 | 6.69 | 18/08/1997 | 2.9 | 1.09 | 0.43 | 0.6 | 1.47 | 9.01 | SS |
| 0836710 | 2.24 | 4.41 | 19/03/1998 | 4.5 | 0.80 | 0.52 | –12.3 | 1.49 | 8.58 | SS |
| 0859470 | 0.63 | 5.10 | 19/07/1999 | 1.9 | 1.14 | 0.66 | –7.1 | 0.47 | 1.19 | SS |
| 0906015 | 0.95 | 3.47 | 18/08/1997 | 1.8 | 1.00 | 0.46 | 2.6 | 0.88 | 2.89 | Irr |
| 1032199 | 1.25 | 2.54 | 19/03/1998 | 7.2 | 1.27 | 0.50 | 0.5 | 0.91 | 3.44 | SS |
| 1124186 | 2.82 | 1.09 | 01/11/1998 | 2.6 | 1.38 | 0.50 | –4.2 | 2.62 | 5.89 | C |
| 1145071 | 0.54 | 3.59 | 01/11/1998 | 1.2 | 1.27 | 0.52 | –2.2 | 0.39 | 1.06 | SS |
| 1148001 | 0.87 | 1.39 | 01/11/1998 | 0.7 | 1.17 | 0.51 | –1.0 | 0.36 | 1.35 | SS |
| 1345125 | 0.70 | 2.76 | 01/11/1998 | 1.2 | 1.16 | 0.62 | 5.9 | 0.14 | 1.62 | SS |
| 1354152 | 0.48 | 8.09 | 19/07/1999 | 1.5 | 1.43 | 0.55 | –19.8 | 0.51 | 8.43 | SS |
| 1354196 | 0.75 | 1.08 | 18/08/1997 | 0.9 | 1.14 | 0.46 | –1.5 | 0.43 | 1.84 | SS |
| 1458718 | 1.19 | 3.33 | 28/08/1997 | 1.2 | 0.86 | 0.51 | –13.1 | 0.62 | 2.03 | SS |
| 1502106 | 1.11 | 1.49 | 11/01/2000 | 3.0 | 1.23 | 0.53 | –7.6 | 0.76 | 2.52 | SS |
| 1504167 | 1.80 | 2.65 | 28/08/1997 | 1.1 | 0.88 | 0.51 | –2.9 | 0.55 | 1.55 | SS |
| 1504377 | 0.73 | 1.90 | 18/08/1997 | 2.4 | 1.16 | 0.46 | 0.0 | 1.18 | 3.13 | SS |
| 1511100 | 1.34 | 1.18 | 18/08/1997 | 4.5 | 1.20 | 0.50 | 0.1 | 1.13 | 3.61 | SS |
| 1514241 | 2.23 | 1.38 | 18/08/1997 | 6.0 | 1.16 | 0.44 | –1.3 | 1.21 | 1.91 | SS |
| 1519273 | 1.16 | 1.54 | 18/08/1997 | 1.0 | 1.15 | 0.43 | –2.0 | 1.00 | 1.64 | SS |
| 1538149 | 0.56 | 6.56 | 18/08/1997 | 0.8 | 0.95 | 0.52 | 0.0 | 0.42 | 1.05 | SS |
| 1555001 | 0.71 | 8.90 | 18/08/1997 | 1.1 | 1.08 | 0.50 | 1.6 | 0.56 | 2.19 | SS |
| 1622253 | 2.52 | 5.19 | 18/08/1997 | 2.3 | 1.26 | 0.46 | –1.7 | 2.34 | 5.51 | SS |
| 1739522 | 1.77 | 1.25 | 19/03/1998 | 3.9 | 0.93 | 0.54 | –1.7 | 1.31 | 4.70 | C |
| 1828487 | 1.96 | 3.07 | 28/08/1997 | 2.5 | 1.15 | 0.90 | 18.8 | 1.25 | 1.56 | SS |
| 1954513 | 0.94 | 5.12 | 19/03/1998 | 2.0 | 1.02 | 0.55 | 11.6 | 0.51 | 1.54 | SS |
| 2121053 | 2.50 | 3.83 | 06/11/1999 | 4.1 | 1.34 | 0.54 | –9.8 | 2.04 | 6.36 | SS |
| 2128123 | 1.99 | 1.54 | 18/08/1997 | 2.1 | 1.17 | 0.48 | –0.6 | 1.04 | 2.13 | SS |
| 2128048 | 0.51 | 1.75 | 18/08/1997 | 3.4 | 1.73 | 1.19 | –10.2 | 0.17 | 1.26 | SS |
| 2155152 | 1.66 | 2.43 | 18/08/1997 | 2.2 | 1.16 | 0.47 | 0.2 | 1.10 | 2.59 | SS |
| 2227088 | 0.46 | 4.29 | 18/08/1997 | 1.4 | 1.14 | 0.48 | –0.6 | 0.36 | 1.32 | C |
| 2255282 | 6.80 | 2.01 | 18/08/1997 | 6.5 | 1.29 | 0.48 | 6.0 | 6.49 | 1.55 | SS |
| 2318049 | 0.75 | 9.25 | 18/08/1997 | 0.9 | 1.06 | 0.51 | –0.7 | 0.69 | 1.57 | SS |
4.1 Morphology
The last column in Table 2 gives the morphological classification, as follows. C (compact) refers to sources that are unresolved, or barely resolved. SS refers to sources that appear to be single-sided; i.e. the presumed core, identified by compactness, is at one end of the brightness distribution. Irr (irregular) refers to those sources where the structure appears two-dimensional. This classification scheme is the same as that used in Paper I, where it is discussed in more detail.
Table 3 summarizes the classification for 169 of the combined set of 171 sources from this paper and from Paper I. Two sources in Paper I could not be classified: 0218+357 which is a lensed object (Patnaik et al. 1993), and 1328+254 which is nearly fully resolved. Objects near zero declination may have low-level artifacts located to the north or south of the real brightness distribution, and in a few cases the classification is ambiguous. See Section 5.
| StructureaaClassification of the structure, as follows: (C) compact, (SS) single-sided, (DS) double-sided, or (Irr) irregular. | Number | % |
|---|---|---|
| SS | 142 | 83 |
| C | 13 | 8 |
| DS | 8 | 5 |
| Irr | 6 | 4 |
Most of the sources appear single-sided, which is probably the result of Doppler favoritism: the approaching jet is relativistically-boosted and the receding jet is weakened and thus typically not detectable. As expected, all sources from the complete sample which show superluminal internal motions are in this category. Sources which show sub-luminal motions may have either a single-sided or a double-sided appearance. The internal motions will be discussed in detail by Kellermann et al. (in preparation).
4.2 Brightness Temperature
In many cases the compact components are unresolved by the 15 GHz VLBA synthesized beam. Most of them may be associated with the central structure, or core. The brightness temperature () in column (10) of Table 2 is calculated using the restoring beam area, and as such is a lower limit. The existence of much smaller entities with apparently very high values of is evidenced by intra-day variability (IDV) studies (Kraus et al. 1999; Quirrenbach et al. 2000; Kedziora-Chudczer et al. 2001)
A better estimate of component sizes which are smaller than the restoring beam size can be obtained by fitting elliptical Gaussian models to the visibility data. An example is given in Figure 3, where the visibility for the source 1622–253 is plotted as a function of . In this case the visibility is reduced by only 15% at 400 million wavelengths; this source can be modeled by two elliptical Gaussian components: one with 2.41 Jy, major axis 0.14 mas, and axial ratio of 0.59 (P.A. 21∘), giving Kelvin; the other component is circular and has a flux density of 0.08 Jy and a diameter of 0.4 mas at a distance of 0.79 mas (P.A. ) from the compact component.

VLBA data are generally of high quality: the noise is low (typically less than 0.5 mJy beam-1), the -coverage is good, and the relative fringe visibility, after self-calibration, accurate to a few percent. Therefore we feel justified in calculating models in this way, and using the small sizes to derive brightness temperatures. Table 4 shows estimated in this way, for sources that show nearly flat visibility plots. These temperatures are calculated in the AGN reference frame. They still must be considered lower limits, since a source like that in Figure 3 which drops slowly to 85% at the limit of our resolution can have one or more very small, possibly separated components.
4.2.1 Comparison of VLBA and Variability Brightness Temperatures
Flux density variations provide an alternative approach to estimating , independent of interferometry measurements. This uses the causality argument, that the time scale of a variation cannot be less than the light-crossing time of the varying emission region. Taking the two time scales to be equal, , gives the maximal allowed source radius , and hence the minimal allowed brightness temperature, , from the solid angle , where is the angular size distance to the source. The variability time scale is found from the logarithmic derivative (Burbidge et al. 1974). In this section we compare our measured brightness temperatures with those derived by Lähteenmäki & Valtaoja (1999) from flux density variations at 22 and 37 GHz.
Three coordinate frames are involved with these brightness temperatures, and to avoid confusion we use a superscript * for the frame of the relativistically moving plasma; we use no superscript for the frame of the AGN, and we will not define any quantities in the local coordinate frame. The transformations of and among these coordinate systems have different powers of and (the Doppler factor of the moving plasma). With several assumptions, this allows us to calculate the intrinsic brightness temperature . We have two values of : , and . Strictly speaking, and refer to different plasmas, because the measurements are at different wavelengths, and at different epochs.
In simple models of relativistic conical jets (e.g., Königl 1981) the radio radiation from the core comes mainly from the region of the jet where the optical depth is unity. This varies with wavelength because the density and magnetic field decrease with distance from the apex. But the velocity changes slowly if at all, and hence the Doppler factor can be assumed to be the same for all the frequencies we are using (15, 22, and 37 GHz), which are separated by a factor of only 2.5. The kinetic temperature, which controls the brightness temperature when the optical depth is unity, probably does change slowly along the jet; the biggest effect might be the sideways expansion of the plasma as it moves out. This effect likely is small over a frequency range of 2.5; and indeed the kinetic temperature has been taken as constant in various studies of jets (e.g. Zensus et al. 1995).
The fact that the data for a given source come from different epochs is of concern, but we assume that this is not important. The VLBA measurement refers to the core which seems to be a permanent feature of these sources, and not to features in the jet which are evanescent. And, the variability time scale appears to change little between outbursts in any one source (Valtaoja et al. 1999).
Thus, we assume that estimates of kinetic temperature derived from the VLBA and from the variability observations should be approximately the same. This is valid only for observations of the flat-spectrum core; it is not valid for the outer steep-spectrum components. Assuming , we derive formulas for estimating the intrinsic temperature and the Doppler factor:
| (1) |
| (2) |
Equation (1) is the same as Eq. (8) in Lähteenmäki et al. (1999).
Table 4 shows from (Lähteenmäki & Valtaoja 1999; Table 1) with values converted to =65 km s-1 Mpc-1, =0.5, for those sources which have both a VLBA and a variability brightness temperature. Columns 4 and 5 of Table 4 contain and , respectively, calculated from Eqs. (1) and (2). We note first that in every case . This is required for , so in this sense, the data are self-consistent. Values of range from barely relativistic for 0007+016 to for 0235+164 and 0804+499. 0235+164 is a known gamma-ray source, and various theories for gamma rays require high values of (Stecker & Tsuruta 1972; Mattox et al. 1993). Only four sources in Table 4 have EGRET measurements. No general conclusions can be drawn, but the sets of values are consistent with the idea that there is a high Doppler factor in gamma-ray sources.
It perhaps is surprising that the values obtained on the whole correspond well with expectations, since both and are lower limits, creating an extra margin of uncertainty in the derived values of and .
Lähteenmäki et al. (1999) make a similar analysis and show a plot of against , with diagonal lines indicating values of constant . Our results (Table 4) are in agreement with theirs: the points lie between and .
For many years a value of K has been taken as a limit to for a synchrotron radio source in equilibrium, because higher temperatures lead quickly to the “inverse-Compton catastrophe” which quenches the plasma and reduces its temperature to (Kellermann & Pauliny-Toth 1969). More recently, Readhead (1994) has suggested that the equipartition temperature or is more likely to be appropriate in most objects. Table 4 shows that is approached but not exceeded. The distribution of has a median value , suggesting that they are close to equipartition.
| Source | EGRET? | ||||
|---|---|---|---|---|---|
| 0007016 | 11.26 | 12.21 | 10.79 | 3.0 | |
| 0048097 | 11.83 | ||||
| 0235164 | 11.28 | 14.71 | 9.57 | 51.9 | Y |
| 0333321 | 11.68 | 13.50 | 10.77 | 8.1 | N |
| 0607157 | 12.18 | ||||
| 0642449 | 12.04 | 14.75 | 10.69 | 22.6 | |
| 0804499 | 11.96 | 15.32 | 10.28 | 47.9 | |
| 0808019 | 11.86 | ||||
| 0906015 | 12.48 | ||||
| 1253055 | 12.76 | 14.74 | 11.77 | 9.8 | Y |
| 1308326 | 11.73 | 14.24 | 10.48 | 18.0 | |
| 1354152 | 11.73 | ||||
| 1622253 | 12.18 | Y | |||
| 1638398 | 11.30 | ||||
| 1741038 | 12.08 | 13.92 | 11.16 | 8.3 | |
| 1749096 | 12.74 | 14.67 | 11.78 | 9.2 | |
| 1758388 | 11.60 | ||||
| 1921293 | 11.89 | ||||
| 2255282 | 12.30 | Y |
Our ground based VLBA observations are limited to an angular resolution of about 0.15 mas. For radio sources of a few Janskys, this corresponds to a measured brightness temperature of about K and our determination of is only a lower limit. The variability method is limited by time resolution; in the data we have quoted this is about 1 month, corresponding to a maximum measurable temperature of about K for =1. Faster flares, corresponding to higher temperatures, are not measurable. These limits are independent, and thus it is particularly interesting that the values in Table 4 are rather close to the values expected on the basis of synchrotron theory, and the observations of superluminal motion and X-ray flux. This agreement might mean that the true temperatures are not much above the limits. On the other hand, it may merely reflect a coincidence: 0.1 mas at =1 corresponds to 2 light years, which gives an observed light crossing time of about 1 month if the Doppler factor is 20. In this view the temperatures and Doppler factors in Table 4 are largely given by the observational limits on time and spatial resolution. It is important to test these ideas by improving the limits.
Lähteenmäki & Valtaoja (1999) actually turn this argument around, by assuming a particular value for to calculate . Our procedure is more powerful for the objects in common. But while we believe we have the requisite high-quality high-resolution interferometry data, we still rely on the fundamental assumptions that the actual brightness temperatures do not differ grossly from the limits obtained, and that .
5 Notes on individual sources
In this section we describe the morphological structure. “RRFID” indicates the observations at 2.3 and 8.4 GHz from the USNO Radio-Optical Reference Frame image database (Fey et al. 1996; Fey & Charlot 1997, 2000). “VPLS” indicates that the source was observed as part of the 6 cm VSOP Pre-Launch Survey (Fomalont et al. 2000).
0108+388
0119+115
This source is unresolved by 5 GHz polarization observations (Gabuzda et al. 1999). We observed the source at one epoch and it is slightly elongated to the north. No flux is detected below 2 mJy beam-1 beyond 2 mas from the brightness peak.
0201+113
This system has been extensively studied in the optical due to the peculiar spectroscopic characteristics of a Damped Lyman System towards the host galaxy (Ellison et al. 2001; Kanekar & Chengalur 1997; Oya et al. 1998), Hi was detected in the radio (de Bruyn et al. 1996). RRFID shows structure westward at 8.4 GHz and diffuse structure to the southwest at 2.3 GHz. In our images there is an elongated structure to the northwest, not extending beyond 2 mas.
0221+067
This is a flat spectrum, highly polarized QSO. Our image shows a component 6.3 mas to the northwest of the core. The structure at lower frequencies from RRFID is also elongated in this direction.
0310+013
This compact QSO shows a halo to the west at 4′′ in VLA images published by Price et al. (1993). In our 15 GHz image the source has a compact structure elongated to the southeast.
0405–385
0723–008
This BL Lac type object has a galactic latitude of . The RRFID images show a jet extending to the northwest at 8.4 GHz up to 7 mas and turns to the north at distances of 40 mas (2.3 GHz image). This structure is also seen on the 1.6 GHz images of Bondi et al. (1996). Our image from August 1997 shows a clear distinct component at 2 mas to the northwest and more diffuse emission extending to 6 mas from the core.
0834–201
This source is a flat-spectrum blazar (Hewitt & Burbidge 1989). The first VLBI observations of this radio source were carried out at 1.6 GHz by Kellermann et al. (1971). The VLBA calibrator survey images at 2.3 GHz shows a compact structure extending to the west (Beasley et al. 1996). Our images show a compact source with a very faint component 4 mas away in position angle (P.A.) .
0836+710
This radio source has a highly-polarized secondary component at a distance of 1.3′′ from the core along P.A. 200∘ (Perley 1982). MERLIN-VLBI data show a jet structure extending up to 150 mas in the direction to the outer arcsecond lobe (Hummel et al. 1992). The source has been monitored on pc-scales and shows a complex one-sided core-jet structure along P.A. 215∘. (Krichbaum et al. 1990; Otterbein et al. 1998; Lobanov et al. 1998; Hutchison et al. 2001; Ros et al. 2001; Lister et al. 2001). The jet follows a slightly curved path where components travel outwards at speeds of mas/yr (). Our images reveal a bright component 2 mas away from the core, and jet extended out to 12 mas. The brightness evolution reported by Peng et al. (2000) shows a slight rise by the mid 90’s reaching a peak around 1997 and decaying afterwards. Optical flares and X-ray flares have also been observed (von Linde et al. 1993; Malizia et al. 2000).
0859+470
This source has been observed with VLBI since the 1980’s (e.g. Zensus et al. 1984; Lawrence et al. 1985; Pearson & Readhead 1988; Lister et al. 2001, etc.). The RRFID images show an elongated, diffuse structure extending north up to 100 mas at 2.3 GHz. A 43 GHz VLBA image by Lister (2001) shows a curved jet structure one milliarcsecond from the core. Our images from July 1999 shows two clear components, at 2 and 4 mas from the core, in P.A. 10∘ and , respectively.
0906+015
The kpc-scale image from this flat-spectrum QSO published by Murphy et al. (1993) show a bright component 12′′ east of the core. The RRFID images show a jet towards the northeast, reaching 30 mas at 2.3 GHz. Our images show jet structure at the same direction, extending out to 3–4 mas.
1032–199
To our knowledge, no VLBI images from this source have been published before. Our image shows a bright core and some diffuse structure towards the southwest.
1124–186
The images and visibilities from the RRFID and from our data show a compact, unresolved source.
1145–071
1148–001
Kellermann et al. (1971) reported a compact structure of this source at pc-scales, and Inter Planetary Scintillation (IPS) observations suggested three compact components at kpc-scales (Venugopal et al. 1985). The RRFID images show a jet to the southwest turning to the south beyond 20 mas of the core, extending up to more than 40 mas at 2.3 GHz, and with a bright component at 3.2 mas, P.A. , and a more extended one at 10.9 mas, P.A. at 8.5 GHz. Our image from November 1998 reports a conspicuous jet extending to the southwest over 20 mas, with one component located 2 and other at 5 mas from the core.
1345+125
The extremely reddened (–=0.73, –=2.54) Seyfert 2 host galaxy contains two nuclei separated by (P.A. ) suggesting an ongoing merger (Gilmore & Shaw 1986). Axon et al. (2000) claim that the radio source is associated with the western component of the optical double nucleus from HST observations. This object is similar to Arp 220, the prototype mega-maser galaxy. The Arecibo flux density monitoring at 318 and 430 MHz (Salgado et al., 1999) shows no variations over a 14-year period. The structure of 1345+125 is discussed in more detail by Lister et al. (in preparation).
1354+196
This source was observed at 22 GHz by Moellenbrock et al. (1996) in the VSOP pre-launch survey. Our images show a core-jet structure to the southeast, with components at 2 and 5 mas from the core, consistent with RRFID results.
1354–152
Our images show compact structure elongated to the NE, with diffuse emission out to 3 mas.
1458+718
This is a prominent compact steep-spectrum radio source (van Breugel et al. 1984; Fanti et al. 1995). Aaron et al. (1997, 1998) studied the polarization and multi-frequency properties. Our image from August 1997 reveals a compact core and a more extended component 20 mas to the south, with some extended, diffuse emission. Lower-frequency images show emission connecting those two bright features and extending to 50 mas from the core before turning to the east (Aaron et al. 1998).
1502+106
Hardcastle et al. (1997) presented 1.5 and 8.4 GHz observations of this FRI radio galaxy. Their observations show a broad two-sided jet emanating from a bright, compact core, at P.A.. Martel et al. (1999) show HST images with a sub-kpc, elongated and dusty structure centered on its nucleus at P.A. . The radio jet is orthogonal to the major axis of the dusty structure. The RRFID images display a diffuse pc-structure 5–10 mas to the east of the compact core. Our images show a 3–4 mas structure extending to the southeast.
1504+377
Carilli et al. (1997) reported Hi absorption lines toward this inclined disk galaxy. Wiklind & Combes (1996) found seven different molecular lines toward this object. 1.6 GHz VLBI images by Polatidis et al. (1995) show an extended jet 100 mas to the southwest. The RRFID images show structure up to 70 mas at 2.3 GHz, and 15 mas at 8.4 GHz.
1504–167
5 GHz VLBI images from this highly polarized quasar (Shen et al. 1997) show a compact structure with three resolved components within 1–2 mas from the core. The RRFID data show a compact structure elongated southwards at 8.4 GHz. Our images show a non-linear three-component morphology, with the core, one component at 2 mas, P.A. -160∘, and one at 4 mas, P.A. 160∘ from the core.
1514–241
This nearby N-type galaxy displays high variability in the optical, reaching rates of 0.060.01 mag hr-1 (Carini et al. 1991; Bond 1971). The HST images published by Scarpa et al. (2000) show a bright point surrounded by a large, round elliptical host. It has a pc-scale straight radio jet extending at least 20′′ to the east of the core at P.A. 88∘ (Morganti et al. 1993). Lister et al. (1998) published 43 GHz polarimetric images of this object, showing a jet pointing towards P.A. , within 1 mas of the core, then turning to P.A. 157∘. The RRFID images show a jet towards the southeast. Our image shows structure towards the southeast, out to 5 mas.
1519–273
This BL Lac object has a featureless spectrum, and a high degree (5–12%) of variable optical linear polarization (Impey & Tapia 1988). It displays IDV at radio frequencies, and also in circular polarization (Macquart et al. 2000). It is unresolved at kpc-scales (Cassaro et al. 1999). Our image shows a very compact structure with slight extension to the west.
1538+149
This is an optically variable BL Lac object. Ulvestad et al. (1983) report an unresolved structure within 4′′ at kpc-scales, with hints of extension northwards. The RRFID images show emission towards the northwest up to 60 mas at 2.3 GHz and up to 10 mas at 8.4 GHz. Our image shows only the inner part of this elongated structure.
1555+001
Our images show a very compact structure with some emission to the east, extending up to 5–6 mas at the 1 mJy beam-1 level.
1622–253
Morganti et al. (1993) report an unresolved radio structure at kpc scales. The RRFID images show diffuse emission to the north and northwest, without identifiable components from one epoch to another. Our images show a compact structure extending up to 3 mas to the northwest at the 1.5 mJy beam-1 level.
1739+522
A MERLIN image of this highly polarized QSO shows a secondary component 3′′ away from the core (Reid et al. 1995). A high-resolution 43 GHz image of the core region by Lister (2001) shows a jet that starts out in an easterly direction and curves over 90∘ to the north. Our image shows only an unresolved structure.
1828+487
This is a powerful FRII CSS radio source surrounded by a halo of 149′′ in size (van Breugel et al. 1992). The superluminal motions in this source are described by Polatidis & Wilkinson (1998). Taylor (1998) reported high rotation measures at parsec scales. The source has a prominent jet extending towards the northwest, which is also visible in our image. Components can be identified at distances of 4 and 10 mas from the core in P.A. 30∘. Similar structures are visible in the 5 GHz space-VLBI image of Lister et al. (2001).
1954+513
The 5 GHz VLA images from Kollgaard et al. (1990) shows a north-south double-sided jet, with two components at 5 and 10′′ north of the core, and one at 7′′ to the south. Our image shows a well-defined jet that extends for approximately 10 mas to the northwest at P.A. , which agrees with a recent 5 GHz space-VLBI image by Lister et al. (2001). This jet extends more than 80 mas at 2.3 GHz in the RRFID images.
2121+053
Over the past decades, data from the UMRAO show a slow variation in flux density of this source at 15 GHz (e.g. Aller et al. 1992). The kpc-scale images from Murphy et al. (1993) show an unresolved source with hints of emission to the east. Our images show a very compact structure, elongated to the west.
2128–123
This is a radio-variable, flat-spectrum QSO. Our images show the same highly curved jet structure as in the RRFID images with a prominent component located 3.7 mas from the core.
2128+048
This very red and weak galaxy has a radio spectrum which is peaked near 600 MHz. The 8.4 GHz pc-scale images from Dallacasa et al. (1998) report a triple component structure with a possible tail at 2.3 GHz, compatible with the images from Stanghellini et al. (1997). Our image shows a core-jet structure with an elongated core to the southeast and with further components at 10 mas (P.A. 160∘) and 20 mas (P.A. 180∘) from the core.
2155–152
On kpc-scales this source displays a triple structure extending 6′′ in the north-south direction (Perley 1982). The 5 GHz images published by Shen et al. (1998) show a compact core-jet structure aligned with the kpc-scale image. Our image shows a jet towards the south with a bright jet and three components up to 7 mas away.
2227–088
Our images show a very compact core with some faint emission extending towards the north, up to 6 mas at 1 mJy beam-1, compatible with the RRFID images.
2255–282
This is an optically variable radio source. A gamma-ray flare was detected from EGRET in 1997 (Macomb et al. 1999). It has been studied at different radio frequencies and scales by Tornikoski et al. (1999) before and after the flare. They present a 5 GHz VLBA image with a jet pointing towards the southwest (also seen in the RRFID images), but their higher frequency observations show only an unresolved source. Our images show a compact core and a component at P.A. .
2318+049
VLA images (Hutchings et al. 1998) show an unresolved structure slightly elongated along P.A. . Our images also show a core-jet structure oriented in the same direction with one distinct component located 5 mas off the core (seen also in the RRFID images).
Appendix A Three new spectroscopic redshifts
A 3000 sec exposure on 0026+346 was obtained at the Palomar 200′′ telescope by R.C. Vermeulen and G.B. Taylor on 1996 January 14, using the COSMIC spectrograph (Kells et al. 1998). with a 300 g mm-1 grism and a 1.5′′ slit. Superimposed on a red continuum, the emission lines of [Oii] and [Oiii] are prominent, as is [Oiii] , but the centroid of the latter is not well-determined because it falls in the terrestrial atmospheric A-band absorption. From the host galaxy, a Caii H absorption line, 4000 Å-break, and 4300 Å G-band are also clearly visible. All features in the spectrum are consistent with a redshift of . In NED, 0026+346 is listed with a redshift of =0.6. As far as we have been able to ascertain, this value is a photometric estimate —rather accurate, as we now find— which can be traced back uniquely to a paper by Hutchings et al. (1994).
Observations of 0727–115 and 1155+251 were made at the Keck II telescope by M.H. Cohen and R.W. Goodrich on 2000 January 8. The LRIS spectrograph (Oke et al., 1995) was used with the polarimetry module (Goodrich et al., 1995) and the 300 g/mm grating with the 1′′ slit. The sky had thin variable clouds.
One exposure of duration 300 sec was obtained for 0727–115. This object is only 3 degrees from the galactic plane and is faint, but clearly extended. Comparison with HD245310 (=9.10; Schmidt et al. 1992) yields . Civ , Ciii] and Mgii are prominent and give z=1.5885, 1.5895, and 1.600 respectively. The Ciii] line is cleaner and has higher S/N than the others, and the weighted redshift is 1.591.
There apparently is no published spectrum for 1155+251. The Keck observations show that this bright, narrow-line radio galaxy is reddened and has weak broad H emission. The redshift is 0.2016, based on a direct comparison between the strong lines [Oiii] and the nearby night sky lines [Oi] and Nai . Other prominent lines include [Oii] , [Neiii] , H, H/[Nii], and [Sii] .
References
- Aaron et al. (1997) Aaron, S. E., Wardle, J. F. C., & Roberts, D. H. 1997, Vistas in Astronomy, 41, 225
- Aaron et al. (1998) Aaron, S. E., Wardle, J. F. C., & Roberts, D. H. 1998, in ASP Conf. Ser. 144: IAU Colloq. 164, Radio Emission from Galactic and Extragalactic Compact Sources, ed. J.A. Zensus, G.B. Taylor, & J.M. Wrobel (San Francisco: ASP), 105
- Aller et al. (1992) Aller, M. F., Aller, H. D., & Hughes, P. A. 1992, ApJ, 399, 16
- Axon et al. (2000) Axon, D. J., Capetti, A., Fanti, R., Morganti, R., Robinson, A., & Spencer, R. 2000, AJ, 120, 2284
- Beasley et al. (1996) Beasley, A. J., Dhawan, V., Fomalont, E. B., & et al. 1996, in IAU Symp. 175: Extragalactic Radio Sources, ed. R. Ekers, C. Fanti, & L. Padrielli (Dordrecht: Kluwer), Vol. 175, 527
- Bond (1971) Bond, H. E. 1971, ApJ, 167, L79
- Bondi et al. (1996) Bondi, M., Padrielli, L., Fanti, R., Ficarra, A., Gregorini, L., Mantovani, F., Bartel, N., Romney, J. D., Nicolson, G. D., & Weiler, K. W. 1996, A&A, 308, 415
- Burbidge et al. (1974) Burbidge, G. R., Jones, T. W., & Odell, S. L. 1974, ApJ, 193, 43
- Carilli et al. (1997) Carilli, C. L., Menten, K. M., Reid, M. J., & Rupen, M. P. 1997, ApJ, 474, L89
- Carini et al. (1991) Carini, M. T., Miller, H. R., Noble, J. C., & Sadun, A. C. 1991, AJ, 101, 1196
- Cassaro et al. (1999) Cassaro, P., Stanghellini, C., Bondi, M., Dallacasa, D., della Ceca, R., & Zappalà, R. A. 1999, A&AS, 139, 601
- Dallacasa et al. (1998) Dallacasa, D., Bondi, M., Alef, W., & Mantovani, F. 1998, A&AS, 129, 219
- de Bruyn et al. (1996) de Bruyn, A. G., O’Dea, C. P., & Baum, S. A. 1996, A&A, 305, 450
- Djorgovski et al. (1987) Djorgovski, S., Perley, R., Meylan, G., & McCarthy, P. 1987, ApJ, 321, L17
- Drinkwater et al. (1997) Drinkwater, M. J., Webster, R. L., Francis, P. J., Condon, J. J., Ellison, S. L., Jauncey, D. L., Lovell, J., Peterson, B. A., & Savage, A. 1997, MNRAS, 284, 85
- Ellison et al. (2001) Ellison, S. L., Pettini, M., Steidel, C. C., & Shapley, A. E. 2001, ApJ, 549, 770
- Fanti et al. (1995) Fanti, C., Fanti, R., Dallacasa, D., Schilizzi, R. T., Spencer, R. E., & Stanghellini, C. 1995, A&A, 302, 317
- Fey & Charlot (1997) Fey, A. L. & Charlot, P. 1997, ApJS, 111, 95
- Fey & Charlot (2000) —. 2000, ApJS, 128, 17
- Fey et al. (1996) Fey, A. L., Clegg, A. W., & Fomalont, E. B. 1996, ApJS, 105, 299
- Fomalont et al. (2000) Fomalont, E. B., Frey, S., Paragi, Z., Gurvits, L. I., Scott, W. K., Taylor, A. R., Edwards, P. G., & Hirabayashi, H. 2000, ApJS, 131, 95
- Gabuzda et al. (1999) Gabuzda, D. C., Pushkarev, A. B., & Cawthorne, T. V. 1999, MNRAS, 307, 725
- Gilmore & Shaw (1986) Gilmore, G. & Shaw, M. A. 1986, Nature, 321, 750
- Goodrich et al. (1995) Goodrich, R. W., Cohen, M. H., & Putney, A. 1995, PASP, 107, 179
- Hardcastle et al. (1997) Hardcastle, M. J., Alexander, P., Pooley, G. G., & Riley, J. M. 1997, MNRAS, 288, L1
- Hartman et al. (1999) Hartman, R. C., Bertsch, D. L., Bloom, S. D., Chen, A. W., Deines-Jones, P., Esposito, J. A., Fichtel, C. E., Friedlander, D. P., Hunter, S. D., McDonald, L. M., Sreekumar, P., Thompson, D. J., Jones, B. B., Lin, Y. C., Michelson, P. F., Nolan, P. L., Tompkins, W. F., Kanbach, G., Mayer-Hasselwander, H. A., Mücke, A., Pohl, M., Reimer, O., Kniffen, D. A., Schneid, E. J., von Montigny, C., Mukherjee, R., & Dingus, B. L. 1999, ApJS, 123, 79
- Hewett et al. (1995) Hewett, P. C., Foltz, C. B., & Chaffee, F. H. 1995, AJ, 109, 1498
- Hewitt & Burbidge (1989) Hewitt, A. & Burbidge, G. 1989, ApJS, 69, 1
- Hughes et al. (1992) Hughes, P. A., Aller, H. D., & Aller, M. F. 1992, ApJ, 396, 469
- Hummel et al. (1992) Hummel, C. A., Muxlow, T. W. B., Krichbaum, T. P., Quirrenbach, A., Schalinski, C. J., Witzel, A., & Johnston, K. J. 1992, A&A, 266, 93
- Hutchings et al. (1998) Hutchings, J. B., Dewey, A., Chaytor, D., Ryneveld, S., Gower, A. C., & Ellingson, E. 1998, PASP, 110, 111
- Hutchings et al. (1994) Hutchings, J. B., Neff, S. G., Weadock, J., Roberts, L., Ryneveld, S., & Gower, A. C. 1994, AJ, 107, 471
- Hutchison et al. (2001) Hutchison, J. M., Cawthorne, T. V., & Gabuzda, D. C. 2001, MNRAS, 321, 525
- Hutsemekers (1998) Hutsemekers, D. 1998, A&A, 332, 410
- Impey & Tapia (1988) Impey, C. D. & Tapia, S. 1988, ApJ, 333, 666
- Kanekar & Chengalur (1997) Kanekar, N. & Chengalur, J. N. 1997, MNRAS, 292, 831
- Kedziora-Chudczer et al. (1998) Kedziora-Chudczer, L., Jauncey, D., Tzioumis, A., Reynolds, J., Wieringa, M., Nicholson, G., & Bignall, H. 1998, IAU Circ., 7066, 2
- Kedziora-Chudczer et al. (1996) Kedziora-Chudczer, L., Jauncey, D., Wieringa, M., Reynolds, J., Tzioumis, A., & Nicholson, G. 1996, IAU Circ., 6418, 2
- Kedziora-Chudczer et al. (1997) Kedziora-Chudczer, L., Jauncey, D. L., Wieringa, M. H., Walker, M. A., Nicolson, G. D., Reynolds, J. E., & Tzioumis, A. K. 1997, ApJ, 490, L9
- Kedziora-Chudczer et al. (2001) Kedziora-Chudczer, L. L., Jauncey, D. L., Wieringa, M. H., Tzioumis, A. K., & Reynolds, J. E. 2001, MNRAS, 325, 1411
- Keel (1985) Keel, W. C. 1985, AJ, 90, 2207
- Kellermann et al. (1971) Kellermann, K. I., Jauncey, D. L., Cohen, M. H., Shaffer, B. B., Clark, B. G., Broderick, J., Rönnäng, B., Rydbeck, O. E. H., Matveyenko, L., Moiseyev, I., Vitkevitch, V. V., Cooper, B. F. C., & Batchelor, R. 1971, ApJ, 169, 1
- Kellermann & Pauliny-Toth (1969) Kellermann, K. I. & Pauliny-Toth, I. I. K. 1969, ApJ, 155, L71
- Kellermann et al. (1998) Kellermann, K. I., Vermeulen, R. C., Zensus, J. A., & Cohen, M. H. 1998, AJ, 115, 1295
- Kells et al. (1998) Kells, W., Dressler, A., Sivaramakrishnan, A., Carr, D., Koch, E., Epps, H., Hilyard, D., & Pardeilhan, G. 1998, PASP, 110, 1487
- Kochanek et al. (1999) Kochanek, C. S., Falco, E. E., & Muñoz, J. A. 1999, ApJ, 510, 590
- Kollgaard et al. (1990) Kollgaard, R. I., Wardle, J. F. C., & Roberts, D. H. 1990, AJ, 100, 1057
- Königl (1981) Königl, A. 1981, ApJ, 243, 700
- Kovalev et al. (1999) Kovalev, Y. Y., Nizhelsky, N. A., Kovalev, Y. A., Berlin, A. B., Zhekanis, G. V., Mingaliev, M. G., & Bogdantsov, A. V. 1999, A&AS, 139, 545
- Kraus et al. (1999) Kraus, A., Witzel, A., Krichbaum, T. P., Lobanov, A. P., Peng, B., & Ros, E. 1999, A&A, 352, L107
- Krichbaum et al. (1990) Krichbaum, T. P., Hummel, C. A., Quirrenbach, A., Schalinski, C. J., Witzel, A., Johnson, K. J., Muxlow, T. W. B., & Qian, S. J. 1990, A&A, 230, 271
- Lähteenmäki & Valtaoja (1999) Lähteenmäki, A. & Valtaoja, E. 1999, ApJ, 521, 493
- Lähteenmäki et al. (1999) Lähteenmäki, A., Valtaoja, E., & Wiik, K. 1999, ApJ, 511, 112
- Lawrence et al. (1985) Lawrence, C. R., Readhead, A. C. S., Linfield, R. P., Payne, D. G., Preston, R. A., Schilizzi, R. T., Porcas, R. W., Booth, R. S., & Burke, B. F. 1985, ApJ, 296, 458
- Lawrence et al. (1996) Lawrence, C. R., Zucker, J. R., Readhead, A. C. S., Unwin, S. C., Pearson, T. J., & Xu, W. 1996, ApJS, 107, 541
- Lister (2001) Lister, M. L. 2001, ApJ, 562, 208
- Lister et al. (1998) Lister, M. L., Marscher, A. P., & Gear, W. K. 1998, ApJ, 504, 702
- Lister et al. (2001) Lister, M. L., Tingay, S. J., & Preston, R. A. 2001, ApJ, 554, 964
- Lobanov et al. (1998) Lobanov, A. P., Krichbaum, T. P., Witzel, A., Kraus, A., Zensus, J. A., Britzen, S., Otterbein, K., Hummel, C. A., & Johnston, K. 1998, A&A, 340, L60
- Machalski (1998) Machalski, J. 1998, A&AS, 128, 153
- Macomb et al. (1999) Macomb, D. J., Gehrels, N., & Shrader, C. R. 1999, ApJ, 513, 652
- Macquart et al. (2000) Macquart, J. ., Kedziora-Chudczer, L., Rayner, D. P., & Jauncey, D. L. 2000, ApJ, 538, 623
- Malizia et al. (2000) Malizia, A., Bassani, L., Dean, A. J., McCollough, M., Stephen, J. B., Zhang, S. N., & Paciesas, W. S. 2000, ApJ, 531, 642
- Martel et al. (1999) Martel, A. ., Baum, S. A., Sparks, W. B., Wyckoff, E., Biretta, J. A., Golombek, D., Macchetto, F. D., de Koff, S., McCarthy, P. J., & Miley, G. K. 1999, ApJS, 122, 81
- Marziani et al. (1996) Marziani, P., Sulentic, J. W., Dultzin-Hacyan, D., Calvani, M., & Moles, M. 1996, ApJS, 104, 37+
- Mattox et al. (1997) Mattox, J., Schachter, J., Molnar, L., Hartman, R., & Patnaik, A. 1997, APJ, 481, 95
- Mattox et al. (1993) Mattox, J. R., Bertsch, D. L., Chiang, J., Dingus, B. L., Fichtel, C. E., Hartman, R. C., Hunter, S. D., Kanbach, G., Kniffen, D. A., Kwok, P. W., Lin, Y. C., Mayer-Hasselwander, H. A., Michelson, P. F., von Montigny, C., Nolan, P. L., Pinkau, K., Schneid, E., Sreekumar, P., & Thompson, D. J. 1993, ApJ, 410, 609
- Moellenbrock et al. (1996) Moellenbrock, G. A., Fujisawa, K., Preston, R. A., Gurvits, L. I., Dewey, R. J., Hirabayashi, H., Inoue, M., Kameno, S., Kawaguchi, M., Iwata, T., Jauncey, D. L., Migenes, V., Roberts, D. H., Schilizzi, R. T., & Tingay, S. J. 1996, AJ, 111, 2174
- Morganti et al. (1993) Morganti, R., Killeen, N. E. B., & Tadhunter, C. N. 1993, MNRAS, 263, 1023
- Murphy et al. (1993) Murphy, D. W., Browne, I. W. A., & Perley, R. A. 1993, MNRAS, 264, 298
- Napier (1994) Napier, P. J. 1994, in IAU Symp. 158: Very High Angular Resolution Imaging, ed. J.G. Robertson & W.J. Tango (Dordrecht: Kluwer), Vol. 158, 117
- Nilsson (1998) Nilsson, K. 1998, A&AS, 132, 31
- Oke et al. (1995) Oke, J. B., Cohen, J. G., Carr, M., Cromer, J., Dingizian, A., Harris, F. H., Labrecque, S., Lucinio, R., Schaal, W., Epps, H., & Miller, J. 1995, PASP, 107, 375
- Otterbein et al. (1998) Otterbein, K., Krichbaum, T. P., Kraus, A., Lobanov, A. P., Witzel, A., Wagner, S. J., & Zensus, J. A. 1998, A&A, 334, 489
- Owsianik et al. (1998) Owsianik, I., Conway, J. E., & Polatidis, A. G. 1998, A&A, 336, L37
- Oya et al. (1998) Oya, S., Iwamuro, F., Tsukamoto, H., & Maihara, T. 1998, PASJ, 50, 163
- Patnaik et al. (1993) Patnaik, A. R., Browne, I. W. A., King, L. J., Muxlow, T. W. B., Walsh, D., & Wilkinson, P. N. 1993, MNRAS, 261, 435
- Pearson & Readhead (1988) Pearson, T. J. & Readhead, A. C. S. 1988, ApJ, 328, 114
- Pearson et al. (1994) Pearson, T. J., Shepherd, M. C., Taylor, G. B., & Myers, S. T. 1994, American Astronomical Society Meeting, 185
- Peng et al. (2000) Peng, B., Kraus, A., Krichbaum, T. P., & Witzel, A. 2000, A&AS, 145, 1
- Perley (1982) Perley, R. A. 1982, AJ, 87, 859
- Perlman et al. (1998) Perlman, E. S., Padovani, P., Giommi, P., Sambruna, R., Jones, L. R., Tzioumis, A., & Reynolds, J. 1998, AJ, 115, 1253
- Polatidis & Wilkinson (1998) Polatidis, A. G. & Wilkinson, P. N. 1998, MNRAS, 294, 327
- Polatidis et al. (1995) Polatidis, A. G., Wilkinson, P. N., Xu, W., Readhead, A. C. S., Pearson, T. J., Taylor, G. B., & Vermeulen, R. C. 1995, ApJS, 98, 1
- Pravdo & Marshall (1984) Pravdo, S. H. & Marshall, F. E. 1984, ApJ, 281, 570
- Price et al. (1993) Price, R., Gower, A. C., Hutchings, J. B., Talon, S., Duncan, D., & Ross, G. 1993, ApJS, 86, 365
- Quirrenbach et al. (2000) Quirrenbach, A., Kraus, A., Witzel, A., Zensus, J. A., Peng, B., Risse, M., Krichbaum, T. P., Wegner, R., & Naundorf, C. E. 2000, A&AS, 141, 221
- Rayner et al. (2000) Rayner, D. P., Norris, R. P., & Sault, R. J. 2000, MNRAS, 319, 484
- Readhead (1994) Readhead, A. C. S. 1994, ApJ, 426, 51
- Reid et al. (1995) Reid, A., Shone, D. L., Akujor, C. E., Browne, I. W. A., Murphy, D. W., Pedelty, J., Rudnick, L., & Walsh, D. 1995, A&AS, 110, 213
- Ros et al. (2001) Ros, E., Marcaide, J. M., Guirado, J. C., & Pérez-Torres, M. A. 2001, A&A, 376, 1090
- Salgado et al. (1999) Salgado, J. ., Altschuler, D. R., Ghosh, T., Dennison, B. K., Mitchell, K. J., & Payne, H. E. 1999, ApJS, 120, 77
- Scarpa et al. (2000) Scarpa, R., Urry, C. M., Falomo, R., Pesce, J. E., & Treves, A. 2000, ApJ, 532, 740
- Schmidt et al. (1992) Schmidt, G. D., Elston, R., & Lupie, O. L. 1992, AJ, 104, 1563
- Shen et al. (1997) Shen, Z. ., Wan, T. ., Moran, J. M., Jauncey, D. L., Reynolds, J. E., Tzioumis, A. K., Gough, R. G., Ferris, R. H., Sinclair, M. W., Jiang, D. ., Hong, X. ., Liang, S. ., Costa, M. E., Tingay, S. J., McCulloch, P. M., Lovell, J. E. J., King, E. A., Nicolson, G. D., Murphy, D. W., Meier, D. L., van Ommen, R. D., Edwards, P. G., & White, G. L. 1997, AJ, 114, 1999
- Shen et al. (1998) Shen, Z. ., Wan, T. ., Moran, J. M., Jauncey, D. L., Reynolds, J. E., Tzioumis, A. K., Gough, R. G., Ferris, R. H., Sinclair, M. W., Jiang, D. ., Hong, X. ., Liang, S. ., Edwards, P. G., Costa, M. E., Tingay, S. J., McCulloch, P. M., Lovell, J. E. J., King, E. A., Nicolson, G. D., Murphy, D. W., Meier, D. L., van Ommen, T. D., & White, G. L. 1998, AJ, 115, 1357
- Smith et al. (2000) Smith, R. J., Lucey, J. R., Hudson, M. J., Schlegel, D. J., & Davies, R. L. 2000, MNRAS, 313, 469
- Stanghellini et al. (1997) Stanghellini, C., O’Dea, C. P., Baum, S. A., Dallacasa, D., Fanti, R., & Fanti, C. 1997, A&A, 325, 943
- Stecker & Tsuruta (1972) Stecker, F. W. & Tsuruta, S. 1972, Nature, 235, 8
- Stickel et al. (1994) Stickel, M., Meisenheimer, K., & Kuehr, H. 1994, A&AS, 105, 211
- Taylor (1998) Taylor, G. B. 1998, ApJ, 506, 637
- Tornikoski et al. (1999) Tornikoski, M., Tingay, S. J., Mücke, A., Chen, A., Connaughton, V., Jauncey, D. L., Johnston-Hollitt, M., Kemp, J., King, E. A., McGee, P., Rantakyrö, F., Rayner, D., Reimer, O., & Tzioumis, A. K. 1999, AJ, 118, 1161
- Ulvestad et al. (1983) Ulvestad, J. S., Johnston, K. J., & Weiler, K. W. 1983, ApJ, 266, 18
- Valtaoja et al. (1999) Valtaoja, E., Lähteenmäki, A., Teräsranta, H., & Lainela, M. 1999, ApJS, 120, 95
- van Breugel et al. (1984) van Breugel, W., Miley, G., & Heckman, T. 1984, AJ, 89, 5
- van Breugel et al. (1992) van Breugel, W. J. M., Fanti, C., Fanti, R., Stanghellini, C., Schilizzi, R. T., & Spencer, R. E. 1992, A&A, 256, 56
- Venugopal et al. (1985) Venugopal, V. R., Ananthakrishnan, S., Swarup, G., Pynzar, A. V., & Udaltsov, V. A. 1985, MNRAS, 215, 685
- von Linde et al. (1993) von Linde, J., Borgeest, U., Schramm, K. ., Graser, U., Heidt, J., Hopp, U., Meisenheimer, K., Nieser, L., Steinle, H., & Wagner, S. 1993, A&A, 267, L23
- Wiklind & Combes (1996) Wiklind, T. & Combes, F. 1996, A&A, 315, 86
- Wiklind & Combes (1997) —. 1997, A&A, 328, 48
- Zensus (1997) Zensus, J. A. 1997, ARA&A, 35, 607
- Zensus et al. (1995) Zensus, J. A., Cohen, M. H., & Unwin, S. C. 1995, ApJ, 443, 35
- Zensus et al. (1984) Zensus, J. A., Porcas, R. W., & Pauliny-Toth, I. I. K. 1984, A&A, 133, 27